 Open Access Article
A novel colorimetric paper sensor based on the layer-by-layer assembled multilayers of surfactants for the sensitive and selective determination of total antioxidant capacity †
Siriboon Mukdasai *a,
Pikaned Uppachaib and
Supalax Srijaranai
 a
a
aMaterials Chemistry Research Center, Department of Chemistry, Faculty of Science, Khon Kaen University, Khon Kaen 40002, Thailand. E-mail: sirimuk@kku.ac.th; Fax: +66-43-202376; Tel: +66-43-202376 to 136
bDepartment of Applied Physics, Faculty of Engineering, Rajamangala University of Technology Isan, Khon Kaen Campus, Khon Kaen 40000, Thailand
First published on 11th September 2019
Abstract
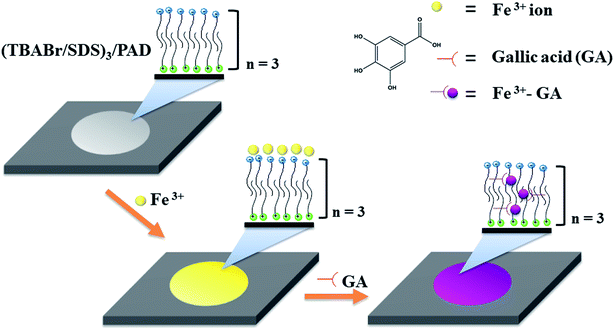
Herein, a new colorimetric paper sensor based on the layer-by-layer assembled multilayers of a cationic surfactant, tetrabutylammonium bromide (TBABr), and an anionic surfactant, sodium dodecyl sulfate (SDS), modified on filter paper was developed for the determination of total antioxidant capacity (TAC). In this study, gallic acid (GA) was used as the antioxidant standard. The fabricated (TBABr/SDS)3/PAD was loaded with Fe3+ ions to obtain Fe3+/(TBABr/SDS)3/PAD, exhibiting high selectivity for the detection of GA when compared with the case of other metal ions. The interaction between GA and the Fe3+/(TBABr/SDS)3/PAD sensor occurred rapidly, and the colorimetric paper sensor changed from yellow to purple immediately. The quantitative detection of GA was enabled by taking an image using an ordinary smartphone and applying the ImageJ software based on the change in color. Under optimum conditions, a linear response was obtained between the change in the color of the sensor and the TAC value expressed in terms of gallic acid equivalents. The linear range was from 0.50 μM to 6.50 mM with the detection limit of 0.35 μM. The colorimetric paper sensor was applied to detect the TAC in three kinds of green tea and vegetable samples, which provided the good recoveries of 86.0–109.9%. The proposed sensor is simple, cheap, equipment-free, rapid and environmentally friendly. In addition, the colorimetric sensor Fe3+/(TBABr/SDS)3/PAD has potential applicability for TAC detection in real food samples.
1. Introduction
Antioxidants are found in many foods and have a significant role in human health due to their ability to prevent several diseases such as cancer, aging, cardiovascular diseases and Parkinson's, Alzheimer's and other diseases.1–4 The level of antioxidants or total antioxidant capacity (TAC) is determined in terms of gallic acid equivalents. Gallic acid (3,4,5-trihydroxybenzoic acid, GA)5 is a naturally occurring plant phenol with strong antioxidant activity. GA is used in processed food, cosmetics and food packing materials to prevent rancidity induced by lipid peroxidation and spoilage. In addition, GA is generally employed as a reference standard for the detection of TAC. Current methods for TAC quantification are based on the measurement of free radicals, such as DPPH (2,2-diphenyl-1-picrylhydrazyl) or ABTS (2,2′-azino-bis(3-ethylbenzothiazoline-6-sulfonic acid)), in solution.6,7 Assays, including DPPH and ABTS, mainly depend on the quenching of radicals by antioxidants. Several analytical techniques, such as spectrophotometry8,9 and electrochemical methods,10–12 have been developed to determine residual free radicals. However, these methods are time-consuming, laborious and expensive. Therefore, it is necessary to develop a simple, inexpensive, sensitive and rapid detection method for the analysis of TAC without the requirement for instruments.Paper-based sensors have attracted interest as testing tools for the determination of analytes due to the following reasons: first, they are portable and easy to use, require low sample volume, and enable rapid analysis;13–17 second, cellulose fiber is the main component of paper, which is compatible with biological systems; and third, the white paper is efficient for colorimetric detection, which allows detection via a change in color. For these reasons, paper-based sensors have potential for application in several fields including environmental monitoring and clinical research; patterned paper with hydrophobic and hydrophilic barriers has been fabricated using a variety of different techniques; some methods involve physical processes such as inkjet printing,18 wax printing,19–21 wax screen printing,22 and wax dipping;23 others involve chemical processes such as photolithography19,24–28 and plasma etching.29 A spraying method with lacquer, which is a new technique, has been developed to fabricate paper sensors. Acrylic lacquer, which is made of acrylic resin, is sprayed on the filter paper to create a hydrophobic area, whereas the hydrophilic area is protected with an iron mask.30 The acrylic resin has some advantages such as water resistance, good adhesion and fast drying.31 Therefore, this method is simple, rapid and low cost for the production of patterned paper-based sensors.
Layer-by-layer (LbL) self-assembly provides a simple, environmentally friendly and potentially economical approach, and it is a good technique to fabricate thin skin layers on substrates.32–34 The LbL self-assembly is simply based on the alternate dipping of a charged substrate into cationic and anionic solutions35–37 such as anionic and cationic conducting polymers.38–40 The electrostatic attraction existing between oppositely charged molecules in every monolayer is the driving force for the formation of layers and thus creation of an increasing coating thickness;41 although the fabrication of LbL assemblies has been reported,38–42 there is no study on the fabrication of self-assembled multilayers via this LbL technique using cationic and anionic surfactants on a paper sensor (LbL/PAD).
Herein, a new colorimetric paper sensor ((TBABr/SDS)3/PAD) based on the layer-by-layer assembled multilayers of a cationic surfactant, tetrabutylammonium bromide (TBABr), and an anionic surfactant, sodium dodecyl sulfate (SDS), modified on filter paper was fabricated for the selective and sensitive determination of TAC, which was expressed in term of gallic acid equivalents. The Fe3+ ions were loaded onto the (TBABr/SDS)3/PADs to obtain Fe3+/(TBABr/SDS)3/PAD; the measurement was based on the change in color resulting from the reaction of Fe3+ and gallic acid. The applicability of the colorimetric paper sensor Fe3+/(TBABr/SDS)3/PAD was also verified by the detection of TAC in three kinds of green tea and vegetable samples.
2. Experimental
2.1 Materials and chemicals
Whatman no. 42 (2.5 μm porosity), no. 1 (11 μm porosity) and no. 4 (20–25 μm porosity) filter papers were purchased from Cole-Parmer (Vernon Hills, IL). A polyimide tape was purchased from a company (Thailand). Leyland® spray lacquer, TOA spray lacquer and Win acrylic lacquer manufactured by Nakoya Paint (Thailand) were purchased from a local shop in Khon Kaen province. Tetrabutylammonium bromide (TBABr, C16H36BrN), tetradecyltrimethylammonium bromide (TTAB, C17H38BrN), cetyltrimethylammonium bromide (CTAB, C19H42BrN), sodium dodecyl sulfate (SDS, C12H25SO4Na) and sodium dodecyl benzene sulfonate (SDBS, C18H29NaO3S) were purchased from Fluka (Denmark). Deionized water (18.2 MΩ) produced by RiOs™ Type I Simplicity 185 (Millipore water, USA) was used in all experiments. Gallic acid (C7H6O5) was purchased from Fluka (Spain).A stock solution of Fe(III) ions (1000 mg L−1) was prepared by dissolving 0.3506 g of FeCl3 in 0.01 mol L−1 sulfuric acid and diluting to the mark in a 50 mL volumetric flask.
2.2 Apparatus
The absorbance and spectral measurements were performed using a UV-vis spectrophotometer (Agilent 8453) with a 1 cm quartz cell. The HPLC system (Waters, Massachusetts, USA) consisted of an in-line degasser, a 600E quaternary pump, and a Waters 2996 photodiode array detector (PDA). Separation was performed using the Waters Atlantis T3 column (150 mm × 4.6 mm i.d., 5 mm) at room temperature. Chromatographic analysis was carried out using methanol![[thin space (1/6-em)]](https://www.rsc.org/images/entities/char_2009.gif) :
:![[thin space (1/6-em)]](https://www.rsc.org/images/entities/char_2009.gif) water (60
water (60![[thin space (1/6-em)]](https://www.rsc.org/images/entities/char_2009.gif) :
:![[thin space (1/6-em)]](https://www.rsc.org/images/entities/char_2009.gif) 40%, v/v) as the mobile phase. The flow rate was 1.0 mL min−1, and the eluate was monitored via UV detection at 254 nm. The morphology was studied by focused ion beam scanning electron microscopy (FIBSEM) (Helios NanoLab G3 CX, FEI, USA) and light microscopy (Olympus BX51 microscope, 100× objective lens, USA). A smartphone with primary 8 megapixels was used to obtain an image of the colorimetric paper sensor.
40%, v/v) as the mobile phase. The flow rate was 1.0 mL min−1, and the eluate was monitored via UV detection at 254 nm. The morphology was studied by focused ion beam scanning electron microscopy (FIBSEM) (Helios NanoLab G3 CX, FEI, USA) and light microscopy (Olympus BX51 microscope, 100× objective lens, USA). A smartphone with primary 8 megapixels was used to obtain an image of the colorimetric paper sensor.
2.3 Patterning of the paper sensor using the lacquer spraying method
The lacquer spraying method was used to fabricate patterns on the filter paper No. 4 (20–25 μm porosity), as shown in Fig. S1.† The polyimide tape was used to produce a cover pattern on the paper (Fig. S1a†). Hydrophobic and hydrophilic areas were generated by the lacquer spraying method. To fabricate the filter paper sensor (Fig. S1b†), the polyimide tapes with the diameter of 15 mm were placed on the paper, and then, a hydrophobic barrier under the polyimide tape was created by the spraying method. The number of spraying rounds (n) was 10 on the front of the paper and fixed as n = 5 for the back of the paper. After this, the paper was air dried. Finally, the morphologies of the hydrophobic and hydrophilic areas of the pattern on the paper were characterized using scanning electron microscopy (SEM).2.4 Metal selection
The colorimetric reaction between GA and Cu(II), Fe(III), Zn(II), Ni(II), Co(II), Cd(II) and Mn(II) were tested. This was conducted by mixing 3.0 mM GA with 5.0 mL of an aqueous solution containing 2.0 mM metal ions. The formation of the complex was tested in both acidic and neutral solutions; when color change occurred, the absorbance was determined at maximum wavelength using a UV-Vis spectrophotometer.2.5 Layer-by-layer assembly on paper
The deposition of oppositely charged molecules on the filter paper is the principle of the layer-by-layer technique. The paper was dipped in a 0.1 M NaOH solution for 3 min and then dipped into the solution of the cationic surfactant tetrabutylammonium bromide (TBABr) for 5 min. A thin layer of the positively charged molecules was adsorbed on the surface. To remove the unbound molecules from the surface, the paper was then dipped into distilled water for 5 min. The paper was alternately dipped into the solution of the anionic surfactant sodium dodecyl sulfate (SDS) for further 5 min; subsequently, it was washed again using water to remove unbound molecules. A multilayer coating was created by repeating this procedure. Bilayers consisted of negatively and positively charged layers, and the number of bilayers was provided by the subscript, e.g. (TBABr/SDS)3 meant 3 bilayers of TBABr and SDS were coated on the paper.2.6 TAC assay using the paper sensor
The fabricated (TBABr/SDS)3/PAD was loaded with the Fe3+ ions to produce Fe3+/(TBABr/SDS)3/PAD. The Fe3+/(TBABr/SDS)3/PAD was air-dried, and yellow color paper was obtained; after this, 25 μL of GA (6.5 mM) was added to Fe3+/(TBABr/SDS)3/PAD, and the yellow paper sensor changed immediately to purple. This color remained stable for 15 min (Fig. 1); the quantitative data was produced by taking an image and applying a suitable program such as the ImageJ software based on the color change. To evaluate the color using the ImageJ software, the images of the color change on the paper sensor were first obtained using a smartphone under light controlled conditions in the home-made white box (ESI in Fig. S2†).2.7 Determination of TAC in real samples
Different brands of dried green tea were purchased from a supermarket. Fresh ginger, radish and onion were obtained from a local Thai supermarket in Khon Kaen province. Dried green tea (2.5 g) or 10.0 g of fresh samples were accurately weighed and soaked in 50.00 mL of hot water under stirring. Then, the sample was cooled down to room temperature. The supernatant was filtered through a 0.45 μm membrane, and 25.00 mL of supernatant was diluted to 50.00 mL before the determination of TAC by the proposed (TBABr/SDS)3/PAD sensor.3. Results and discussion
3.1 Complexation of GA and metal ions
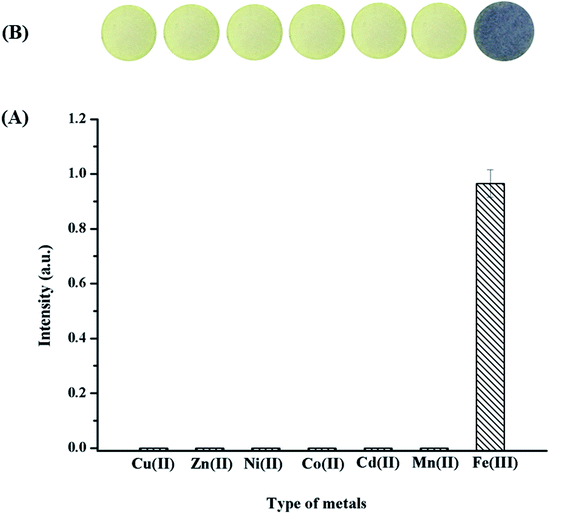
Suitable metal ions were studied for their ability to form a complex with GA in a neutral solution by UV-vis spectrophotometry, and a smartphone combined with the ImageJ software was used to obtain images. Several possible metal ions, including Cu2+, Fe3+, Zn2+, Ni2+, Co2+, Cd2+ and Mn2+, were tested. Among all metal ions tested herein, only Fe3+ formed a stable complex with GA because of its high stability constant,43 and the corresponding complex showed highest intensity, as shown in Fig. 2A. To confirm the selectivity of the system using the paper sensor, blank and individual solutions were tested at neutral pH (pH ∼ 7) to prove that the color was changed because of the reaction between the metal ions and GA. The images of our sensors with the loading of different metal ions and the addition of GA were obtained and are shown in Fig. 2B. Only Fe3+ presented a strong interaction with GA, which resulted in a purple color. Therefore, it can be concluded that the proposed system is highly selective to the complexation of Fe3+ and GA at neutral pH (pH ∼ 7).3.2 Fabrication of the paper sensor based on filter paper type
Several lacquer types were studied including paint lacquer and glossy spray lacquer. In the case of paint lacquer, it was found that the diffusion of lacquer under the polyimide tape could not be controlled. When glossy spray lacquer was used, a barrier between the hydrophobic and hydrophilic areas on the paper could be created and clearly observed. Therefore, the glossy spray lacquer was chosen to fabricate the paper sensor.After this, the filter paper types with different particle sizes (μm) were investigated to determine which filter paper provided the best particle retention efficiency. The Whatman filter paper no. 42 (2.5 μm porosity), no. 1 (11 μm porosity) and no. 4 (20–25 μm porosity) were investigated (Fig. S3†). The results indicate that the Whatman filter paper no. 4 provides the best results when compared with the other filter papers because it has larger porosity that enables the easy and rapid infiltration of the lacquer into the fiber of the filter paper. Thus, the Whatman filter paper no. 4 was selected to fabricate the paper sensor.
3.3 Electrostatic layer-by-layer assembly of surfactants
The effect of surfactant types was studied on the layer-by-layer assembly on the paper using cationic surfactants, such as tetrabutylammonium bromide (TBABr), tetradecyltrimethyl ammonium bromide (TTAB) and cetyltrimethylammonium bromide (CTAB), and anionic surfactants such as sodium dodecyl sulfate (SDS) and sodium dodecyl benzene sulfonate (SDBS). The layers of each pair were created by conducting the dipping method for 5 min for each step without drying. SDS and TBABr provided highest intensity, as shown in Fig. 3A.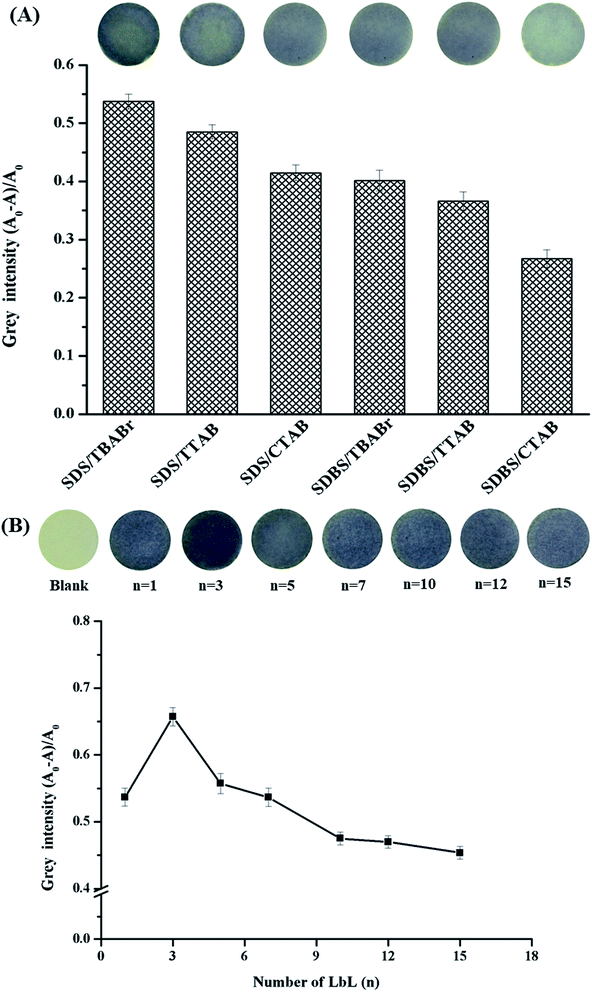 | ||
| Fig. 3 (A) The effect of the surfactant types on the modification of paper. (B) The effect of the layer-by-layer number on the modification of paper. | ||
The layers of TBABr and SDS were applied on the paper using a range of different bilayers (numbered from n = 1 to n = 15, where n shows the number of bilayers used, e.g. n = 3 indicates 3 full bilayers); thus, a series of (TBABr/SDS)n were obtained on the paper. As shown in Fig. 3B, the gray intensity of (TBABr/SDS)n on the paper reached a maximum value at n = 3, and then, the purple color on the paper sensor slightly faded due to the thickness of the bilayers of surfactants. Therefore, (TBABr/SDS)3 on paper was chosen for further study.
3.4 Characterization of the modified paper
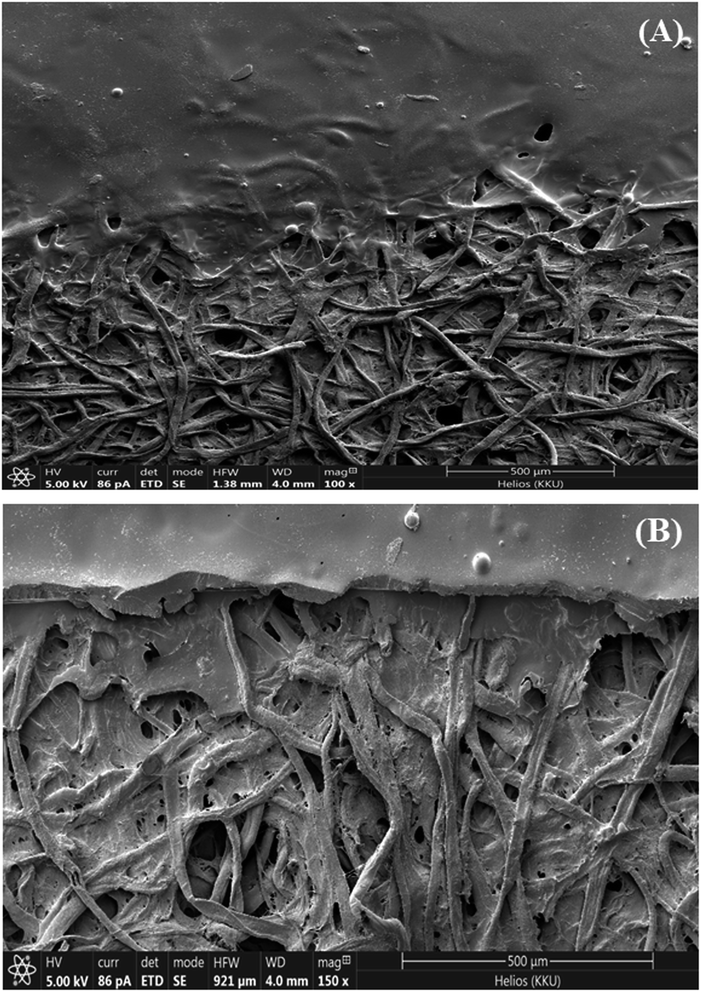
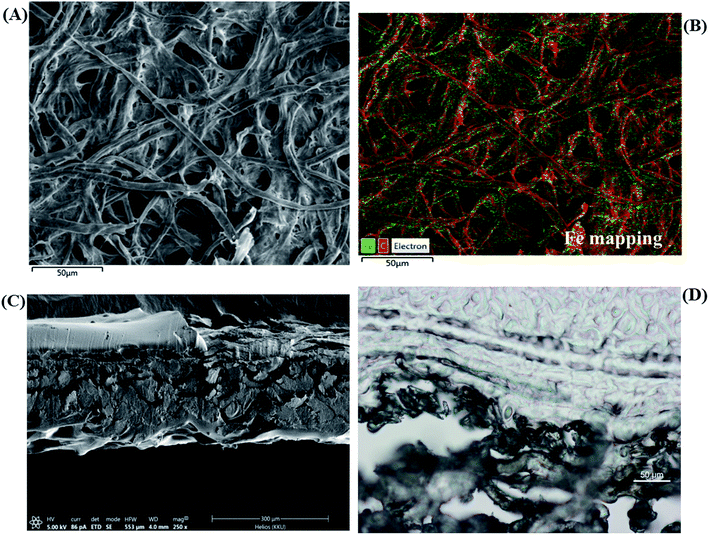
The morphologies of the modified paper were characterized by SEM and light microscopy. The cellulose paper showed cross-linked microfibers (Fig. 4A). The image in Fig. 4B reveals a smooth tubular morphology covered with a multilayer of surfactants on the paper (TBABr/SDS)3 by electrostatic interactions.In addition, SEM-EDX was used to analyze the elemental profiles of Fe3+/(TBABr/SDS)3/PAD (Fig. 5A). Element mapping was carried out to show the spatial distributions of the elements on the paper. Fig. 5B shows a comprehensive image of the element mapping of Fe overlapped with the corresponding SEM image of Fe shown in green color. Fig. 5C and D show the cross section and light microscopy image, respectively, of Fe3+/(TBABr/SDS)3/PAD, indicating that the three bilayers of surfactants and Fe3+ ions were inserted into the modified paper as (TBABr/SDS)3/PAD.
3.5 Selection of metal concentration
The concentration of Fe3+ loaded on (TBABr/SDS)3/PAD at which Fe3+ could best bind to GA based on the color change was studied. Fe3+ ions at different concentrations in the range from 5 mM to 40 mM were tested for this purpose. The loading of Fe3+ ions onto (TBABr/SDS)3/PAD was conducted with 3 mM GA and without GA. It was found that the grey intensity increased significantly with an increase in the concentration of Fe3+ ion on the paper from 5 mM to 25 mM; after this, the grey intensity became steady, as shown in Fig. 6. At 25 mM Fe3+, the purple color of Fe3+/(TBABr/SDS)3/PAD with the GA solution provided highest grey intensity.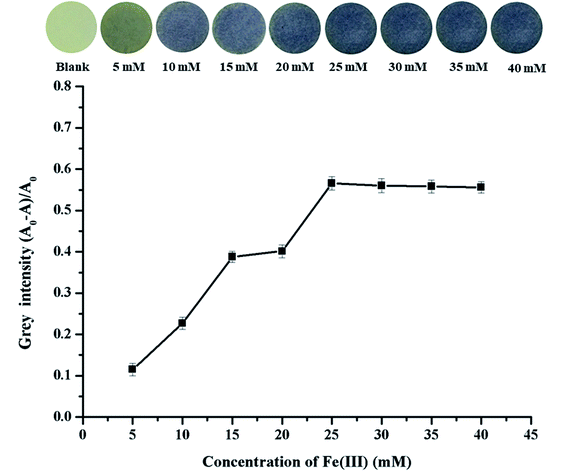 | ||
| Fig. 6 The effect of Fe3+ concentrations on the fabrication of (TBABr/SDS)3/PAD. Inset, the photographic images of Fe3+ loaded with different concentrations of (TBABr/SDS)3/PAD. | ||
3.6 Analytical features of Fe3+/(TBABr/SDS)3/PAD
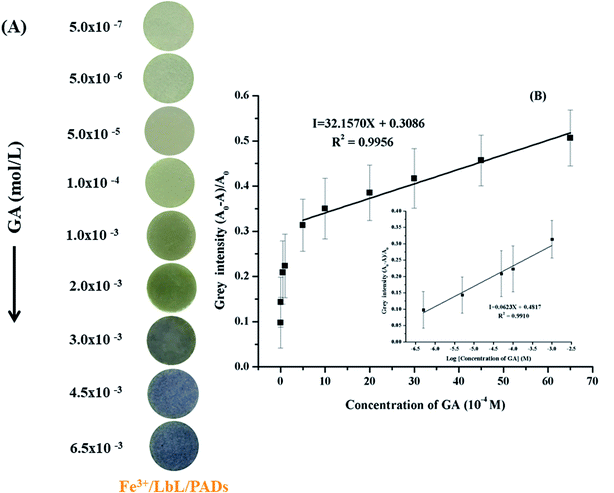
Under the optimal conditions, the sensitivity of the colorimetric sensor (Fe3+/(TBABr/SDS)3/PAD) was evaluated for the detection of GA. An image of this sensor with various concentrations of GA is shown in Fig. 7. The results showed that the colorimetric sensor gradually changed from grey to purple with an increase in the GA concentration from 0.50 μM to 6.50 mM (Fig. 7A). Linear relationships were obtained between the grey intensity and GA concentration in the ranges from 0.50 μM to 0.50 mM (I = 0.0623X + 0.4817) and 0.50 mM to 6.50 mM (I = 32.1570X + 0.3086) with the correlation coefficients of 0.9910 and 0.9956, respectively, where I is the grey intensity (Fig. 7B). The limit of detection (LOD) was 0.35 μM (calculated using the 3σs/S criteria, where σs is the standard deviation of the intensity in a blank solution (n = 11) and S is the slope of the linear calibration curve). The results showed that the proposed colorimetric sensor could be effectively used for the detection of GA.The accuracy of the proposed colorimetric method was compared with that of an HPLC method (data not shown) using the Student's t-test performed at a 95% confidence level. The calculated t was lower than the tabulated value (t-table) at a 95% confidence limit. This means that there is no significant difference between the accuracies of the proposed colorimetric sensor and HPLC.
3.7 The interferences and reproducibility of the colorimetric sensor
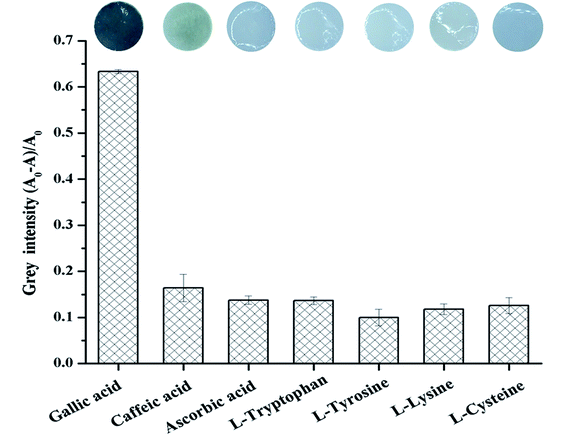
To evaluate the selectivity of the proposed colorimetric sensor Fe3+/(TBABr/SDS)3/PAD for the detection of GA, the interferences from several compound species, including caffeic acid, ascorbic acid, L-tryptophan, L-tyrosine, L-lysine and L-cysteine, that probably coexisted with GA in real samples were tested under the optimal conditions (Table S1†). Fig. 8 displays the images of Fe3+/(TBABr/SDS)3/PADs in the presence of various phenolic compounds (6.50 mM each). GA was the highly selective analyte among them, which led to a distinct color change from yellow to purple, which was further quantified by plotting the grey intensity in the sensing system; obviously, the colorimetric sensor Fe3+/(TBABr/SDS)3/PAD with GA showed about 4-fold higher intensity than that achieved in the case of other interferences. Therefore, the selectivity of Fe3+/(TBABr/SDS)3/PADs for the detection of GA could be suitable for the determination of GA in real samples.The reproducibility of the colorimetric sensor was studied by measuring the intra-day and inter-day precisions. The detection of 6.50 mM of GA with five independently fabricated papers (inter-day) provided the RSD of 5.52%. A series of five paper sensors prepared from the same batch were used to evaluate the intra-day precision at the same concentration, which provided the RSD of 5.58%. Therefore, the results demonstrated acceptable precision.
3.8 Analysis of samples
To confirm the practical application of the colorimetric sensor, Fe3+/(TBABr/SDS)3/PAD was used for the detection of TAC in three kinds of green tea, ginger, onion and radish samples. The TAC values were found to be in the range of 0.0095–0.4184 mg gallic acid/g of sample by the proposed colorimetric sensor (Table 1).| Sample | TAC value (mg gallic acid/g of sample) |
|---|---|
| Proposed colorimetric sensor | |
| Green tea I | 0.3504 ± 0.0022 |
| Green tea II | 0.3812 ± 0.0037 |
| Green tea III | 0.4184 ± 0.0015 |
| Ginger | 0.0476 ± 0.0056 |
| Radish | 0.0935 ± 0.0028 |
| Onion | 0.0095 ± 0.0054 |
In addition, the accuracy of the method was assessed via the recovery by spiking GA at three concentrations (1, 2 and 3 mM) into the samples before determination by the proposed method, and the results are shown in Table 2. The results show acceptable recovery, which indicates the potential application of the proposed sensor for the detection of GA in real samples.
| Samples | Proposed colorimetric sensor | HPLC method | |||||
|---|---|---|---|---|---|---|---|
| Spiked (mM) | Founda (mM) | Recoveryb (%) | % RSDc | Founda (mM) | Recoveryb (%) | % RSDc | |
| a The found spiked amount.b Recovery = Found/spiked × 100.c n = 3. | |||||||
| Tea sample I | 1 | 1.155 | 105.20 | 1.8 | 0.987 | 87.00 | 1.5 |
| 2 | 2.198 | 104.75 | 3.8 | 1.975 | 92.90 | 2.0 | |
| 3 | 3.132 | 100.96 | 1.7 | 2.876 | 91.97 | 1.8 | |
| Tea sample II | 1 | 1.074 | 96.20 | 2.4 | 1.181 | 96.77 | 1.6 |
| 2 | 2.133 | 101.05 | 1.0 | 2.165 | 97.60 | 1.8 | |
| 3 | 3.086 | 99.13 | 2.0 | 2.868 | 88.50 | 2.0 | |
| Tea sample III | 1 | 1.155 | 103.20 | 2.5 | 1.197 | 88.70 | 1.5 |
| 2 | 2.06 | 96.85 | 3.0 | 2.175 | 93.25 | 1.4 | |
| 3 | 3.137 | 100.46 | 4.7 | 3.207 | 96.57 | 1.9 | |
| Ginger | 1 | 0.916 | 86.00 | 2.0 | 1.049 | 87.80 | 1.8 |
| 2 | 2.161 | 105.25 | 1.5 | 1.938 | 88.25 | 4.0 | |
| 3 | 3.158 | 103.40 | 1.1 | 2.888 | 90.50 | 4.0 | |
| Radish | 1 | 1.209 | 109.90 | 2.3 | 1.192 | 98.20 | 1.7 |
| 2 | 2.198 | 104.40 | 3.1 | 2.232 | 101.10 | 2.0 | |
| 3 | 3.325 | 107.16 | 1.6 | 3.088 | 95.92 | 1.6 | |
| Onion | 1 | 1.019 | 101.90 | 3.4 | 0.937 | 93.70 | 4.5 |
| 2 | 2.119 | 105.95 | 4.7 | 1.966 | 98.30 | 4.1 | |
| 3 | 3.012 | 100.40 | 2.7 | 2.887 | 96.23 | 3.8 | |
4. Conclusions
Herein, a simple, highly selective and sensitive colorimetric sensor based on Fe3+/(TBABr/SDS)3/PAD was developed for the determination of total antioxidant capacity (TAC), which was expressed in terms of gallic acid equivalents (GA). GA detection was based on the formation of a highly stable complex between Fe3+ and GA, resulting in a color change from yellow to purple. Capturing the images of the paper sensor with a smartphone and extracting the color with the ImageJ software provided a quantitative approach. The LOD for GA was 0.35 μM based on the calculation of the 3σs/S, which was clearly lower than the reported GA value in food. The Fe3+/(TBABr/SDS)3/PAD sensor was applied to detect TAC in three kinds of green tea and vegetable samples with low interferences and showed satisfactory results, in good agreement with those obtained by the standard method (HPLC). Finally, the proposed colorimetric sensor Fe3+/(TBABr/SDS)3/PAD has potential applicability for TAC detection in real food samples.Conflicts of interest
There are no conflicts to declare.Acknowledgements
The authors gratefully acknowledge the financial support provided by the Research Fund for DPST Graduate with First Placement (Grant no. 015/2559), the Institute for the Promotion of Teaching Science and Technology (IPST), the Center of Excellence for Innovation in Chemistry (PERCH-CIC), Ministry of Higher Education, Science, Research and Innovation and Research and Academic Affairs Promotion Fund (RAAPF), Faculty of Science, Khon Kaen University, Fiscal year 2019, Thailand. Asst. Prof. Dr Pornpimol Jearranaiprepame (Department of Biology, Faculty of Science, Khon Kaen University, Thailand) and Dr Anan Kenthao are acknowledged for light microscopy measurements.References
- O. Yesil-Celiktas, C. Sevimli, E. Bedir and F. Vardar-Sukan, Plant Foods Hum. Nutr., 2010, 65, 158–163 CrossRef CAS.
- M. Oroian and I. Escriche, Food Res. Int., 2015, 74, 10–36 CrossRef CAS.
- S. Wang, J. P. Melnyk, R. Tsao and M. F. Marcone, Food Res. Int., 2011, 44, 14–22 CrossRef CAS.
- P. C. Wootton-Beard and L. Ryan, Food Res. Int., 2011, 44, 3135–3148 CrossRef.
- S. Pardeshi, R. Dhodapkar and A. Kumar, Food Chem., 2014, 146, 385–393 CrossRef CAS.
- K. Veenuttranon and L. T. Nguyen, Talanta, 2018, 186, 286–292 CrossRef CAS.
- S. Teerasong, A. Jinnarak, S. Chaneam, P. Wilairat and D. Nacapricha, Talanta, 2017, 170, 193–198 CrossRef CAS.
- M. F. Barroso, M. J. Ramalhosa, R. C. Alves, A. Dias, C. M. D. Soares, M. T. Oliva-Teles and C. Delerue-Matos, Food Control, 2016, 68, 153–161 CrossRef CAS.
- J. Chen, H. Lindmark-Månsson, L. Gorton and B. Åkesson, Int. Dairy J., 2003, 13, 927–935 CrossRef CAS.
- G. K. F. Oliveira, T. F. Tormin, R. M. F. Sousa, A. de Oliveira, S. A. L. de Morais, E. M. Richter and R. A. Munoz, Food Chem., 2016, 192, 691–697 CrossRef CAS.
- S. Milardović, D. Iveković and B. S. Grabarić, Bioelectrochemistry, 2006, 68, 175–180 CrossRef.
- J. Hoyos-Arbeláez, M. Vázquez and J. Contreras-Calderón, Food Chem., 2017, 221, 1371–1381 CrossRef.
- F. S. Rodrigues Ribeiro Teles, L. A. Pires de Távora Tavira and L. J. Pina da Fonseca, Crit. Rev. Clin. Lab. Sci., 2010, 47, 139–169 CrossRef.
- S. Haeberle and R. Zengerle, Lab Chip, 2007, 7, 1094–1110 RSC.
- P. Yager, T. Edwards, E. Fu, K. Helton, K. Nelson, M. R. Tam and B. H. Weigl, Nature, 2006, 442, 412–418 CrossRef CAS.
- D. M. Cate, W. Dungchai, J. C. Cunningham, J. Volckens and C. S. Henry, Lab Chip, 2013, 13, 2397–2404 RSC.
- C. Parolo and A. Merkoçi, Chem. Soc. Rev., 2013, 42, 450–457 RSC.
- K. Abe, K. Suzuki and D. Citterio, Anal. Chem., 2008, 80, 6928–6934 CrossRef CAS.
- E. Carrilho, A. W. Martinez and G. M. Whitesides, Anal. Chem., 2009, 81, 7091–7095 CrossRef CAS.
- L. Y. Shiroma, M. Santhiago, A. L. Gobbi and L. T. Kubota, Anal. Chim. Acta, 2012, 725, 44–50 CrossRef CAS.
- M. Santhiago and L. T. Kubota, Sens. Actuators, B, 2013, 177, 224–230 CrossRef CAS.
- W. Dungchai, O. Chailapakul and C. S. Henry, Analyst, 2011, 136, 77–82 RSC.
- T. Songjaroen, W. Dungchai, O. Chailapakul and W. Laiwattanapaisal, Talanta, 2011, 85, 2587–2593 CrossRef CAS.
- A. W. Martinez, S. T. Phillips, M. J. Butte and G. M. Whitesides, Angew. Chem., Int. Ed., 2007, 46, 1318–1320 CrossRef CAS PubMed.
- A. W. Martinez, S. T. Phillips, E. Carrilho, S. W. Thomas, H. Sindi and G. M. Whitesides, Anal. Chem., 2008, 80, 3699–3707 CrossRef CAS.
- W. Dungchai, O. Chailapakul and C. S. Henry, Anal. Chem., 2009, 81, 5821–5826 CrossRef CAS.
- Z. Nie, C. A. Nijhuis, J. Gong, X. Chen, A. Kumachev, A. W. Martinez, M. Narovlyansky and G. M. Whitesides, et al., Lab Chip, 2010, 10, 477–483 RSC.
- R. F. Carvalhal, M. Simão Kfouri, M. H. de Oliveira Piazetta, A. L. Gobbi and L. T. Kubota, Anal. Chem., 2010, 82, 1162–1165 CrossRef CAS.
- X. Li, J. Tian, T. Nguyen and W. Shen, Anal. Chem., 2008, 80, 9131–9134 CrossRef CAS.
- T. Nurak, N. Praphairaksit and O. Chailapakul, Talanta, 2013, 114, 291–296 CrossRef CAS.
- R. Lu, T. Honda, T. Ishimura and T. Miyakoshi, Polym. J., 2005, 37, 309–315 CrossRef CAS.
- Y.-Y. Li, T. Nomura, A. Sakoda and M. Suzuki, J. Membr. Sci., 2002, 197, 23–35 CrossRef CAS.
- R. Du, A. Chakma and X. Feng, J. Membr. Sci., 2007, 290, 19–28 CrossRef CAS.
- B. C. Bonekamp, R. Kreiterand J. F. Vente, Sol-gel approaches in the synthesis of membrane materials for nanofiltration and pervaporation, Springer, Netherlands, 2008 Search PubMed.
- O. Sanyal and I. Lee, J. Nanosci. Nanotechnol., 2014, 14, 2178–2189 CrossRef CAS.
- M. M. Barsan and C. M. A. Brett, Trac. Trends Anal. Chem., 2016, 79, 286–296 CrossRef CAS.
- Y. Huang, J. Sun, D. Wu and X. Feng, Sep. Purif. Technol., 2018, 207, 142–150 CrossRef CAS.
- K. R. Knowles, C. C. Hanson, A. L. Fogel, B. Warhol and D. A. Rider, ACS Appl. Mater. Interfaces, 2012, 4, 3575–3583 CrossRef CAS.
- N. Raoufi, F. Surre, T. Sun, M. Rajarajan and K. T. V. Grattan, Sens. Actuators, B, 2012, 169, 374–381 CrossRef CAS.
- S. Anandhakumar, P. Gokul and A. M. Raichur, Mater. Sci. Eng. C, 2016, 58, 622–628 CrossRef CAS.
- G. Decher, J. D. Hong and J. Schmitt, Thin Solid Films, 1992, 210–211, 831–835 CrossRef CAS.
- K. R. Knowles, C. C. Hanson, A. L. Fogel, B. Warhol and D. A. Rider, ACS Appl. Mater. Interfaces, 2012, 4, 3575–3583 CrossRef CAS.
- S. A. Rahim, S. Hussain and M. Farooqui, J. Chem. Biol. Phys. Sci., 2016, 777, 267–273 Search PubMed.
Footnote |
| † Electronic supplementary information (ESI) available. See DOI: 10.1039/c9ra05642d |
| This journal is © The Royal Society of Chemistry 2019 |

