 Open Access Article
Resource recovery of wastewater treatment sludge: synthesis of a magnetic cancrinite adsorbent†
Rui Biana,
Junna Zhuab,
Yu Chenc,
Yang Yud,
Suiyi Zhu *a,
Leilei Zhanga and
Mingxin Huoa
aSchool of Environment, Northeast Normal University, Changchun 130117, China. E-mail: papermanuscript@126.com; Tel: +86-0431-89165610
bHuiji No. 1 Middle School, Zhengzhou, 450000, China
cJilin Institute of Forestry Survey and Design, Changchun 130022, China
dGuangdong Shouhui Lantian Engineering and Technology Corporation, Guangzhou 510075, China
First published on 7th November 2019
Abstract
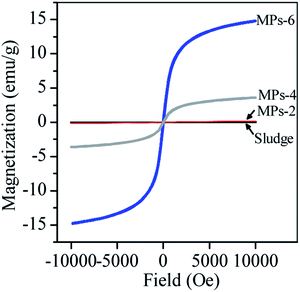
Water treatment sludge, which is mechanically dewatered and landfilled as solid waste, is considerably generated in water plants for potable water production. Herein, a novel route to hydrothermally convert this sludge into magnetic particles (MPs) is demonstrated. The sludge comprised amorphous aggregates with a relatively high Al/Si ratio of 3.7 and low Fe content of 8.5 wt%. After hydrothermal treatment, the Al/Si ratio of the MPs was approximated to 1, which was unaffected as the NaOH concentration increased from 2 M to 4 M or 6 M. The amorphous sludge was converted to MPs in the following order: spherical sodalite with a diameter of 3–5 μm, large spherical sodalite with a diameter of 5–10 μm and crystal dendritic cancrinite. Dendritic cancrinite was generated by recrystallisation of amorphous Al/Si oxides with spherical sodalite as the intermediate. With the addition of ascorbic acid, magnetisation of the weakly magnetised sludge increased from 0.11 emu g−1 to 3.6 emu g−1 and 14.8 emu/g by raising the NaOH concentration from 2 M to 4 M and 6 M. The magnetic property was related to the magnetite generated from the reduction of ferrihydrite and hematite in the sludge by the added ascorbic acid. Dendritic cancrinite exhibited an optimal surface site concentration of 0.31 mmol g−1 and desirable adsorption capacity of tetracycline (TC) (482.6 mg g−1), which were twice those of spherical sodalite prepared with 4 M NaOH. This study not only highlights the resource recovery of wastewater treatment sludge for MP preparation but also presents a new and effective adsorbent for treatment of TC-containing wastewater.
1. Introduction
Flocculation is widely used to remove suspended and colloidal solids in drinking water treatment plants, thus generating abundant water treatment sludge. Approximately 45–75 tons of sludge is produced per day in a drinking water treatment plant with a capacity of 225![[thin space (1/6-em)]](https://www.rsc.org/images/entities/char_2009.gif) 000 m3 d–1.1 The sludge is generally mechanically dewatered before landfilling for disposal,2 which costs approximately €41–130 per ton and occupies large land areas.3 In recent decades, many methods have been developed to recycle the sludge, such as preparing cement,2 incorporating into bricks and spreading on agricultural land,3 which dramatically reduced the disposal cost.4
000 m3 d–1.1 The sludge is generally mechanically dewatered before landfilling for disposal,2 which costs approximately €41–130 per ton and occupies large land areas.3 In recent decades, many methods have been developed to recycle the sludge, such as preparing cement,2 incorporating into bricks and spreading on agricultural land,3 which dramatically reduced the disposal cost.4
The sludge contains Fe, Si and Al and has numerous surface functional sites (e.g. ![[triple bond, length as m-dash]](https://www.rsc.org/images/entities/char_e002.gif) M–O−, where M represents Fe, Si and Al), rendering the sludge with the capability to adsorb various contaminants, such as phosphate,1 boron,5 fluoride6 and heavy metals.4 The sludge contains 14.9–54.8% of Si/Al compounds,3 which dissolve in alkali solutions with the generation of Si(OH)5− and Al(OH)4−, followed by recrystallisation in the form of high-purity zeolite materials under hydrothermal conditions.7 The extraction of Si/Al is improved by adding NaOH to the sludge in the fusion process;8 thus, prepared materials show high adsorption performance in comparison with raw sludge. After use, the prepared zeolite materials are separated from water through such methods as tedious centrifuging, complicated coagulation and filtration,3 which limit zeolite application in wastewater treatment. Alternatively, the Fe-containing compounds in sludge can be reductively dissolved by adding reductants (e.g. glycol,9 ascorbic acid10 and methane) and recrystallised in the form of magnetic species, such as maghemite and magnetite;11 these phenomena promote the good magnetic response and separation performance of the treated sludge from the water after use. The Fe-containing compounds of the sludge are positively charged and have abundant surface sites (
M–O−, where M represents Fe, Si and Al), rendering the sludge with the capability to adsorb various contaminants, such as phosphate,1 boron,5 fluoride6 and heavy metals.4 The sludge contains 14.9–54.8% of Si/Al compounds,3 which dissolve in alkali solutions with the generation of Si(OH)5− and Al(OH)4−, followed by recrystallisation in the form of high-purity zeolite materials under hydrothermal conditions.7 The extraction of Si/Al is improved by adding NaOH to the sludge in the fusion process;8 thus, prepared materials show high adsorption performance in comparison with raw sludge. After use, the prepared zeolite materials are separated from water through such methods as tedious centrifuging, complicated coagulation and filtration,3 which limit zeolite application in wastewater treatment. Alternatively, the Fe-containing compounds in sludge can be reductively dissolved by adding reductants (e.g. glycol,9 ascorbic acid10 and methane) and recrystallised in the form of magnetic species, such as maghemite and magnetite;11 these phenomena promote the good magnetic response and separation performance of the treated sludge from the water after use. The Fe-containing compounds of the sludge are positively charged and have abundant surface sites (![[triple bond, length as m-dash]](https://www.rsc.org/images/entities/char_e002.gif) Fe–O−) for Si/Al coordination.3 Thus, contact between a reductant and Fe-containing compounds is inhibited by Si/Al coordination, thereby blocking the transformation of Fe-containing compounds into magnetic species. Si/Al species on the surface of Fe-bearing compounds are dissolved under alkaline condition; consequently, the Fe-bearing compounds are reductively dissolved again with the generation of magnetic species.12
Fe–O−) for Si/Al coordination.3 Thus, contact between a reductant and Fe-containing compounds is inhibited by Si/Al coordination, thereby blocking the transformation of Fe-containing compounds into magnetic species. Si/Al species on the surface of Fe-bearing compounds are dissolved under alkaline condition; consequently, the Fe-bearing compounds are reductively dissolved again with the generation of magnetic species.12
In this study, a one-step hydrothermal method was applied to directly convert water treatment sludge into magnetic zeolite-like materials. Unlike zeolite prepared via the conventional two-step route, the sludge was directly transformed into magnetic sodalite and/or cancrinite particles. The prepared magnetic particles (MPs) were effective for tetracycline (TC) adsorption. This study is believed to be the first to convert water treatment sludge to magnetic zeolite directly.
2. Materials and methods
2.1 Sludge pre-treatment
Water treatment sludge was acquired at the bottom of a flocculant tank in a reclaimed water plant (Changchun, China) and dried at 105 °C overnight. The yellowish sludge was characterised by an X-ray fluorescence spectrograph (XRF, S4-Explorer, Bruker, Germany). The major elements in the sludge were Al (28.9 wt%), Si (8.2 wt%), Fe (8.5 wt%), Ca (2.4 wt%) and Ti (1.8 wt%).2.2 Synthesis of magnetic adsorbent
The sludge was converted to a magnetic adsorbent via a hydrothermal route. Typically, 1 g of the dried sludge was mixed with 30 mL of 2 M NaOH under constant stirring at 150 rpm for 10 min. A brownish suspension was generated, and then ascorbic acid was added to the mixture at an Fe/ascorbic acid molar ratio of 1. After stirring for 5 min, the suspension was transferred to a 50 mL Teflon kettle. The kettle was placed into an oven and autoclaved at 150 °C for 6 h and then cooled down to room temperature. The deposit at the bottom of the kettle was collected and dried at 105 °C for 5 h. The obtained particles were named MPs-2. The control experiments were performed using the abovementioned procedures. However, the NaOH concentration was changed from 2 M to 4 M or 6 M, and the obtained products were denoted as MPs-4 and MPs-6, respectively.2.3 Adsorption
The adsorption capacity of MPs-4 and MPs-6 was investigated by using TC as a target. Briefly, a stock of 200 mg L−1 TC−1 was prepared and adjusted to pH 5 by adding 5% HCl. A total of 50 mL conical flasks containing 0.02 g MPs and 20 mL stock solution were prepared and then shaken in a shaker (SHZ-98, Yihen, Shanghai) at 170 rpm at 25 °C. At a given interval, three flasks were taken out and placed beside a magnet to separate MPs from the supernatant. The TC concentration in the supernatant was determined by liquid chromatography (LC-16, Shimadzu, Japan) in accordance with the method of Liu et al.13Adsorption isotherm experiments were also conducted at pH 5 with a TC concentration ranging from 0 mg L−1 to 1000 mg L−1 and an equilibrium time of 1 h. All adsorption experiments were performed three times, and the reported data were averaged.
2.4 Characteristics of MPs
The X-ray diffraction (XRD) patterns of the sludge and MPs were determined by diffractometry (RAPID-S; Rigaku, Japan) using Cu-Kα radiation and a 2θ range of 10–70°. The morphologies of the sludge and the MPs were observed by field emission scanning electron microscopy (SEM) (S-4700, FEI Co., USA) with an accelerating voltage of 200 kV. The magnetic characterisation of the sludge and MPs was determined at room temperature using a superconducting quantum interference device magnetometer (SQUID-VSM, Quantum Design, USA). Transmission Mössbauer spectroscopy experiments were performed using an MP500 spectrometer (Oxford, Britain) at room temperature with α-Fe0 as a reference. The composition of the MPs was measured following the abovementioned method for the sludge. The surface electronic structure of the MPs before and after TC adsorption as analysed by X-ray photoelectron spectrometry (XPS, ADES-400, VG Scientific, Britain) with Mg-Kα X-ray source at a residual gas pressure below 10−8 Pa.The surface site concentration of the MPs was determined by a titration experiment following the method of Tang et al.14 Typically, 0.2 g MPs were suspended in 50 mL deionised water and then bubbled with N2 to remove dissolved O2 and CO2. The suspension was then titrated to approximately pH 3 with 0.2 M HNO3 and subsequently back-titrated to approximately pH 11 with 0.2 M NaOH. In the acidic titration process, free H+ was coordinated on the surface sites ![[triple bond, length as m-dash]](https://www.rsc.org/images/entities/char_e002.gif) M–O− of the MPs via reaction (1). In the alkaline titration process, NaOH firstly reacted with the free H+ and then with the coordinated H+ on the surface sites of the MPs via reaction (2), thus finally increasing the pH of the solution. Thus, the consumed volumes of HNO3 and NaOH were accurately recorded to calculate the Gran function value (shortened as G) with the Gran plot method via eqn (3) and (4).
M–O− of the MPs via reaction (1). In the alkaline titration process, NaOH firstly reacted with the free H+ and then with the coordinated H+ on the surface sites of the MPs via reaction (2), thus finally increasing the pH of the solution. Thus, the consumed volumes of HNO3 and NaOH were accurately recorded to calculate the Gran function value (shortened as G) with the Gran plot method via eqn (3) and (4).
H+ + ![[triple bond, length as m-dash]](https://www.rsc.org/images/entities/char_e002.gif) MO−Na+ ↔ Na+ + MO−Na+ ↔ Na+ + ![[triple bond, length as m-dash]](https://www.rsc.org/images/entities/char_e002.gif) MO−H+, MO−H+,
| (1) |
NaOH + ![[triple bond, length as m-dash]](https://www.rsc.org/images/entities/char_e002.gif) MO−H+ ↔ H2O + MO−H+ ↔ H2O + ![[triple bond, length as m-dash]](https://www.rsc.org/images/entities/char_e002.gif) MO−Na+, MO−Na+,
| (2) |
| At pH < 7, G = (50 + V1 + V2) × 10−pH, | (3) |
| At pH > 7, G = (50 + V1 + V2) × 10−(13.8−pH), | (4) |
The consumed NaOH volume for neutralisation of the coordinated H+ on the MP surface sites was measured from the titration demarcation point in the Gran plot. Therefore, the surface site concentration (Hs) of the MPs was calculated with eqn (5).
 | (5) |
3. Results and discussion
3.1 Transformation of aluminosilicate in sludge into sodalite and cancrinite
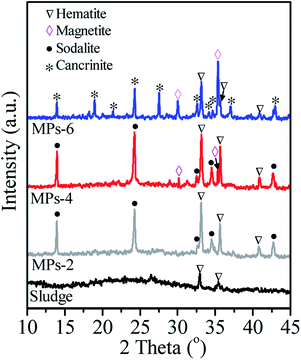
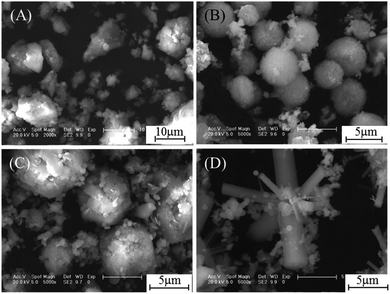
The sludge and the prepared MPs were characterised by XRD, as shown in Fig. 1. No aluminosilicate peak was observed in the sludge, suggesting that the aluminosilicate was amorphous. After hydrothermal treatment, MPs-2 showed strong peaks at 2θ = 13.9°, 24.3°, 34.5° and 42.7°, which corresponded to sodalite (JCPDS 76-1639). The sodalite peaks remained unchanged when the NaOH concentration increased from 2 M to 4 M and were absent at 6 M NaOH. Instead, new peaks were observed at 2θ = 19°, 21.4°, 27.5°, 34.2°, 34.6° and 37° in MPs-6, which were attributed to cancrinite (JCPDS 78-2494). These changes indicate that NaOH was a critical factor in the conversion of aluminosilicate in the sludge to different products. The sludge was transformed to sodalite with 2 or 4 M NaOH and further to cancrinite with overdosed 6 M NaOH.The morphologies of the sludge and MPs are shown in Fig. 2. The sludge comprised amorphous aggregates (Fig. 2(A)) and converted to spherical particles with a diameter of 3–5 μm (Fig. 2(B)) after hydrothermal treatment by adding 2 M NaOH. The formed spherical particles were affiliated to sodalite according to the XRD result (Fig. 1 MPs-2). As the NaOH concentration increased from 2 M to 4 M, the size of the spherical particles increased from 3–5 μm to 5–10 μm in diameter (Fig. 2(C)). When the NaOH concentration was further increased to 6 M, the spherical particles were not observed, and dendritic particles were instead generated in MPs-6 (Fig. 2(D)). The results were in agreement with the transformation of sodalite to cancrinite with the elevated NaOH concentrations from 4 M to 6 M (Fig. 1 MPs-4 and MPs-6).
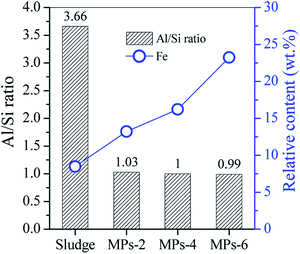
The compositions of the sludge and MPs are compared in Fig. 3. The Al/Si ratio was 3.66 for the sludge but reduced to 1.03 for MPs-2 and was constant for MPs-4 and MPs-6. The Al/Si ratios in the MPs were close to those in the crystal lattice of sodalite and cancrinite, indicating the generation of sodalite and cancrinite in the MPs. In the process, the Al/Si oxides in the sludge were hydrothermally dissolved with the release of Al(OH)4− and Si(OH)5− under alkaline conditions, in which the Al–O bond was more easily broken than the Si–O bond;15 thus, additional Al-containing species were released to the alkaline solution, resulting in a low Al/Si ratio in the MPs.
3.2 Formation mechanism of dendritic cancrinite particles
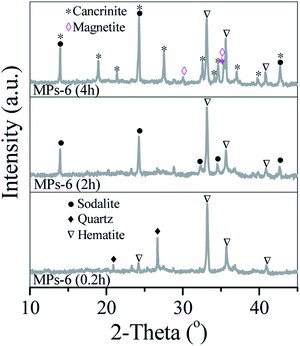
The time course of dendritic cancrinite generation was investigated. After hydrothermal treatment for 0.2 h, MPs-6 showed two peaks at 2θ = 20.9° and 26.7°, which belonged to the quartz (Fig. 4 MPs-6(0.2)) from the transformation of the weakly crystallised Si oxides in the sludge. As time extended from 0.2 h to 2 h, the quartz peaks disappeared and sodalite peaks were observed, indicating the involvement of dissolved quartz in sodalite formation. When the hydrothermal time was extended to 4 h, peaks of sodalite at 2θ = 13.9° and 24.3° and new peaks of cancrinite at 2θ = 19°, 21.4° and 27.5° were observed; these peaks demonstrated the generation of a mixture of sodalite and cancrinite in MPs-6. With the time extension from 4 h to 6 h, the sodalite peaks became small whilst the cancrinite peaks intensified, indicating the transformation of sodalite into cancrinite.The morphologies of MPs-6 were recorded with the time extension from 0.2 h to 4 h. MPs-6, which was prepared via hydrothermal treatment for 0.2 h, showed amorphous aggregates similar to those in the sludge (Fig. 5(A)). When the hydrothermal time was extended to 2 h, spherical particles with a diameter of 3–5 μm, which were consistent with those in the sodalite formation, were observed (Fig. 5(B)). When the hydrothermal time was further extended to 4 h, dendrite crystals grew on the surface of the spherical particles due to the formation of cancrinite. This growth indicates the involvement of dissolved sodalite in the formation of cancrinite. Therefore, the Al/Si species in the sludge was converted to dendritic cancrinite via the spherical sodalite as intermediate.
3.3 Magnetic property of the sludge and MPs
When ascorbic acid was introduced in MP synthesis, it reacted with the Fe oxides in the sludge via redox reaction, and the crystallinity of the Fe oxides was changed accordingly. However, ascorbic acid did not react with the Al/Si-containing species. Fe oxides of the sludge and MPs were respectively characterised by XRD and Mössbauer spectra. The sludge showed two small peaks at 2θ = 33.1° and 35.6°, which corresponded to hematite (JCPDS 33-0664). The weakly crystallised ferrihydrite of the sludge was identified by Mössbauer spectra (Fig. S1†) and approximated to 71.1 wt% of the Fe oxides in the sludge. This finding indicates that ferrihydrite predominated in Fe oxides in the sludge.In the hydrothermal process, NaOH concentration was important in the conversion of Fe oxides of the sludge into magnetic species. When NaOH was 2 M, hematite peaks were observed in MPs-2, which was generated from the phase transformation of ferrihydrite in the alkaline solution. With the increase in NaOH concentration from 2 M to 4 M, new peaks at 2θ = 30° and 35.4° were observed in MPs-4, which belonged to the inverse spinel structure of magnetite (JCPDS 19-0696). This phenomenon indicates that magnetite formation occurred at 4 M NaOH. When NaOH concentration was 6 M, the peaks of magnetite became sharp whilst those of hematite became small. This finding suggests that hematite was reductively dissolved by ascorbic acid and then recrystallised to generate magnetite. The formation of magnetite in MPs-6 changed with time. Sharp peaks of hematite were observed at the initial 2 h (Fig. 4 MPs-6 (0.2 h & 2 h)) but became small when the reactive time was extended to 4 h. Meanwhile, new peaks of magnetite appeared at 4 h (Fig. 4 MPs-6 (4 h)) and intensified at 6 h (Fig. 1 MPs-6). These results indicate that hematite is an intermediate product, which was finally converted to magnetite.
The sludge is a mixture of hematite, ferrihydrite and aluminosilicate. The in situ conversion of ferrihydrite to hematite occurred after hydrothermal treatment with 2 M NaOH. Simultaneously, aluminosilicate was dissolved with the generation of Al(OH)4− and Si(OH)5−, which increased Fe content of sludge from 8.5 wt% to 13.2 wt% of MPs-2 (Fig. 3). Although the aluminosilicate was dissolved with the addition of 2 M NaOH, the residual aluminosilicate on the surface sites (![[triple bond, length as m-dash]](https://www.rsc.org/images/entities/char_e002.gif) Fe–O−) of ferrihydrite and hematite inhibited the contact, followed by a redox reaction between ascorbic acid and Fe oxides. With the increase in NaOH concentration to 6 M, the Fe content in MPs-6 elevated to 23.2 wt%. This elevation indicates that additional aluminosilicate (probably from the Fe oxides surface) was dissolved into the solution. Therefore, the redox reaction between ascorbic acid and Fe oxides occurred with the generation of ferrous Fe. In the hydrothermal process, ascorbic acid also reacted with the dissolved oxygen with the generation of dehydroascorbic acid and H2O2.16 The generated H2O2 had oxidation capability to convert ferrous Fe into ferric Fe and oxidise dehydroascorbic acid to L-threonate and oxalate, with carbonate and H2O being the final products.10 With the generation of ferric Fe, the co-precipitation of ferrous Fe and ferric Fe was initiated to form magnetite Fe3O4.
Fe–O−) of ferrihydrite and hematite inhibited the contact, followed by a redox reaction between ascorbic acid and Fe oxides. With the increase in NaOH concentration to 6 M, the Fe content in MPs-6 elevated to 23.2 wt%. This elevation indicates that additional aluminosilicate (probably from the Fe oxides surface) was dissolved into the solution. Therefore, the redox reaction between ascorbic acid and Fe oxides occurred with the generation of ferrous Fe. In the hydrothermal process, ascorbic acid also reacted with the dissolved oxygen with the generation of dehydroascorbic acid and H2O2.16 The generated H2O2 had oxidation capability to convert ferrous Fe into ferric Fe and oxidise dehydroascorbic acid to L-threonate and oxalate, with carbonate and H2O being the final products.10 With the generation of ferric Fe, the co-precipitation of ferrous Fe and ferric Fe was initiated to form magnetite Fe3O4.
The magnetic behaviour of MPs was related to the magnetite formation. Fig. 6 shows that the sludge and MPs-2 were weakly magnetised due to the lack of magnetite. When magnetite was generated, the saturation magnetisation dramatically increased to 3.6 emu g−1 and 14.8 emu g−1 for MPs-4 and MPs-6, respectively. Thus, MPs-4 and MPs-6 responded well to magnetism.
3.4 Adsorption of TC
TC is a widely used antibiotic that is commonly detected in aquaculture and pharmacy wastewater;17 it was targeted in this work to investigate the adsorption performance of MPs-4 and MPs-6. The adsorption data of TC on MPs-4 and MPs-6 fitted well with the pseudo-second-order model (Fig. 7(A)) with correlation coefficients (R2) of 0.998 and 0.999 for MPs-4 and MPs-6, respectively (Table 1). This finding indicates the importance of TC chemisorption on MPs.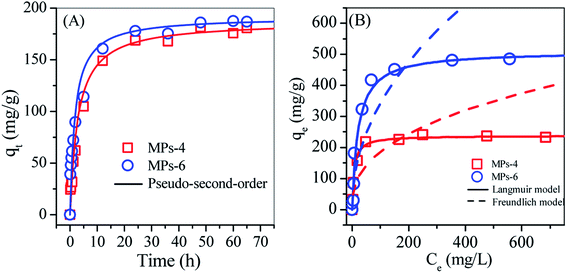 | ||
| Fig. 7 Non-linear plots of (A) the pseudo-first-order model and (B) the Langmuir and Freundlich models for the TC adsorption on MPs-4 and MPs-6. | ||
| Model | Parameters | MPs-4 | MPs-6 |
|---|---|---|---|
| a The mass of the adsorbent was 0.02 g, and the initial pH was 5. | |||
| Pseudo-second-order kinetic | R2 | 0.998 | 0.999 |
| k2 (×10−3 g mg−1 min−1) | 1.82 | 2.82 | |
| qt (mg g−1) | 187.2 | 191.6 | |
| Langmuir | R2 | 0.993 | 0.992 |
| qm (mg g−1) | 237.9 | 482.6 | |
| KL | 0.04 | 0.05 | |
| Freundlich | R2 | 0.78 | 0.82 |
| 1/n | 0.39 | 0.47 | |
| KF | 30.66 | 37.97 | |
The adsorption isotherms of TC on MPs-4 and MPs-6 were respectively analysed by non-linear Langmuir and Freundlich models (Fig. 7(B)), and the relative parameters are summarised in Table 1. The parameters showed a better fitting of the Langmuir model than the Freundlich model. This finding confirmed that MPs-4 and MPs-6 have energetically homogeneous surfaces for the adsorption of TC. The maximum adsorption capacity of MP-6 was 482.6 mg g−1, which was double that of MPs-4 and higher than those of other types of zeolites made from waste, such as NaY zeolite (201.8 mg g−1),18 zeolite–hydroxyapatite composite (186.1 mg g−1)19 and struvite-loaded zeolite (87.8 mg g−1).20
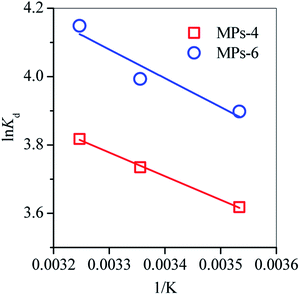
The effect of temperature on the adsorption performance of MPs-4 and MPs-6 was examined by fitting the data with the van't Hoff equation (eqn (6)).
 | (6) |
ΔH and ΔS were respectively calculated from the slope and intercept of the plots, as shown in Fig. 8. Thus, the free energy changes (ΔG, J mol−1) for the TC adsorption at different temperatures (K) were determined from the following equation:
| ΔG = ΔH − TΔS. | (7) |
Such thermodynamic parameters are summarised in Table 2. The positive ΔH indicated the endothermic nature of TC adsorption on MPs-4 and MPs-6, whereas the negative ΔG explained the spontaneity of the adsorption process. ΔG decreased as the temperature increased, demonstrating that the adsorption process preferred high temperatures (Fig. 8). MPs-6 showed a higher ΔS (57 J mol−1 K−1) than MPs-4; therefore, MPs-6 had a better affinity for adsorbing TC in comparison with MPs-4.
| Parameters | MPs-4 | MPs-6 | |
|---|---|---|---|
| ΔH (kJ mol−1) | 5.8 | 7 | |
| ΔS (J mol−1 K−1) | 50.4 | 57 | |
| ΔG (kJ mol−1) | 10 °C | −8.46 | −9.13 |
| 25 °C | −9.22 | −9.99 | |
| 35 °C | −9.72 | −10.56 | |
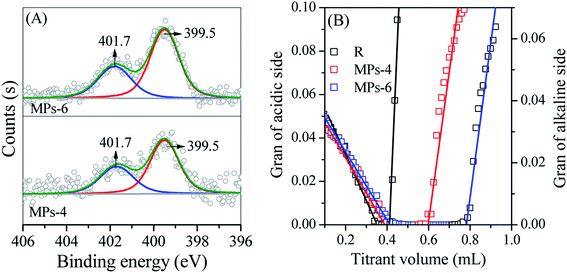
The adsorption mechanism of TC on MPs was further investigated by XPS and the Gran plot method, as shown in Fig. 9. The N 1s XPS spectra showed two peaks at binding energies of 399.5 and 401.7 eV (Fig. 9(A)); these peaks corresponded to the N atom in the –NH3+ group and the –NH– bond of TC, suggesting that TC was adsorbed on the MP surface. TC was in the form of an amphipathic molecule during adsorption, in which the –NH2 group on the side chain of TC reacted with free H+ in the solution to generate the –NH3+ group. Thus, the TC molecule was positively charged. When TC diffused to the surface of MPs, the Na+ on the surface sites was replaced by the positively charged TC molecule. This replacement resulted in TC adsorption onto the MPs and the release of Na+ in the solution. The surface sites of MPs played a key role in TC adsorption, which could be measured by examining the surface site concentration (Hs) using the Gran plot method (Fig. 9(B)). MPs-6 showed a higher Hs (0.31 mmol g−1) than that of MPs-4 (0.14 mmol g−1), indicating that MPs-6 had additional surface coordination sites in TC adsorption.
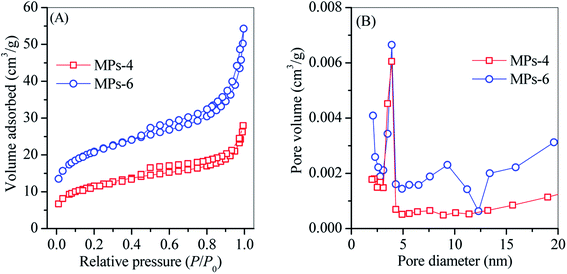
N2 adsorption–desorption isotherms and BJH pore size distribution curves of MPs-4 and MPs-6 are plotted in Fig. 10. The BET surface area and pore volume of MPs-6 were 73.9 m2 g−1 and 0.072 cm3 g−1, respectively, which were higher than those of MPs-4 (41.5 m2 g−1 and 0.039 cm3 g−1, respectively). This finding reveals that MPs-6 employed additional surface sites for TC adsorption in accordance with its high Hs. MPs-4 and MPs-6 further exhibited a mesoporous structure with an average pore size of 3–4 nm. This structure was attributed to the large pore size of the Al/Si crystals (e.g. sodalite and cancrinite) and the secondary aggregation of the magnetite. MPs-6 showed a smaller surface area than the reported NaY zeolite18 and zeolite–hydroxyapatite composite19 but exhibited a high TC adsorption capacity. This finding suggests that MPs-6 provided substantial contributions via cation exchange and surface coordination rather than pore-dependent physisorption.
3.5 Environmental application
MPs-6 was selected as the adsorbent for treating TC-containing wastewater because of its high Hs and superior magnetic response. The regeneration capability of MPs-6 was a key parameter for wastewater treatment and was investigated as shown in Fig. 11. MPs-6 with adsorption of TC was treated with 15% NaCl solution at pH 5 for 48 h or calcination at 450 °C for 2 h. MPs-6 was easily recycled and regenerated using NaCl solution as the desorption agent. The removal rate of TC was approximately 85% after six regeneration times (Fig. 11), indicating that MPs-6 has ideal adsorption performance and stability. However, the removal rate of the regenerated MPs-6 rapidly decreased after calcination at 450 °C (Fig. 11). This finding is possibly due to the occupied surface functional sites (![[triple bond, length as m-dash]](https://www.rsc.org/images/entities/char_e002.gif) M–O−) of MPs-6 by the calcinated TC product, destroying its mesopores under such a high calcination temperature.21 The good desorption performance in the NaCl solution was because of the competition between the excessive Na+ and the cationic TC molecules for the active adsorption sites on MPs-6, resulting in the desorption of TC from the MPs-6 surface. Accordingly, MPs-6 was regenerated.
M–O−) of MPs-6 by the calcinated TC product, destroying its mesopores under such a high calcination temperature.21 The good desorption performance in the NaCl solution was because of the competition between the excessive Na+ and the cationic TC molecules for the active adsorption sites on MPs-6, resulting in the desorption of TC from the MPs-6 surface. Accordingly, MPs-6 was regenerated.
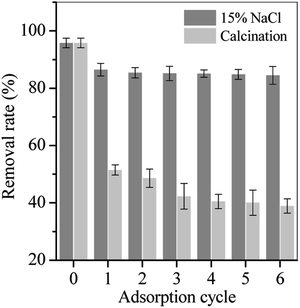 | ||
| Fig. 11 Adsorption capacity of MPs-6 regenerated with 15% NaCl solution and calcination at 450 °C for 2 h (adsorption condition: initial pH = 5, equilibrium time = 48 h and initial volume = 20 mL). | ||
The performance of MPs-6 in the treatment of real TC-containing wastewater was tested. TC-containing wastewater, which contained 6.2 mg L−1 TC−1, 11.2 mg L−1 oxytetracycline (OTC), 25.3 mg L−1 quinoline and 286.6 mg L−1 total organic carbon (TOC), was sampled from Huawei Pharmacy Company (Yushu, China). The addition of 0.05 g MPs-6 (prepared by 6 M NaOH) removed over 99% of TC and OTC, whereas TOC removal achieved approximately 50% (Fig. 12). Quinoline removal achieved below 15% even though the MPs-6 dosage was increased to 0.5 g, suggesting that MPs-6 had highly selective adsorption of TC and its derivative. In the wastewater, quinoline was in deprotonation form.22 The cationic exchange reaction between quinoline and Na+ on the MPs-6 surface was inhibited, resulting in a low removal rate. Therefore, MPs-6 had ideal removal capacity for TC and its derivative and can thus serve as a desirable sorbent in pharmaceutical wastewater.
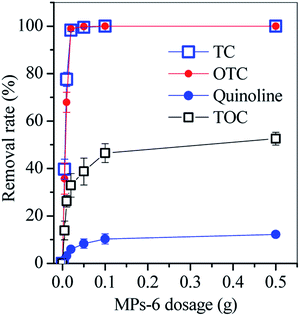 | ||
| Fig. 12 Removal rates of TC, OTC, quinoline and TOC in pharmaceutical wastewater (condition: wastewater volume = 20 mL, initial pH = 5 equilibrium time = 48 h). | ||
In summary, recycling the sludge for magnetic sodalite and/or cancrinite preparation had two advantages. Firstly, the prepared adsorbent had high Hs and adsorption capacities for TC, heavy metals4 and phosphate;1 thus, the adsorbent had considerable potential for wastewater treatment. Secondly, Fe oxides were effectively converted to magnetic species, such as magnetite, maghemite23 and jacobsite.12 This conversion could add value to Fe/Al/Si-containing sludge, such as red mud, fly ash and groundwater treatment sludge from aluminium industries, coal power plants and groundwater plants, respectively. Further study will focus on reducing the synthesis cost of MPs and optimising the conditions for the prepared adsorbent in wastewater treatment.
4. Conclusion
The amorphous sludge was directly converted into magnetic sodalite and/or cancrinite adsorbent via a one-step alkali hydrothermal route with ascorbic acid being the reductant. The magnetic adsorbent was generated in the following steps: (1) dissolution of Al/Si compounds of the sludge with the release of Al(OH)4− and Si(OH)5− into the solution, (2) generation of magnetite from the redox reaction between ascorbic acid and Fe oxides (e.g. ferrihydrite and hematite) and (3) recrystallisation of dissolved aluminosilicate into spherical sodalites with 2 or 4 M NaOH and into dendrite cancrinite by 6 M NaOH. Dendrite cancrinite showed a desirable magnetic response and TC adsorption capacity and had good potential for the treatment of TC-containing wastewater.Conflicts of interest
There are no conflicts to declare, and the authors have no competing interests.Acknowledgements
This work was sponsored by the National Natural Science Foundation of China (Grant Nos. 51578118, 51878134 and 51878133) and the Science and Technology Programme of Jilin Province (Grant No. 20190303001SF).References
- A. O. Babatunde, Y. Q. Zhao, A. M. Burke, M. A. Morris and J. P. Hanrahan, Environ. Pollut., 2009, 157, 2830–2836 CrossRef CAS.
- N. H. Rodríguez, S. M. Ramírez, M. T. B. Varela, M. Guillem, J. Puig, E. Larrotcha and J. Flores, Cem. Concr. Res., 2010, 40, 778–786 CrossRef.
- A. O. Babatunde, Y. Q. Zhao, A. M. Burke, M. A. Morris and J. Hanrahan, Environ. Pollut., 2009, 157, 2830–2836 CrossRef CAS.
- J. Ippolito, K. Barbarick and H. Elliott, J. Environ. Qual., 2011, 40, 1–12 CrossRef CAS.
- C. Irawan, J. C. Liu and C.-C. Wu, Desalination, 2011, 276, 322–327 CrossRef CAS.
- Y. Zhang, L. Yang, D. Wang and T. Zhang, Desalin. Water Treat., 2015, 55, 448–462 CrossRef CAS.
- Y. Lan, W. Jie, Z. Liu, J. Wang and D. Wang, Appl. Surf. Sci., 2015, 330, 228–236 CrossRef.
- F. Espejel-Ayala and R. M. R. Zamora, MRS Proceedings, 2012, 1380, 50–55 CrossRef.
- S. Zhu, S. Fang, M. Huo, Y. Yang, Y. Chen, X. Yang, Z. Geng, Y. Wang, D. Bian and H. Huo, J. Hazard. Mater., 2015, 292, 173–179 CrossRef CAS.
- S. Zhu, G. Dong, Y. Yu, J. Yang, W. Yang, W. Fan, D. Zhou, J. Liu, L. Zhang, M. Huo and Y. Wang, Environ. Sci. Pollut. Res., 25, 22710–22724 CrossRef CAS.
- M. Razali, Y. Q. Zhao and M. Bruen, Separ. Purif. Technol., 2007, 55, 300–306 CrossRef CAS.
- S. Zhu, X. Lin, G. Dong, Y. Yu, H. Yu, D. Bian, L. Zhang, J. Yang, X. Wang and M. Huo, J. Environ. Manage., 2019, 236, 446–454 CrossRef CAS.
- H. Liu, Y. Yang, J. Kang, M. Fan and J. Qu, J. Environ. Sci., 2012, 24, 242–247 CrossRef CAS.
- C. Tang, J. Zhu, Z. Li, R. Zhu, Q. Zhou, J. Wei, H. He and T. Qi, Appl. Surf. Sci., 2015, 355, 1161–1167 CrossRef CAS.
- J.-M. Gautier, E. H. Oelkers and J. Schott, Geochim. Cosmochim. Acta, 1994, 58, 4549–4560 CrossRef CAS.
- G. L. W. Simpson and B. J. Ortwerth, Biochim. Biophys. Acta, Mol. Basis Dis., 2000, 1501, 12–24 CrossRef CAS.
- H. Liu, Y. Yang, J. Kang, M. Fan and J. Qu, J. Environ. Sci., 2012, 24, 242–247 CrossRef CAS.
- M. M. M. Ali, M. J. Ahmed and B. H. Hameed, J. Clean. Prod., 2018, 172, 602–608 CrossRef CAS.
- W. A. Khanday and B. H. Hameed, Fuel, 2018, 215, 499–505 CrossRef CAS.
- Y. Wang, X. Wang, J. Li, Y. Li, S. Xia, J. Zhao, T. M. Minale and Z. Gu, Chem. Eng. J., 2019, 371, 366–377 CrossRef CAS.
- H. Zhang, X. Li, G. He, J. Zhan and D. Liu, Ind. Eng. Chem. Res., 2013, 52, 16902–16910 CrossRef CAS.
- Z. Geng, Y. Yu, S. Zhu, H. Yu, J. Liu, D. Bian, H. Huo and M. Huo, Chem. Res. Chin. Univ., 2017, 33, 36–43 CrossRef CAS.
- S. Zhu, G. Dong, Y. Yu, J. Yang, W. Yang, W. Fan, D. Zhou, J. Liu, L. Zhang, M. Huo and Y. Wang, Environ. Sci. Pollut. Res., 2018, 25, 22710–22724 CrossRef CAS.
Footnote |
| † Electronic supplementary information (ESI) available. See DOI: 10.1039/c9ra06940b |
| This journal is © The Royal Society of Chemistry 2019 |

