 Open Access Article
Spontaneous precipitation pattern formation by crystallites of Mn–Fe-based Prussian blue analogues in agarose gel
Hisashi Hayashi *,
Saya Aoki and
Tomoko Suzuki
Department of Chemical and Biological Sciences, Faculty of Science, Japan Women's University, 2-8-1 Mejirodai, Bunkyo-ku, Tokyo 112-8681, Japan. E-mail: hayashih@fc.jwu.ac.jp
First published on 7th November 2019
Abstract
Precipitation patterns spontaneously formed by Mn–Fe-based Prussian blue analogues (Mn–Fe PBAs) in agarose gel were investigated over wide concentration ranges for the outer (0.10 ≤ [Mn2+] ≤ 0.70 M) and inner electrolytes (0.01 ≤ [[Fe(CN)6]3−] ≤ 0.35 M). The precipitation patterns were classified into five types: continuous in the inner electrolyte gel, continuous in the outer electrolyte gel, a very short band close to the gel boundary, periodic bands in the inner electrolyte gel, and filament-like patterns in the inner electrolyte gel. The concentrations found to be suitable for applications as pulsatile 137Cs adsorbent delivery materials, for which the periodic patterns were most distinct and frequently occurring, were [Mn2+] ≈ 0.55 M and [[Fe(CN)6]3−] ≈ 0.10 M. The filament-like pattern, reported here for the first time, was generated near the cylindrical gel surface in a local, stochastic, and two-dimensional manner. Scanning electron microscopy (SEM) images of the periodic band patterns indicate that the Mn–Fe PBA precipitates in periodic patterns consist of cubic crystallites (3–10 μm, each side), suggesting significant contributions from Ostwald ripening to the precipitation process. In contrast, precipitates in the filament-like pattern consist of relatively smaller cubic crystallites (≲1 μm, each side), implying an important role of rapid nucleation in the formation of this structure. SEM observations also suggest that, overall, agarose gels support crystallite ripening more effectively, and hence also better suppress the formation of definite periodic bands, than water-glass gels. These findings provide useful information for future applications of self-assembled Mn–Fe PBA patterns in gels.
Introduction
Mn–Fe-based Prussian blue analogues (Mn–Fe PBAs; AxMn[Fe(CN)6]y□1−y·nH2O, where A = alkali metal and □ = Fe(CN)6 vacancy, i.e., a defect lacking the Fe(CN)6 moiety) are cyano-bridged coordination compounds with a crystal structure similar to that of Prussian blue (PB). Mn–Fe PBAs have attracted significant attention as an energy storage material1,2 and a potential multifunctional platform for applications including catalysis.3Mn–Fe PBAs also show several interesting crystallization/precipitation phenomena in gels. For example, in inorganic water-glass gels they form Liesegang bands (i.e., periodic precipitation bands of slightly soluble inorganic compounds4), and the banding patterns can be controlled by gel density,5 gel additives,5 or magnetic fields.6 These externally controllable self-organization properties provide insights for the rational design of complex functional materials. To date, however, there have been very few applications of such self-organized precipitation phenomena because of the high sensitivity to experimental conditions and environmental disturbances, the inherent nonlinearities, and the interdisciplinary nature of these phenomena.7 Accordingly, the practical application of the Liesegang bands of PBAs (including Mn–Fe PBAs) has not yet been reported in the literature.
Nevertheless, we recently found a new potential use of the Liesegang banding of Mn–Fe PBAs. Their Liesegang band-like precipitates formed in agarose gel (an organic gel) can trap Cs+ ions more effectively than the continuous precipitates of PB, which has been used for the oral treatment of internal cesium radioisotope (137Cs) contamination.8 The high Cs affinity and their controllable periodic structure indicate that Mn–Fe PBA precipitates in the gel may be applied as a pulsatile 137Cs adsorbent, i.e., as an effective decorporation agent to remove ingested 137Cs from the gastrointestinal tract. However, before developing practical applications, detailed understanding is needed about the patterning of the precipitates and their crystallization states in gels, particularly organic gels. Unfortunately, to the best of our knowledge, such information is currently unavailable. Thus, in the present study, we report the spontaneous patterning of Mn–Fe PBA precipitates formed in agarose gels, as well as their crystalline states.
Experimental
Chemicals
Analytical reagent grade MnSO4·H2O, FeCl2·4H2O, and K3[Fe(CN)6] were obtained from Wako Pure Chemical Industries (Osaka, Japan). Agarose for electrophoresis (gel strength: 1800–2300 g cm−3) was purchased from Kanto Chemical (Tokyo, Japan). Acetic acid (1.00 M) and sodium metasilicate (Na2SiO3) aqueous solution (water-glass, 52–57% assay, 2.06–2.31 SiO2/Na2O mole ratio) were also acquired from Wako Pure Chemical Industries. All chemicals were used without further purification. All aqueous solutions were prepared using deionized water, which was purified from tap water by a cartridge water purifier (G-10, Organo, Tokyo, Japan).Preparation of gel samples
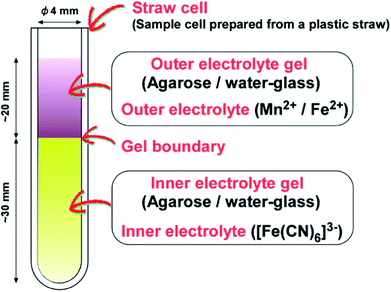
Fig. 1 is a schematic illustration of the gel sample prepared in this study. Two different electrolytes are loaded in separate gel columns in a sample cell prepared from a plastic straw (a straw cell).9 The longer gel column (∼30 mm) is placed at the bottom, where the periodic precipitation bands subsequently form. The shorter column (∼20 mm), on top, has a higher electrolyte concentration. These electrolytes are denoted as the “inner” and “outer” electrolytes, respectively.The inner electrolyte contains [Fe(CN)6]3−. To prepare the gel column, an appropriate amount of agarose was dissolved at ∼98 °C in deionized water (30 mL) with vigorous stirring to prepare sols with 0.5–2.3 mass%. Since the density of water-glass gels was found to change the precipitation patterns of Mn–Fe PBAs,5 here, agarose gels with various densities were prepared, for both the inner and outer electrolyte gels, as outlined below. A predetermined amount of K3[Fe(CN)6] was added to the sols, and the mixture was stirred continuously for 30 s to prepare sols having [Fe(CN)6]3− = 0.01–0.35 M. These sols were transferred to a straw cell using a Pasteur pipette. The hot sols were allowed to cool to 25 °C, and solidified gels were formed within 1000 s. The height of each gel column in the straw cell is ∼30 mm.
The outer electrolyte contains either Mn2+ or Fe2+. To prepare the corresponding gel column, an appropriate amount of agarose was dissolved at ∼98 °C in deionized water (30 mL) with vigorous stirring to prepare sols with mass% in the range of 0–2.3. A predetermined amount of MnSO4·H2O was then added to the agarose sols (or deionized water), and the mixture was stirred continuously for 30 s to prepare Mn2+ sols (0.10–0.70 M). For comparison, 0.994 g of FeCl2·4H2O was added to deionized water (10 mL) and stirred continuously for 30 s to prepare a 0.50- M Fe2+ solution. The resultant Mn2+ sols (or Fe2+ solution) were poured over the inner electrolyte ([Fe(CN)6]3−) gel using a Pasteur pipette, and the Mn2+/Fe2+ sols solidified to gels within 1000 s. The height in the straw cell of the outer electrolyte gel is ∼20 mm.
For comparison, water-glass gels containing the inner ([Fe(CN)6]3−) or outer (Mn2+) electrolytes were also prepared as follows. Water glass (1.612 g for [Fe(CN)6]3− gel and 1.203 g for Mn2+ gel) was dissolved in deionized water (10 mL) to prepare sols having 13.9 and 10.7 mass%, respectively. Then, 0.394 g of K3[Fe(CN)6] or 1.014 g of MnSO4·H2O was added to deionized water (5 mL) to prepare 0.24- and 1.20 M solutions, respectively. The water-glass sol and the [Fe(CN)6]3− or Mn2+ solution were mixed, and then acetic acid (16 mL, 0.5 M) was added. The resultant water-glass sols were stirred continuously for 15 s. Then, the other water-glass sol containing ca. 0.04 M [Fe(CN)6]3− was transferred to a straw cell using a Pasteur pipette, and it solidified to a gel within 1000 s. Subsequently, the water-glass sol containing a concentration of Mn2+ of ca. 0.20 M was poured over the inner electrolyte water-glass gel using a Pasteur pipette. The Mn2+ sol solidified to a gel within 1000 s. The heights of the [Fe(CN)6]3− and Mn2+ water-glass gels in the straw cell were the same as of the corresponding gels in the agarose samples.
Straw cells containing either the agarose or water-glass gel samples were subsequently closed using styrene-resin stoppers covered with Teflon9 (or Parafilm) and were allowed to stand at 25 °C for ∼10 d to form precipitation bands in the gels. The resultant precipitation patterns were photographed using a digital camera (IXY650, Canon, Japan).
Microscopic observations of microcrystals in the precipitation patterns
To observe microcrystals (crystallites) in the precipitation patterns, the cylindrical gels were pulled out from the straw cells and cut into ∼1 mm-thick slabs, which were then examined using an optical microscope (BX41, Olympus, Japan). After this preliminary observation, the slabs were naturally dried for ∼2 h, adhered to one side of a piece of double-sided adhesive carbon tape, and then mounted onto an aluminum stub of a field- emission scanning electron microscope (SEM; SU8220, Hitachi, Japan) that was operated at 2.0 kV with a working distance of 4.8–5.1 mm. Several images were acquired with a gradual increase in magnification to capture the morphologies of the microcrystals formed in the patterns.Results
Precipitation patterns of Mn–Fe PBAs in agarose gels
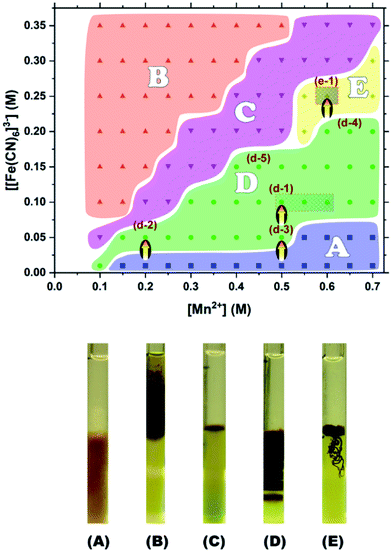
The types of precipitation patterns formed are qualitatively summarized in a diagram in the upper panel of Fig. 2. The x- and y-coordinates are the initial concentrations of the outer (Mn2+) and inner ([Fe(CN)6]3−) electrolytes, respectively; the concentrations corresponding to the acquired SEM images (to be discussed later) are indicated by arrows.As previously shown in a published study of Co–Fe PBAs,10 the banding of PBA precipitations is inherently stochastic, to a greater or lesser degree, because the patterns are formed in the gel in a random way by the coupling of reaction and diffusion processes. The diagram in Fig. 1, therefore, simply identifies the pattern that is the most likely to occur at each set of inner and outer electrolyte concentrations. In other words, the phase boundaries of the diagram are not unambiguously defined.10
The five types of characteristic precipitation patterns are denoted as A, B, C, D, and E in the phase diagram. The concentrations tested experimentally are indicated as squares in region A (continuous patterns in the inner electrolyte gel), triangles in region B (continuous patterns in the outer electrolyte gel), inverted triangles in region C (a very short band close to the gel boundary), circles in region D (periodic band patterns in the inner electrolyte gel), and diamonds in region E (filament-like patterns in the inner electrolyte gels). Typical images of these precipitation patterns are exhibited in the lower panels of Fig. 2.
Notably, the agarose gel density, for both the inner and outer electrolyte gel, did not significantly affect the class of precipitation pattern beyond the relatively large inherent stochasticity.
Patterns A and B were dominant in the [Fe(CN)6]3−-poor and Mn2+-poor-and-[Fe(CN)6]3−-rich regions, respectively. While the continuous region of pattern A was basically uniform, that of pattern B was not necessarily so (see the lower panel of Fig. 2). The non-uniformity of pattern B may be partially attributed to the relatively low density of the outer electrolyte gels. This low gel density was necessary in order to suppress fast- and non-uniform gelation (salting-out) triggered by the higher concentrations of Mn2+. In general, a lower gel density implies a larger pore size and the promotion of nucleation,11 which facilitates the generation of stochastic precipitation patterns.
Pattern C was observed at concentrations near [Mn2+] ≈ 2 [[Fe(CN)6]3−]. This finding suggests that the osmotic motion of Mn2+ ions into the inner electrolyte gel in this case is approximately twice that of the [Fe(CN)6]3− ions into the outer electrolyte gel. The considerably shorter precipitation bands can be attributed to the balance between the opposite osmotic tendencies.
Pattern D was observed near the concentrations of [Mn2+] ≈ 5[[Fe(CN)6]3−]. In this concentration range, [Mn2+] is sufficiently high to diffuse into the inner electrolyte gel, but is still low enough to prevent the formation of continuous precipitation bands. As examples, Fig. 3 exhibits the sample patterns from several points in region D (d-1 to d-5). The periodic precipitation bands are most prominent at d-1. More specifically, the hatched area around d-1 in Fig. 2 ([Mn2+] ≈ 0.55 M, and [[Fe(CN)6]3−] ≈ 0.10 M) indicates the concentration region where the periodic patterns were most clearly and frequently found. Because of the distinct periodicity of the patterns obtained in this region, these gels are the most suitable for applications as a pulsatile 137Cs adsorbent delivery materials.
The rightmost image in Fig. 3 was obtained for a water-glass gel sample4,5 at the concentrations defined as d-2 for comparison. Interestingly, there are considerably fewer periodic bands in the agarose gels, even at the d-1 concentrations, compared to those formed in the d-2 water-glass gel (∼5 vs. 10–15 (ref. 4)), and the bands are much broader in the former case. This finding suggests that in the agarose gel, the nucleation probability of Mn–Fe PBAs and the precipitate locations are generally more stochastic over a wide concentration range, which enhances the formation of wide and/or continuous precipitation bands as opposed to those in the previously reported water-glass gels.4–6 The images of D-region patterns in Fig. 2 and 3 might be disappointing if one expects a well-defined self-patterning material. However, this result must be balanced against other advantageous properties in the formed Mn–Fe PBA precipitates, as discussed in the next section.
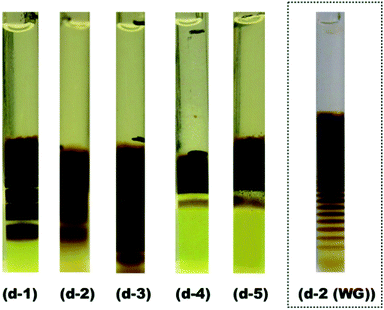 | ||
| Fig. 3 (d-1) to (d-5): Images of periodically banded Mn–Fe PBA precipitates in agarose gel with concentrations corresponding to the labeled points within region D in the phase diagram (Fig. 2). (d-2 (WG)): Image of the water-glass (WG) gel at d-2.4 Black pen marks (used during gel preparation) are also visible in the d-3 and d-4 images: these are not precipitation bands. | ||
The observation of pattern E was unexpected. Some gels are known to form miscellaneous precipitation patterns, including those shaped like trees,12 spiral arms,13 targets,14 cardioids,13 and cabbages,13 depending on preparation conditions. However, to the best of our knowledge, the filament-like, meandering pattern classified as type E here has not been previously reported. This pattern is basically two-dimensional and appears near the cylindrical gel surface. The hatched region in Fig. 2 around e-1 indicates where this pattern was most distinctly and frequently observed. It is apparent that pattern E only forms in a rather limited concentration region of [Mn2+] ≈ 2.4[[Fe(CN)6]3−] and [Mn2+] > 0.55 M. This [Mn2+] range is slightly higher than those generating pattern C, whereas low concentrations of Mn2+ or [Fe(CN)6]3− (<0.5 M) are unfavorable for the formation of pattern E. It is also noteworthy that pattern E was generated locally in a highly stochastic manner, showing an interesting similarity to turbulent-flow leakage from pressure vessels15 or filiform corrosion.16 Further comparative studies are needed to better understand this new self-organized pattern formed in precipitation reactions far from the equilibrium.17
SEM observations of the precipitation patterns
Fig. 4 shows SEM images of precipitates formed in the turbulent zone (TZ) and the periodic banding zone (PZ) at the d-1 concentrations (Fig. 2), where the periodic patterns were most clearly and frequently observed. The precipitates consisted of cubic crystallites, and the crystallites in TZ and PZ had similar sizes (3–5 μm, each side). There were considerably fewer crystallites in PZ than in TZ, corresponding to the concentration difference of the formed Mn–Fe PBA precipitates.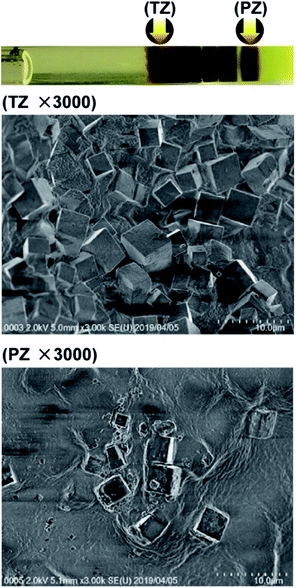 | ||
| Fig. 4 SEM images (×3000) of Mn–Fe PBA precipitates formed in the turbulent zone (TZ) and periodic banding zone (PZ) at the concentrations marked as d-1 in Fig. 2. Arrows in the photograph (uppermost panel) indicate the positions at which the SEM images were acquired. | ||
Fig. 5 shows SEM images of Mn–Fe PBA precipitates formed in agarose gels in the TZ and PZ at d-2 in Fig. 2, where the concentrations of Mn2+ and [Fe(CN)6]3− were relatively low. Also at the d-2 concentrations, the precipitates consisted of cubic crystallites. A comparison between Fig. 4 and 5 indicates that the crystallites formed at d-2 (∼10 μm, each side) were larger than those formed at d-1 (3–5 μm, each side), whereas no significant crystallite size differences were noticeable in TZ (3–5 μm, each side) for these concentrations. This finding suggests that the ripening effects in the PZ of Mn–Fe PBAs become important when the initial electrolyte concentrations are lower. Similar effects have been observed for Co–Fe PBAs in water-glass gels.10
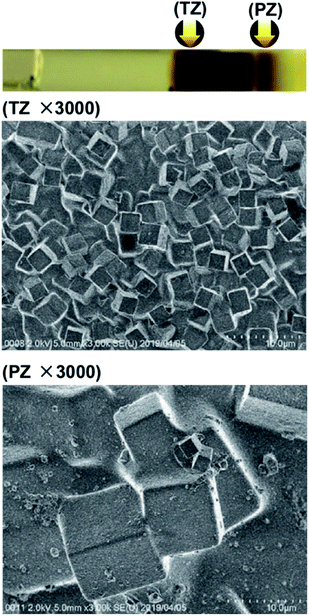 | ||
| Fig. 5 SEM images (×3000) of the Mn–Fe PBA precipitates formed in the turbulent zone (TZ) and periodic banding zone (PZ) in agarose gel at the concentrations marked as d-2 in Fig. 2. Arrows in the photograph (uppermost panel) indicate the positions at which the SEM images were acquired. | ||
For comparison, Fig. 6 shows SEM images of the Mn–Fe PBA precipitates formed in the TZ and PZ in the water-glass gel at the d-2 concentrations, which displays many thin Liesegang bands. Interestingly, comparing the same electrolyte concentrations, in the water-glass gels, the formed Mn–Fe PBA crystallites were considerably smaller (<0.5 μm) and cubic structures were not formed in the TZ. The irregular shapes of the crystallites strongly suggest the existence of many defects, including Fe(CN)6 vacancies, which is consistent with previous XAFS (X-ray absorption fine structures) results.4,5 Meanwhile, the cubic structure of the crystallites in the agarose gels is evident (Fig. 4 and 5). The cubic structure indicates the existence of fewer defects, which may be advantageous in functional materials including cathodes.2 Thus, the disadvantage of the agarose gels as self-assembled functional materials (i.e., limited formation of periodic bands) is compensated by the advantage of the crystallites containing fewer defects.
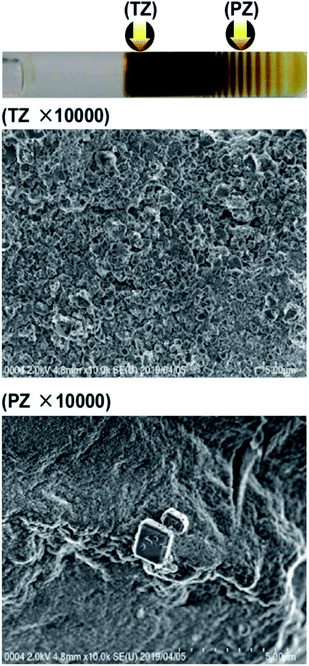 | ||
Fig. 6 SEM images (×10![[thin space (1/6-em)]](https://www.rsc.org/images/entities/char_2009.gif) 000) of the Mn–Fe PBA precipitates formed in the turbulent zone (TZ) and periodic banding zone (PZ) in water-glass gels at the concentrations marked as d-2 in Fig. 2. Arrows in the photograph (uppermost panel) indicate the positions at which the SEM images were acquired. 000) of the Mn–Fe PBA precipitates formed in the turbulent zone (TZ) and periodic banding zone (PZ) in water-glass gels at the concentrations marked as d-2 in Fig. 2. Arrows in the photograph (uppermost panel) indicate the positions at which the SEM images were acquired. | ||
Fig. 7 shows SEM images of the Mn–Fe PBA precipitates formed in the TZ and the PZ of agarose gels at the concentrations d-3 in Fig. 2. In this case, the [Fe(CN)6]3− concentration is relatively low, and strong and stable Cs adsorption on the formed PBAs has been reported.8 Again, the precipitates consisted of cubic crystallites, suggesting a considerably high probability of forming cubic micro-crystallites of Mn–Fe PBAs in the D region. Furthermore, a comparison between Fig. 5 and 7 reveals that in both the TZ and PZ, the sizes of crystallites formed at d-3, ∼3 and ∼10 μm, respectively, are similar to those formed at d-2. Therefore, the concentration of the outer electrolyte (Mn2+; 0.20 M at d-2, 0.50 M at d-3) may have a lesser effect on the crystal size than the inner electrolyte concentration ([Fe(CN)6]3−; 0.05 M at d-2 and d-3).
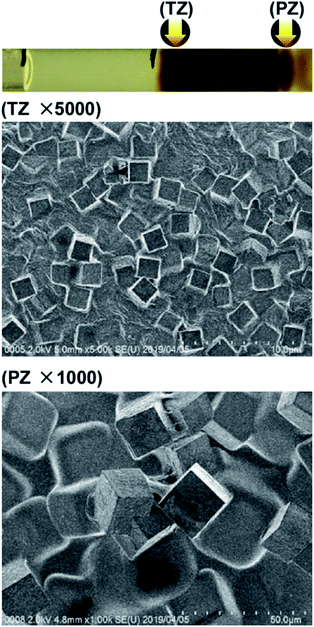 | ||
| Fig. 7 SEM images of the Mn–Fe PBA precipitates formed in the turbulent zone (TZ, ×5000) and periodic banding zone (PZ, ×1000) in agarose gel at the concentrations marked as d-3 in Fig. 2. Arrows in the photograph (uppermost panel, where black pen marks not to be confused with precipitation bands are also visible) indicate the positions at which the SEM images were acquired. | ||
In contrast, the PB precipitates at d-3 did not form stable cubic microcrystallites (Fig. 8); the formed crystallites are quite small (∼0.2 μm, each side) and irregular in size and shape. Such small PB crystallites should have a large surface area, which is expected to facilitate both the adsorption and desorption of Cs+ ions by allowing more frequent contacts with the Cs+ ions (for adsorption) and solvent molecules (for desorption). Thus, in a system containing finely dispersed Cs+ adsorbents, such as the PBs formed at the concentrations d-3 in agarose gels, the Cs+ ions would be rapidly adsorbed and easily desorbed, as observed in a previous study.8 Interestingly, similar size effects (i.e., rapid adsorption on smaller particles) have also been reported for other PB systems.18 In addition to their sizes, the different shapes of the Mn–Fe PBAs (Fig. 7) and PB (Fig. 8) crystallites could alter Cs+ adsorption behavior. The reported high affinity of Cs+ ions for the Mn–Fe PBAs8 may be related to the robust, three-dimensional framework in the PBAs, which is suggested by the relatively large cubic crystals shown in Fig. 7. Detailed local structure around trapped Cs+ ions is discussed in a separate paper.19
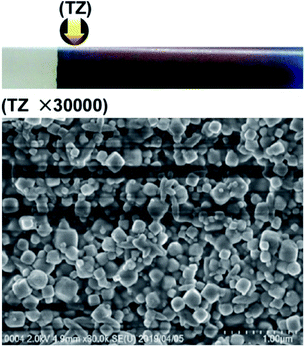 | ||
Fig. 8 SEM image (×30![[thin space (1/6-em)]](https://www.rsc.org/images/entities/char_2009.gif) 000) of PB precipitates formed in agarose gel in the turbulent zone (TZ) for the concentrations marked as d-3 in Fig. 2. The arrow in the photograph (upper panel) indicates the position at which the SEM image was acquired. 000) of PB precipitates formed in agarose gel in the turbulent zone (TZ) for the concentrations marked as d-3 in Fig. 2. The arrow in the photograph (upper panel) indicates the position at which the SEM image was acquired. | ||
Fig. 9 shows SEM images of the Mn–Fe PBA precipitates formed at the turbulent zone (TZ) and the structured zone (SZ) in agarose gels for the concentrations labeled as e−1 in Fig. 2, for which the filament-like pattern (pattern E) was observed. The crystallites formed in the TZ do not differ much in size and shape from those formed in agarose gels at d-1, d-2, and d-3 concentrations, although the numbers of defects, such as cracks and crumbled corners, are quite large. The crystallites formed in the SZ are considerably small (≲1 μm, each side) and have more defects, such that their shapes are quite irregular. Interestingly, there was no clear linkage between the crystallites, indicating that the PBA filaments were free of the one-dimensional tube-like structures (as the so-called “mangrove-like structures” of PB precipitates20) and the oriented attachment of particles frequently observed in other systems.21 The nature of pattern E—relatively small crystallites gathered into form pseudo-one-dimensional patterns—is similar to the formation of the so-called chemical gardens, namely, the plant-shaped precipitation structures grown in aqueous solutions of water-glass over minutes to hours.16,17
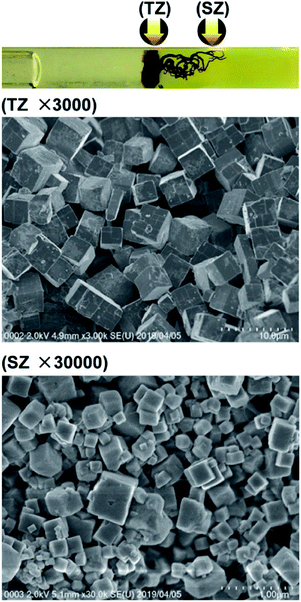 | ||
Fig. 9 SEM images of the Mn–Fe PBA precipitates formed in agarose gel in the turbulent zone (TZ, ×3000) and structured zone (SZ, ×30![[thin space (1/6-em)]](https://www.rsc.org/images/entities/char_2009.gif) 000) for the concentrations marked as e-1 in Fig. 2. Arrows in the photograph (uppermost panel) indicate the positions at which the SEM images were acquired. 000) for the concentrations marked as e-1 in Fig. 2. Arrows in the photograph (uppermost panel) indicate the positions at which the SEM images were acquired. | ||
Discussion
Contributions of nucleation and ripening to crystallite formation in the precipitation structures of Mn–Fe PBAs
When two coprecipitated ions diffuse into gels packed in a tube, parallel periodic bands of precipitates (known as Liesegang bands7,11,22,23) occasionally form in gel media, an example of which is pattern D. Modern theoretical models that explain Liesegang banding can be approximately classified into either pre- or post-nucleation models, depending on the sequence of elementary events.7,11,22–25Pre-nucleation models assume that the formation of the precipitation bands results from repeated cycles of supersaturation, nucleation, and depletion of the reaction products. In these models, as the outer electrolyte ions diffuse into the inner electrolyte gels and react with ions therein, a distinct precipitate band is created as a result of nucleation and crystallization, triggered by supersaturation of the reaction product. No further nucleation occurs in the vicinity of the formed band, because the reactant ions are depleted. Thus, the diffusion of the outer electrolyte ions can only create supersaturation conditions at a farther location, leading to the formation of another discrete precipitation band. Repetition of this process results in the formation of multiple Liesegang bands. Therefore, in pre-nucleation models, crystallites are formed by rapid nucleation and crystallization, triggered by supersaturation, and hence they should be relatively small in size and have irregular shapes.
In contrast, post-nucleation models assume the competitive growth of small particles of reaction products. In these models, the reaction products temporarily form an unstable, almost homogeneous sol of colloidal particles. Subsequently, the particles larger than the average size grow at the expense of the adjacent smaller ones in the sol. Such Ostwald ripening results in large concentration fluctuations of the reactant, through the local growth/depletion of the colloidal particles. This local concentration perturbation subsequently enhances diffusional mass transport away from the original perturbation site, stimulating particle growth at a farther location. As a result, the precipitate self-organizes into Liesegang bands. According to the post-nucleation models, the crystallites in the Liesegang bands must be relatively large in size because most of them have undergone Ostwald ripening.
In summary, the size and shape of the crystallites in the precipitation bands can suggest which process is dominant in the spontaneous formation of these structures: the formation of small and irregular crystallites is more likely to result from the domination of a mechanism based on the pre-nucleation model, while relatively large crystallites indicate the prevalence of the post-nucleation process. Thus, from the SEM images shown in Fig. 4–9, we can conclude that pre-nucleation processes are dominant in forming the SZ of Mn–Fe PBA precipitates (Fig. 9) and the continuous zone of PB precipitates in agarose gel (Fig. 8) and the TZ of Mn–Fe PBA precipitates in water-glass gel (Fig. 6). In contrast, it appears that post-nucleation processes are dominant in forming the PZ of Mn–Fe PBA precipitates in agarose gel (Fig. 5 and 7), and it also significantly contributes to the TZ formed by Mn–Fe PBA precipitates in agarose gel (Fig. 4, 5, 7, and 9). While these observations are somewhat limited, such suggestions pave the way for more comprehensive insights into how the ripening affects the precipitate structures spontaneously formed in gels. Overall, Ostwald ripening contributes more significantly to Mn–Fe PBA than to PB precipitate structures, and it is more important in agarose than in water-glass gels, particularly when the inner electrolyte concentrations are low.
Here, we should recall the general trends of macroscopic (∼1 mm3) crystal growth in gels: if nucleation is well suppressed during crystal growth (e.g., by using lower initial electrolyte concentrations), progressively fewer and larger crystals are formed as one moves away from the gel boundary, partially because of ripening effects.11 This trend holds for the Mn–Fe PBA precipitates prepared at the d-2 and d-3 concentrations, where the periodic banding is not very evident (Fig. 5 and 7). However, the trend does not necessarily hold for the systems that show relatively clear periodic bands (Fig. 4 and 6). This finding suggests that relatively small crystallites, produced by nucleation and not significantly consumed by ripening, effectively form distinct periodic bands as well as filament-like structures.
We believe that the above suggestions, especially those in italicized text, provide valuable information for future applications of spontaneously formed precipitation patterns, not only in Mn–Fe PBAs but also in other PB/PBAs systems.
Finally, it should be noted that the Mn–Fe PBA crystallites form self-organized patterns on the millimeter scale in gels depending on the preparation conditions (Fig. 2 and 3), but basically not on the micrometer scale (Fig. 4–9). The lack of microscale ordering for the current system presents a contrast to the remarkable microscale ordering reported for various nano-crystalline compounds (e.g., α-Fe2O3,21 MnO,21 PbS,21,26 BaCrO4,26 SnO2,26 Bi2S3,26 CuS,26 and Ag3PO4 (ref. 26)), and even for metallic glass (Zr60Al15Ni10Co15 (ref. 27)). In order to expand the applicability of the Liesegang banding of PBAs in gels, several possible techniques to control its self-assembling properties over nano- to milli-meter scales (such as the wet stamping method7) should be investigated in the near future. Also in such, more- microscopic developments, visual/SEM observations, as conducted in this study, may prove useful, as well as other microstructural characterization methods (such as X-ray diffraction and XAFS spectroscopy).
Conclusions
Precipitation patterns of Mn–Fe PBAs spontaneously formed in agarose gels were surveyed, and SEM images were obtained for several characteristic precipitation structures. Five patterns were observed across wide concentration ranges of the inner and outer electrolytes (regions of A, B, C, D, and E in Fig. 2). These were defined as follows: continuous patterns in the inner electrolyte gel—A, continuous patterns in the outer electrolyte gel—B, a very short band at the gel boundary—C, periodic band patterns in the inner electrolyte gel—D, and the newly found filament-like patterns in the inner electrolyte gel—E. The concentrations labeled d-1 ([Mn2+] ≈ 0.55 M, [[Fe(CN)6]3−] ≈ 0.10 M), where the periodic patterns were most clearly and frequently found, are suitable for pulsatile 137Cs adsorbent delivery material applications. In the SEM images of the precipitates generated in the D region, the Mn–Fe PBA periodic pattern structures mainly consist of cubic crystallites (3–10 μm, each side), suggesting significant contributions to their formation from the Ostwald ripening. In contrast, SEM images of region E indicate that precipitates in the filament-like patterns mostly consist of smaller cubic crystallites (≲1 μm, each side), and the formation of this newly observed pattern may have been dominated by rapid nucleation. Overall, the agarose gels seem to better support crystallite ripening than the water-glass gels, and thus the formation of definite periodic bands is somewhat relatively suppressed in the agarose gels. These findings should prove useful for developing real applications of the Mn–Fe PBA patterns formed in gels, including pulsatile 137Cs adsorbent delivery devices.Conflicts of interest
There are no conflicts to declare.Acknowledgements
The authors are grateful to K. Usui, Y. Oshita, and K. Ohbuchi of Japan Women's University for their help with the sample preparation. The SEM analysis was supported by T. Takagi and A. Takahashi of the Laboratory of Electron Microscopy, Japan Women's University. This study was supported by JSPS KAKENHI Grant Number JP19K05409.References
- W.-J. Li, C. Han, G. Cheng, S.-L. Chou, H.-K. Liu and S.-X. Dou, Small, 2019, 1900470 CrossRef PubMed.
- F. Ma, Q. Li, T. Wang, H. Zhang and G. Wu, Sci. Bull., 2017, 62, 358 CrossRef CAS.
- A. Azhar, Y. Li, Z. Cai, M. B. Zakaria, M. K. Masud, M. S. A. Hossain, J. Kim, W. Zhang, J. Na, Y. Yamauchi and M. Hu, Bull. Chem. Soc. Jpn., 2019, 92, 875 CrossRef CAS.
- H. Hayashi and H. Abe, J. Anal. At. Spectrom., 2016, 31, 1658 RSC.
- H. Hayashi and H. Abe, Bull. Chem. Soc. Jpn., 2017, 90, 807 CrossRef CAS.
- H. Hayashi, S. Aoki and H. Abe, ACS Omega, 2018, 3, 4494 CrossRef CAS.
- B. A. Grzybowski, Chemistry in Motion: Reaction–Diffusion Systems for Micro- and Nanotechnology, John Wiley & Sons, Chichester, U.K., 2009 Search PubMed.
- H. Hayashi, Y. Sato, S. Aoki and M. Takaishi, J. Anal. At. Spectrom., 2019, 34, 979 RSC.
- H. Hayashi and M. Takaishi, Anal. Sci., 2019, 35, 651 CrossRef CAS PubMed.
- H. Hayashi, Y. Sato and H. Abe, J. Anal. At. Spectrom., 2018, 33, 957 RSC.
- H. Henisch, Crystals in Gels and Liesegang Rings, Cambridge University Press, Cambridge, U.K., 1988 Search PubMed.
- É. Kárpáti-Smidróczki, A. Büki and M. Zrínyi, Colloid Polym. Sci., 1995, 273, 857 CrossRef.
- P. Hantz, J. Phys. Chem. B, 2000, 104, 4266 CrossRef CAS.
- A. Volford, F. Izsák, M. Ripszám and I. Lagzi, Langmuir, 2007, 23, 961 CrossRef CAS.
- E. S. Ferreira and S. S. Vianna, Braz. J. Chem. Eng., 2016, 33, 525 CrossRef CAS.
- F. Brau, F. Haudin, S. Thouvenel-Romans, A. D. Wit, O. Steinbock, S. S. S. Cardoso and J. H. E. Cartwright, Phys. Chem. Chem. Phys., 2018, 20, 784 RSC.
- E. Nakouzi and O. Steinbock, Sci. Adv., 2016, 2, e1601144 CrossRef.
- H. Ming, N. L. Torad, Y.-D. Chiang, K. C.-W. Wu and Y. Yamauchi, CrystEngComm, 2012, 14, 3387 RSC.
- H. Hayashi, S. Aoki, M. Takaishi, Y. Sato and H. Abe, Phys. Chem. Chem. Phys., 2019, 21, 22553 RSC.
- J. Maselko, A. Toth, D. Horvath, J. Pantaleone and P. Strizhak, Self-construction of complex precipitation structures by spatio-temporal organization of physical and chemical processes, in Precipitation Patterns in Reaction–Diffusion Systems, ed. I. Lagzi, Research Signpost, Kerala, India, 2010 Search PubMed.
- V. K. Ivanov, P. P. Fedorov, A. Ye Baranchikov and V. V. Osiko, Russ. Chem. Rev., 2014, 83, 1204 CrossRef CAS.
- S. Sadek and R. Sultan, Liesegang patterns in nature: A diverse scenery across the sciences, in Precipitation Patterns in Reaction–Diffusion Systems, ed. I. Lagzi, Research Signpost, Kerala, India, 2010 Search PubMed.
- F. Izsák and I. Lagzi, Models of Liesegang pattern formation, in Precipitation Patterns in Reaction–Diffusion Systems, ed. I. Lagzi, Research Signpost, Kerala, India, 2010 Search PubMed.
- M. Chacron and I. L'Heureux, Phys. Lett. A, 1999, 263, 70 CrossRef CAS.
- I. L'Heureux and R. Bektursunova, Modeling Liesegang periodic precipitation patterns in geochemical systems, in Precipitation Patterns in Reaction–Diffusion Systems, ed. I. Lagzi, Research Signpost, Kerala, India, 2010 Search PubMed.
- L. Qi, Coord. Chem. Rev., 2010, 254, 1054 CrossRef CAS.
- J.-M. Li, Appl. Phys. Lett., 2007, 90, 041913 CrossRef.
| This journal is © The Royal Society of Chemistry 2019 |

