 Open Access Article
Practical PBT/PC/GNP composites with anisotropic thermal conductivity
Xiaolei Zheng and
Bianying Wen *
*
Department of Material Science and Engineering, Beijing Technology and Business University, Beijing 100048, P.R. China. E-mail: wenbianying@tsinghua.org.cn; Tel: +86-10-68985480
First published on 7th November 2019
Abstract
Most of the highly thermally conductive polymer-based composites currently face problems that must be solved before they can be directly used in industrial production. Herein, a practical polybutylene terephthalate (PBT)/polycarbonate (PC)/graphite nanoplatelet (GNP) thermally conductive composite with relative low filler content was prepared by a conventional melt-blending technique. GNPs selectively distributed and oriented in the PBT phase afford the composite a low percolation threshold and anisotropic thermal conductivity. Investigation of the influence of filler content on the final comprehensive performance showed that a prepared PBT/PC/GNP composite with 20 vol% GNPs exhibited superior performance in thermal conductivity, heat resistance, and mechanical properties. The in-plane and through-plane thermal conductivities of the composite were 5.82 W m−1 K−1 and 1.06 W m−1 K−1, respectively, which were increased by 2430% and 361% as compared to that of a neat PBT/PC blend. The Vicat softening temperature increased by 17.7 °C and reached 213.7 °C, while the mechanical properties also maintained a good application level.
1 Introduction
With the rapid development of microelectronic techniques for integration and functionalization, efficient heat dissipation has become urgent and important for electronic devices.1,2 The thermally conductive polymer composite has the advantages of low density, adjustable thermal conductivity, good flexibility, and easy processing, and has strong potential application prospects in the electronics industry because it can be applied to solve thermal management problems.3–5 Numerous studies have been carried out to increase the thermal conductivity of polymeric composites via a variety of approaches, such as using unique mixing methods,6–9 functional modification,10–13 electrospinning,14,15 in situ polymerization16–19 and other sophisticated methods.20,21For example, Bryning et al.22 developed a method to disperse purified single-walled carbon nanotubes (SWCNTs) into epoxy with ultrasonic treatment and significantly reduced the percolation threshold. Guo et al.14 designed a new chemically modified graphene (CMG) thermally conductive filler by functionalizing graphene oxide (GO), and the high thermal conductivity of polyimide composite with low filler content was realized via sequential in situ polymerization and electrospinning-hot press technology. Xu et al.23 presented the recent achievements of thermal conductivity in polymers and polymer-based nanocomposites from both experimental and theoretical perspectives. Nevertheless, due to the complicated operations, harsh reaction conditions, high cost, or the utilization of toxic solvents, most of these methods cannot easily be used in industrial production. Therefore, how to use existing industrial equipment and technology to enhance the thermal conductivity of polymeric composites is of great significance.
The advantages of melt mixing are simple operation, high efficiency, low cost, and easy implementation, and because of these advantages, it is one of the most commonly used industrial processes for the preparation of polymeric functional composite. Because increasing the thermal conductivity of a polymer usually requires filling with a large amount of filler, melting-blending methods are ideal to use because they can achieve an effective dispersion or ordered distribution of the filler in the polymer matrix and also reduce the filler content.
There has been great interest in recent years in platelet-like functional fillers due to their anisotropic structure and higher thermal conductivity.24–26 The use of asymmetrically shaped fillers that are easily oriented or overlapped into a network in a polymer matrix is an effective strategy for achieving high thermal conductivity with low filler levels. For instance, Marconnet et al.27 fabricated an oriented carbon nanotube (CNT)/epoxy nanocomposite using an in situ injection approach, in which epoxy was injected into CNT arrays to obtain a composite with an axial thermal conductivity of 4.87 W m−1 K−1 at 16.7 vol% CNT, which is much greater than the reported values of unaligned CNT-filled composites. Sun et al.28 report a boron nitride (BN) plate/polycarbonate (PC) composite in which BN plates were aligned in PC, and the obtained composites possessed a maximum thermal conductivity of 3.09 W m−1 K−1 along the aligned direction as the BN loading reached 18.5 vol%. The above results illustrate that oriented fillers in polymer matrix are expected to enhance the thermal conductivity of the resulting composites due to the presence of minimum thermal resistance along the oriented direction.
The use of a co-continuous polymer blend as a matrix to distribute the filler segregation in one of the phases has proven to be an effective means of reducing the percolation threshold for polymer-based conductive materials.29 Cao et al.30 reported multi-walled carbon nanotubes (MWCNTs) and silicon carbide (SiC) nanoparticles selectively distributed in the poly(vinylidene fluoride) (PVDF) phase of PVDF/polystyrene (PS) blends that achieved a percolation threshold of 2.9 vol% loading, thus yielding higher thermal conductivity. A polybutylene terephthalate (PBT)/polycarbonate (PC) blend, which was used in the current study, is different from general polymer blends because it is a polymer pair that can chemically react with each other. The transesterification reaction between PBT and PC not only increases the compatibility of the two polymers, but it also can adjust the phase structure of the PBT/PC blend by transesterification inhibitors.31 Based on our previous work,32 graphite nanoplatelets (GNPs), possessing a typical two-dimensional layered structure that is used as filler with excellent thermal conductivity, can be selectively distributed in the PBT phase. The GNPs create favourable conditions for the preparation of polymer-based composites with low filler loadings and high thermal conductivity.
This research is dedicated to the development of a polymer-based thermally conductive composite that can be directly and industrially produced. Taking GNPs and a PBT/PC blend as the functional filler and matrix, respectively, PBT/PC/GNP composites were prepared by melt mixing. The effects of the filler content and orientation on the thermal conductivity of the composite were investigated, and the corresponding thermal conducting mechanism is also discussed. Additionally, from an application perspective, the heat-resistant and mechanical properties of the composites were also investigated.
2 Experimental
2.1 Materials
All the materials used in the present work are industrial grade. Polybutylene terephthalate resins (PBT201-G0ST) with a density of 1.3 g cm−3 (25 °C) were provided by Beijing Research Institute of Chemical Industry, China. Bisphenol-A PC (2805) with a density of 1.18 g cm−3 (25 °C) was purchased from Bayer Co., Ltd., Germany. The GNPs with a lateral size of 8 μm were supplied by Qingdao Yanhai Carbon Material Co., Ltd., China. Triphenyl phosphite (TPPi) was provided by J&K Scientific Ltd., China.2.2 Sample preparation
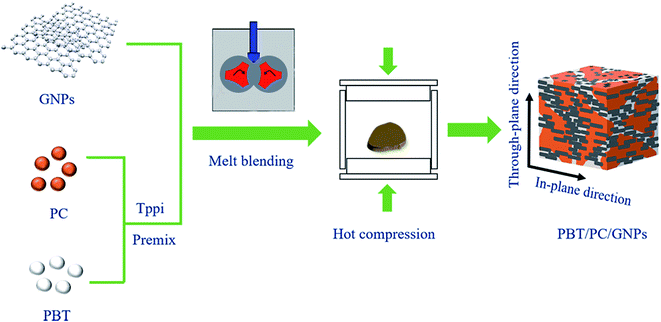
An appropriate quantity of PBT and PC was dried in a vacuum oven at 120 °C for 6 h and premixed with TPPi (1 wt% with respect to the matrix) in a high-speed mixer. Then, PBT/PC blends (in a volume ratio of 1/1) filled with various amounts of GNPs were prepared by melt mixing in a torque rheometer (XSS-300) at 240 °C with a rotation speed of 60 rpm for 10 min.The above melted and mixed composites were hot compressed to obtain the desired size and thickness using a hot press machine (LP-S-50) at 240 °C under 50 bars for 15 min to obtain a series of specimens required for testing. Fig. 1 shows the general manufacturing process of the PBT/PC/GNP composites.
2.3 Characterization
The thermal conductivity was measured with a LFA 467 laser flash thermal conductivity analyser (NETZSCH, Germany). Specimens were prepared in cubic shapes that were 10 mm in side length and 1 mm in thickness. The brittle fracture cross-sections of the composite were observed by scanning electron microscopy (SEM) (FEG 250, Quanta FEI). The PC phase was selectively etched by dichloromethane (CH2Cl2) in advance. All the samples were sprayed with gold before observation.Differential scanning calorimetry (DSC) (Q100, TA Instruments) was used to study the crystallization properties of the blends. The instrument was calibrated with indium as a standard, and all measurements were conducted under nitrogen atmosphere. The weight of the samples for DSC measurements was 5–10 mg. The samples were heated to 250 °C at a heating rate of 10 °C min−1 and isothermally maintained for 3 min to eliminate any complex thermal history. Then, they were cooled to 40 °C at the rate of 10 °C min−1 and isothermally maintained for 3 min. Subsequently, they were heated again to 250 °C at 10 °C min−1. The crystallinity (χc) for the PBT component was calculated by
 | (1) |
The Vicat softening temperature (VST) of samples was measured with a micro control Vicat softening point testing instrument (ZWK-1302-B) according to the GB/T1633-2004 standard. The temperature was increased in a heated environmental chamber at 120 °C min−1, with applied stress of 10 N. Thermogravimetric analysis (TG) of samples was performed using a TA Instruments Q50 machine. Each specimen was placed into a platinum crucible and heated at a scan rate of 20 °C min−1 from room temperature to 800 °C under a nitrogen atmosphere.
Tensile tests were performed using a universal tensile machine (CMT6104) at room temperature with a crosshead speed of 50 mm min−1 according to the GB/T1040.2-2006 standard. The no-notch impact strength of the sample was tested using a beam impact testing machine (XJZ-50) according to the GB/T 1043.1-2008 standard.
3 Results and discussion
3.1 Thermal conductivities
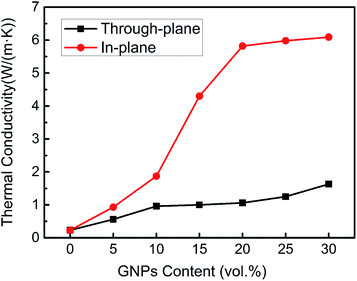
The thermal conductivity is the primary indicator for evaluating the performance of a thermally conductive composite. Fig. 2 presents the thermal conductivity as a function of GNP content for PBT/PC/GNP composites. It can be seen that both the in-plane and the through-plane thermal conductivity of the PBT/PC/GNP composite continuously increased with the increasing GNP content. The thermal conductivity of the PBT/PC/GNP composite is typically anisotropic, and the in-plane thermal conductivity is much higher than that of through-plane thermal conductivity. When the content of GNPs is lower than 20 vol%, the in-plane thermal conductivity significantly increases with the increase in filler content; beyond 20 vol% of GNPs, the in-plane thermal conductivity slightly increased with the increasing GNP content.It has been determined that the percolation threshold of PBT/PC/GNPs is approximately 20 vol%. In contrast, the through-plane thermal conductivity slowly increased with the increasing GNP content, and no percolation threshold was observed, but the growth rate after 20 vol% was higher than that before 20 vol%. Thus, for this composite system, 20 vol% of the GNP loading is an important node. At 20 vol% GNP content, the in-plane and through-plane thermal conductivity of the PBT/PC/GNP composite is 5.82 W m−1 K−1 and 1.06 W m−1 K−1, which is 2430% and 361% higher than that of a neat PBT/PC blend, respectively. From 20 to 30 vol% GNP content, the in-plane and through-plane thermal conductivity of the PBT/PC/GNP composite increased 5% and 54%, and reached 6.09 W m−1 K−1 and 1.63 W m−1 K−1, respectively.
The cross-sectional microstructure of PBT/PC/GNP composites was observed via SEM to explore their thermal conduction mechanisms. Before acquiring images, the sample surfaces were etched with CH2Cl2, which resulted in the retention of the PBT phase and the leaching out of PC with resultant formation of holes, as shown in Fig. 3. Fig. 3a shows that there are a small number of GNPs (5 vol%) that are embedded in PBT, and the hole left by PC is clearly visible. This leads to less thermally conductive paths formed, and the corresponding thermal conductivity is low. By increasing the GNP content to 10 vol% (see Fig. 3b), many GNPs are observed, with decreasing gaps between adjacent GNPs and some connecting GNPs. Fig. 3c and d show similar morphologies, in which the GNPs are closely in contact with each other and are highly oriented along the horizontal direction. This indicates that a dense thermal pathway formed, resulting in a significant increase in the thermal conductivity of the PBT/PC/GNP composite. In the vertical direction, 30 vol% GNP content is denser than that of 20 vol% GNPs, which results in a higher through-plane thermal conductivity. The GNPs oriented in the polymer matrix are generated by shear flow and provide extra-lateral pressure during actual processing. The two-dimensional layered structural GNPs are prone to arrange themselves along the horizontal direction. The orientation of filler inevitably leads to the anisotropic property of the composite.
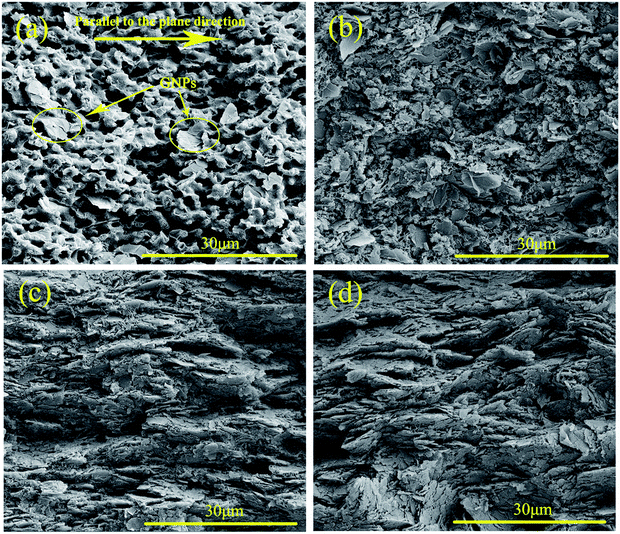 | ||
| Fig. 3 SEM images of cross section of PBT/PC/GNPs composites with different GNPs content: (a) 5 vol%, (b) 10 vol%, (c) 20 vol%, (d) 30 vol%. The PC phase was selectively etched by dichloromethane. | ||
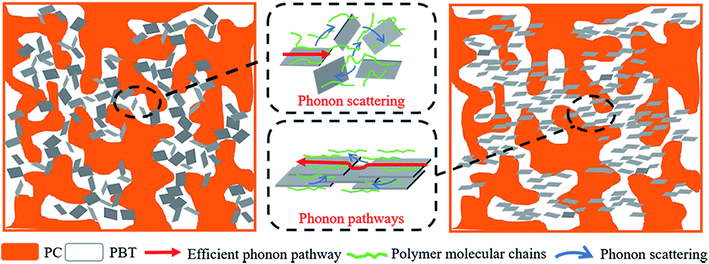
Fig. 4 provides a schematic diagram of the heat conduction model, which clearly expresses the thermal conducting mechanisms of the PBT/PC/GNPs composites. The figure shows that the oriented and well-stacked two-dimensional layered structural GNPs established an efficient conductive network as well as phonon transfer pathways, especially in the plane direction of GNPs because of their perfect π–π chemical bond structure. Therefore, the high in-plane thermal conductivity of the PBT/PC/GNP composite was achieved. However, phonon scattering is inevitable between GNP surfaces and at the interface with polymers. Thus, there is a decrease in heat transfer efficiency that results in low thermal conductivity in the through-plane direction of PBT/PC/GNPs composites.
3.2 Crystallization properties
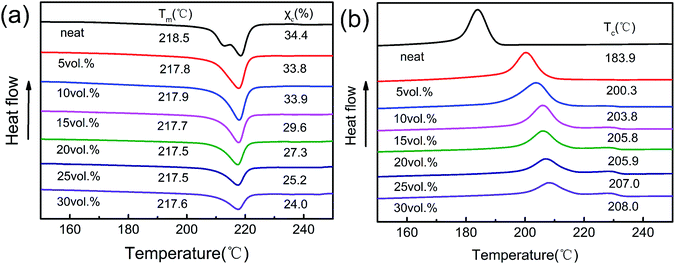
The crystallinity (χc) of the polymer plays an important role in its thermal conductivity because phonon transfer in the crystalline region is more efficient than that in the amorphous region through the vibration of the crystal lattice.34 The crystallization behaviours of neat PBT/PC and PBT/PC/GNP composites were investigated by DSC, and the melting and crystallization data are also summarized in Fig. 5. As shown in this figure, the neat PBT/PC has two melting peaks, but the PBT/PC/GNP composite has only one peak, corresponding to the crystal melting of PBT. This is because during the slow heating process, the imperfect crystal portion formed by PBT melts first, and the unmelted portion is subsequently used as the nucleation point to form the melting recrystallization, which can be melted at a higher temperature, thus forming the molten bimodal. With the GNP incorporation, the crystallization of PBT is improved.35All of the PBT/PC/GNP composites exhibited almost the same melting point (Tm), which is similar to that of the stable crystallization melting point of neat PBT/PC (218.5 °C). Fig. 5b shows that the introduction of GNPs induces an increase in the crystallization temperature (Tc). For example, neat PBT/PC exhibits a Tc of 183.9 °C. When the GNP content is at 30 vol%, the composite shows a Tc of 208 °C, which is 24 °C higher than that with no added GNPs. This indicates that GNPs play a role in heterogeneous nucleation and increase the crystallization ability of PBT. However, interestingly, the crystallinity of χc is different. When the GNPs are less than 10 vol%, the χc of the PBT/PC/GNPs composite remains at approximately 34%, and when the GNPs are present at more than 15 vol%, the χc significantly decreased. The reason for that is because a greater quantity of filled GNPs reduces the relative content of the PBT component, and the excessive addition of GNPs inhibits the mobility of polymer chains. As a result, the χc of PBT is reduced.
It is worth noting that the thermal conductivity of the PBT/PC/GNP composite increases with the increase in GNP content (Fig. 2), which indicates that χc is not the main reason for the enhanced thermal conductivity in such a highly filled composite system. The GNP content has a decisive effect on increasing the thermal conductivity of composites.
3.3 Heat-resistance properties
Improving the heat-resistance properties of thermally conductive composites is of great significance for expanding their range of applications.The VST reflects the upper limit of the normal use temperature, and the thermal degradation temperature reflects the upper limit of the safe service temperature of the composite. These are important indexes for characterizing the heat-resistant properties of materials.
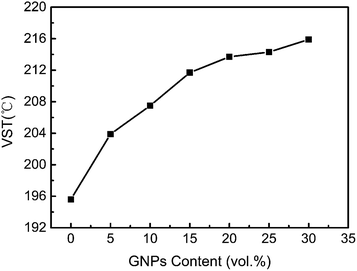
Fig. 6 shows the VST of neat PBT/PC and PBT/PC/GNP composites as a function of different GNP content. Obviously, the VST of the PBT/PC/GNPs gradually increased with the increase in the GNP content. For instance, the VST of the PBT/PC/GNPs composite with 20 vol% GNPs is 213.7 °C, which is 17.7 °C higher than that of the neat PBT/PC blend. These experimental results illustrate that filled GNPs effectively increase the heat resistance of the composites. This is because the rigid GNPs dispersed in the polymer matrix limit the movement of molecular chains and act as a skeleton to strengthen the deformation resistance of PBT/PC/GNPs composites. By increasing the GNP content from 20 vol% to 30 vol%, the VST of the PBT/PC/GNP composite only increased 1% and reached 215.9 °C. This occurred because it formed a frame network at 20 vol% GNPs, as shown in Fig. 3c and d.
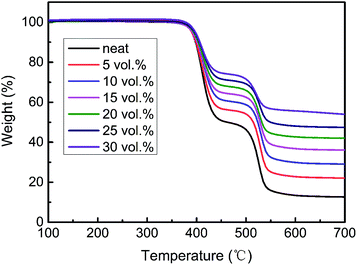
The TG curves for neat PBT/PC and PBT/PC/GNP composites are presented in Fig. 7, and the corresponding characteristic data are listed in Table 1. Fig. 7 shows that all of the composites exhibit a two-step degradation mechanism, in which the first step is attributed to the degradation of the PBT phase (onset temperature at approximately 346 °C) and the second one to the PC phase (onset temperature at approximately 467 °C); all the terminal decomposition temperatures are higher than 624.8 °C. Obviously, the thermal weight loss of PBT/PC/GNP composites decreases with the increase in the GNP content. The corresponding weight loss temperature and the terminal decomposition temperature are increased at the same stages with increasing addition of GNPs. Additionally, the corresponding Theat-resistance index (THRI) of neat PBT/PC and PBT/PC/GNP composite is also improved (Table 1).
| GNP content (vol%) | Temperature for weight loss (°C) | Tterminal decomposition temperature (°C) | Theat-resistance indexa (°C) | |
|---|---|---|---|---|
| 5 wt% | 30 wt% | |||
| a The sample's heat-resistance index is calculated by36 Theat-resistance index = 0.49 [T5 + 0.6(T30 − T5)], where T5 and T30 correspond to the decomposition temperature of 5 wt% and 30 wt% weight loss, respectively. | ||||
| 0 | 390 | 415 | 624.8 | 198.5 |
| 5 | 390.2 | 419 | 632.2 | 199.7 |
| 10 | 391.7 | 424.4 | 639.8 | 201.5 |
| 15 | 392 | 428 | 675.5 | 202.7 |
| 20 | 394 | 437.3 | 687.4 | 214.3 |
| 25 | 396 | 489.6 | 689.8 | 221.6 |
| 30 | 397 | 506.6 | 694.6 | 226.8 |
The heat-resistance properties of the PBT/PC/GNP composites are improved with the addition of increasing quantities of GNPs. This occurs because compared to neat PBT/PC, GNPs possess relatively higher specific heat capacity (C) and thermal conductivity, preferably absorbing heat, which results in the degradation of PBT/PC molecular chains at higher temperatures. When the GNP content is at 20 vol%, the decomposition temperature for 5 wt% and 30 wt% weight loss reaches to 394 °C and 437.3 °C, respectively; the terminal decomposition temperature increases to 687.4 °C, and the corresponding THRI value of the PBT/PC/GNP composite is 214.3 °C, which is 15.8 °C higher than that of neat PBT/PC. From 20 vol% to 30 vol% GNPs, the THRI value was enhanced by 6%, and the temperature reached 226.8 °C. In summary, the PBT/PC/GNP composite filled with greater than 20 vol% GNPs exhibit excellent heat-resistance properties that provide favourable conditions for their practical application.
3.4 Mechanical properties
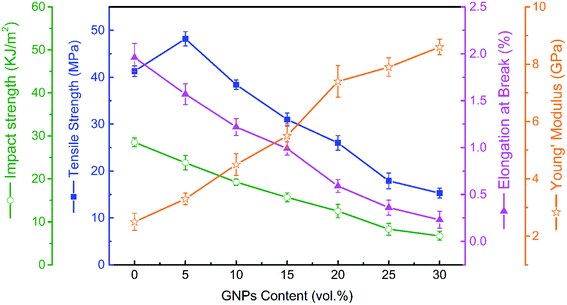
For most thermally conductive functional polymeric composites, the mechanical properties are critical. To enhance the thermally conductive properties, the filler particles should contact each other and form a connected network. To improve the mechanical properties, particles should conglomerate in the matrix, and it is easy to cause stress concentration. Therefore, it is necessary to find a balance between function and performance for a polymeric composite.Fig. 8 presents the mechanical properties of the PBT/PC/GNPs composites with varying quantities of GNPs. It is noted that the Young's modulus of the PBT/PC/GNP composite was enhanced with increasing GNP content because effective deformation resistance could occur due to the high filler content and orientation of the GNPs. The tensile strength of the PBT/PC/GNP composites increased up to the optimal value at 5 vol% GNP incorporation, but it decreased with further addition of GNPs. Compared with neat PBT/PC (41.3 MPa), the maximum tensile strength of the PBT/PC/GNP composites with 5 vol% GNPs reached 48.2 MPa, an increase of 17%, while the impact strength and elongation at break of the composites continued to decrease. This occurred because appropriate amounts of GNPs have a reinforcing effect on the PBT/PC blend due to the selective distribution of GNPs that greatly increased the efficiency of the formation of the force transference network.37 However, with excessive addition of GNPs, the filler particle conglomeration in the matrix weakens the interfacial bond and leads to a reduction in the mechanical properties of the PBT/PC/GNPs composites.38
For GNP content at 20 vol%, the tensile strength, impact strength, and elongation at break of the PBT/PC/GNP composite is 26 MPa, 12.5 kJ m−2, and 0.59%, respectively, which still maintains a high application value. Once the GNP content increases to 30 vol%, the tensile strength, impact strength, and elongation at break of the PBT/PC/GNP composites decreased to 15.3 MPa, 6.75 kJ m−2, and 0.23%. Therefore, PBT/PC/GNP composite filled with 20 vol% GNPs has better application prospects and cost performance. The ability to simultaneously improve the thermal conductivity and mechanical properties is a long-term technical challenge for thermally conductive composites.
4 Conclusions
In summary, an anisotropic thermally conductive PBT/PC/GNP composite with high thermal conductivity was prepared using a simple melt-blending technique. The selective distribution and orientation of the filler in the PBT/PC blend matrix afforded the composites with high thermal conductivity, good heat-resistance properties, and more optimal mechanical properties. Good cost performance was attained for the PBT/PC/GNP composite with the balanced node of 20 vol% GNPs loading. The in-plane and through-plane thermal conductivities of composite with 20 vol% GNPs are 5.82 W m−1 K−1 and 1.06 W m−1 K−1, respectively, which were enhanced by 2430% and 361%, respectively, as compared to that of a neat PBT/PC blend. The heat resistance of the composites was significantly increased, and the VST reached 213.7 °C. Additionally, the tensile strength and impact strength of the PBT/PC/GNP composite were maintained at 26 MPa and 12.5 kJ m−2, respectively. Because these composites have the advantages of simple preparation and superior performance, they have high application value in the field of heat dissipation.Conflicts of interest
There are no conflicts to declare.Acknowledgements
This work was financially supported by the Project of the Innovative Research Team of New Functional Materials of Beijing Technology and Business University. The author thanks the Beijing Chemical Industry Research institute Co. Ltd. for their assistance.Notes and references
- F. Wang, X. Zeng, Y. Yao, R. Sun, J. Xu and C. P. Wong, Sci. Rep., 2016, 6, 19394 CrossRef.
- Q. Li, L. Chen, M. R. Gadinski, S. Zhang, G. Zhang, H. Li, A. Haque, L. Q. Chen, T. Jackson and Q. Wang, Nature, 2015, 523, 576–579 CrossRef CAS.
- D. Suh, C. M. Moon, D. Kim and S. Baik, Adv. Mater., 2016, 28, 7220–7227 CrossRef CAS.
- Y. Yao, X. Zeng, R. Sun, J. B. Xu and C. P. Wong, ACS Appl. Mater. Interfaces, 2016, 8, 15645–15653 CrossRef CAS.
- E. C. Cho, J. H. Huang, C. P. Li, C. W. Chang-Jian, K. C. Lee, Y. S. Hsiao and J. H. Huang, Carbon, 2016, 102, 66–73 CrossRef CAS.
- J. Huang, Y. Zhu, L. Xu, J. Chen, W. Jiang and X. Nie, Compos. Sci. Technol., 2016, 129, 160–165 CrossRef CAS.
- X. Wang, X. Liu, H. Yuan, H. Liu, C. Liu, T. Li, C. Yan, X. Yan, C. Shen and Z. Guo, Mater. Des., 2018, 139, 372–379 CrossRef CAS.
- F. Ren, D. Song, Z. Li, L. Jia, Y. Zhao, D. Yan and P. J. Ren, J. Mater. Chem. C, 2018, 6, 1476–1486 RSC.
- A. Li, C. Zhang and Y. Zhang, Composites, Part A, 2017, 101, 108–114 CrossRef CAS.
- X. Zhang, X. Zhang, M. Yang, S. Yang, W. Hong, S. Guo and Y. Wang, Compos. Sci. Technol., 2016, 136, 104–110 CrossRef CAS.
- H. Oh and J. Kim, Compos. Sci. Technol., 2019, 172, 153–162 CrossRef CAS.
- S. Roy, T. Das, Y. Ming, X. Chen, C. Y. Yue and X. J. Hu, J. Mater. Chem. A, 2014, 2, 3961–3970 RSC.
- H. Guo, J. Liu, Q. Wang, M. Liu, C. Du, B. Li and L. Feng, Compos. Sci. Technol., 2019, 181, 107713 CrossRef.
- Y. Guo, G. Xu, X. Yang, K. Ruan, T. Ma, Q. Zhang, J. Gu, Y. Wu, L. Hu and Z. J. Guo, J. Mater. Chem. C, 2018, 6, 3004–3015 RSC.
- H. Zheng, X. Lei, T. Cheng, S. Liu, X. Zeng and R. Sun, Nanotechnology, 2017, 28, 265204 CrossRef.
- Z. Hu, C. Wang, F. Zhao, X. Xu, S. Wang, L. Yu, D. Zhang and Y. Huang, Nanoscale, 2017, 9, 8825–8833 RSC.
- Z. Hu, D. Zhang, L. Yu and Y. Huang, J. Mater. Chem. B, 2018, 6, 518–526 RSC.
- M. Lahelin, M. Annala, A. Nykänen, J. Ruokolainen and J. Seppälä, Compos. Sci. Technol., 2011, 71, 900–907 CrossRef CAS.
- D. Wang, H. Li, M. Li, H. Jiang, M. Xia and Z. J. Zhou, J. Mater. Chem. C, 2013, 1, 2744–2749 RSC.
- N. Bagotia, V. Choudhary and D. Sharma, Composites, Part B, 2017, 124, 101–110 CrossRef CAS.
- X. L. Xie, Y. W. Mai and X. P. Zhou, Polym. Mater. Sci. Eng., 2005, 49, 89–112 Search PubMed.
- M. B. Bryning, M. F. Islam, J. M. Kikkawa and A. G. Yodh, Adv. Mater., 2010, 17, 1186–1191 CrossRef.
- X. Xu, J. Chen, J. Zhou and B. Li, Adv. Mater., 2018, 30, 1705544 CrossRef.
- M. Varenik, R. Nadiv, I. Levy, G. Vasilyev and O. Regev, ACS Appl. Mater. Interfaces, 2017, 9, 7556–7564 CrossRef CAS.
- L. Fan and J. M. Khodadadi, Renewable Sustainable Energy Rev., 2011, 15, 24–46 CrossRef CAS.
- F. Li, Y. Lu, L. Liu, L. Zhang, J. Dai and J. Ma, Polymer, 2013, 54, 2158–2165 CrossRef CAS.
- A. M. Marconnet, N. Yamamoto, M. A. Panzer, B. L. Wardle and K. E. Goodson, ACS Nano, 2011, 5, 4818–4825 CrossRef CAS.
- N. Sun, J. Sun, X. Zeng, P. Chen, J. Qian, R. Xia and R. Sun, Composites, Part A, 2018, 110, 45–52 CrossRef CAS.
- K. Cheah, M. Forsyth and G. P. Simon, J. Polym. Sci., Part B: Polym. Phys., 2015, 38, 3106–3119 CrossRef.
- J. P. Cao, X. Zhao, J. Zhao, J. W. Zha, G. H. Hu and Z. M. Dang, ACS Appl. Mater. Interfaces, 2013, 5, 6915–6924 CrossRef CAS.
- W. Q. Zou, B. Y. Wen and Z. Yang, Acta Polym. Sin., 2016, 5, 606–613 Search PubMed.
- B. Wen and X. Zheng, Compos. Sci. Technol., 2019, 174, 68–75 CrossRef CAS.
- M. P. Gashti and R. Hajiraissi, Fibers Polym., 2013, 14, 1324–1331 CrossRef CAS.
- W. Zhou, J. Zuo and W. Ren, Composites, Part A, 2012, 43, 658–664 CrossRef CAS.
- J. T. Yeh and J. Runt, J. Polym. Sci., Part B: Polym. Phys., 1989, 27, 1543–1550 CrossRef CAS.
- J. Gu, J. Du, J. Dang, W. Geng, S. Hu and Q. Zhang, RSC Adv., 2014, 4, 22101–22105 RSC.
- L. Shanshan, L. Benke, C. Tingting, Y. Wei and W. Xianhong, Compos. Sci. Technol., 2018, 167, 364–370 CrossRef.
- J. Gu, C. Liang, J. Dang, W. Dong and Q. Zhang, RSC Adv., 2016, 6, 35809–35814 RSC.
| This journal is © The Royal Society of Chemistry 2019 |

