 Open Access Article
Developing a screen-printed graphite–polyurethane composite electrode modified with gold nanoparticles for the voltammetric determination of dopamine
Priscila Cervini,
Isabela A. Mattioli and
Éder T. G. Cavalheiro *
*
Instituto de Química de São Carlos, Universidade de São Paulo, Av. Trabalhador São-carlense, 400, CEP 13566-590, São Carlos, SP, Brazil. E-mail: cavalheiro@iqsc.usp.br; Fax: +55 16 33738054; Tel: +55 16 33738054
First published on 20th December 2019
Abstract
A screen-printed electrode (SPGPUE) was prepared with graphite–polyurethane composite ink containing gold nanoparticles (AuNPs), resulting in a screen-printed graphite–polyurethane composite electrode modified with gold nanoparticles (SPGPUE–AuNPs). Gold nanoparticles were prepared by the citrate method and extracted from the water medium since polyurethane is not compatible with humidity. After extraction to chloroform, they were characterized via transmission electron microscopy (TEM). The presence of gold on the SPGPUE–AuNP surface was confirmed via SEM and EDX analyses, while thermogravimetry revealed the presence of approximately 3.0% (m/m) gold in the composite. An electrochemical pretreatment in 0.10 mol L−1 phosphate buffer (pH 7.0) with successive cycling between −1.0 V and 1.0 V (vs. pseudo-Ag/AgCl) under a scan rate of 200 mV s−1 and 150 cycles was required in order to provide a suitable electrochemical response for the voltammetric determination of dopamine. After the optimization of the parameters of differential pulse voltammetry (DPV), an analytical curve was obtained within a linear dynamic range of 0.40–60.0 μmol L−1 and detection limit (LOD) of 1.55 ×10⁻⁸ mol L−1 for dopamine at the SPGPUE–AuNP. A non-modified SPGPUE was used for comparison and a linear range was obtained between 2.0 and 10 μmol L−1 with an LOD of 2.94 × 10⁻⁷ mol L−1. During the dopamine determination in cerebrospinal synthetic fluid (CSF), recoveries between 89.3 and 103% were achieved. There were no significant interferences from ascorbic acid and uric acid, but some from epinephrine due to the structural similarity.
Introduction
Dopamine (3,4-dihydroxyphenethylamine, DA, Fig. 1) is classified as a catecholamine and phenethylamine organic compound. It acts as a neurotransmitter in the brain and as a hormone, conferring motivational salience. Inside the brain, dopamine acts on functions such as motor control, motivation, arousal, reinforcement and reward, as well as lactation, sexual gratification and nausea.1Several important diseases of the nervous system are associated with dysfunctions of the dopamine system, including bipolar disorder, restless leg syndrome, addiction, schizophrenia and Parkinson's disease.2
Various methods for DA determination are presented in the literature, including capillary electrophoresis,3,4 chemiluminescence,5,6 electrochemiluminescence,7 fluorescence,8,9 colorimetry and fluorometry,10–12 and UHPLC-MS/MS.13,14 The electrochemical sensors present advantages in DA determination compared to these methods, such as the low cost of analyses, fast responses, low limits of detection among others.15–17 The electroanalytical techniques were also of high historical relevance in the understanding of neurochemistry using carbon ultramicroelectrodes in the determination of catecholamines in brain fluids.18
Screen-printed electrodes (SPEs) are electroanalytical sensing devices used in DA determination. SPEs present advantages, such as higher reliability, low cost, simplicity of use and the possibility of being disposable devices, minimizing contamination and surface renovation issues. In addition, they present robustness with the possibility of full automation in the manufacturing of a single device containing the working, reference and auxiliary electrodes all in the same support.19
The modification of the imprinting ink with other materials (such as polymers, enzymes, complexing agents, nanomaterials and metals) increases the selectivity and/or sensibility of the sensor for the development of electroanalytical methodologies in the determination of several analytes.20,21
Some examples of modified SPEs in DA determination include modifications with tyrosinase/chitosan/reduced graphene oxide,22 La3+/ZnO nanoflowers,23 graphene quantum dots,24 nanocomposites of N′-phenyl-p-phenylenediamine/multi-walled carbon nanotubes/Nafion25 and palladium nanoparticles decorated on activated fullerene.26
In literature, there are many reports using SPEs modified with metallic nanoparticles, including gold.27–32 About ten articles were found using AuNP as a modifier of screen-printed electrodes in the last five years. Most of them were used in the determination of metallic ions, such as arsenic,33 chromium(VI),34,35 lead(II),36–38 lead and copper simultaneously39,40 and mercury.41 Only one work concerning the use of SPE in the determination of an organic compound, in this case, for the anti-cancer drug nilutamide, was found. The device was prepared with a composite containing β-cyclodextrin, AuNP and graphene oxide.42
A graphite and polyurethane composite screen-printed electrode (SPGPUE) had been evaluated earlier by our group with satisfactory results in the determination of organic and inorganic analytes such as acetaminophen,43 epinephrine,19 the simultaneous determination of acetaminophen and caffeine,44 and the simultaneous determination of Zn(II), Pb(II), Cu(II), and Hg(II) in ethanol fuel using a SPGPUE modified with organofunctionalized SBA-15 silica.45
In this work, the use of a SPGPUE containing gold nanoparticles (AuNP) in the ink is presented as an electroanalytical sensor for the determination of dopamine in cerebrospinal synthetic fluid (CSF) for the first time. Dopamine was chosen as a probe to evaluate the performance of the SPGPUE–AuNPs due to its well-known voltammetric behavior and biological relevance.
Experimental
Reagents and solutions
All reagents used in this work were of analytical grade and used without further purification. All solutions were prepared using water purified in a Barnstead™ EasyPure® RoDi system (Thermoscientific, D13321, resistivity > 18 MΩ cm). Dopamine hydrochloride was purchased from Sigma-Aldrich. A 1.0 × 10⁻³ mol L−1 dopamine stock solution was prepared daily in 0.10 mol L−1 phosphate buffer (pH 7.0) and kept under light protection. Epinephrine hydrochloride (Sigma-Aldrich), uric acid (Sigma-Aldrich) and ascorbic acid (Synth) stock solutions were used in the interference studies.Apparatus
Transmission electron microscopy (TEM) images were obtained in a JEM-2100-JEOL microscope. The AuNP morphology was observed by a JEM-2100 transmission electron microscope (JEOL) with an electron beam of 200 kV. The particles were suspended in isopropanol and sonicated for 30 min before coating a copper grid (200 mesh, Electron Microscopy Sciences) covered with carbon thin film. The grids were dried in vacuum for 5 h at 40 °C.Energy-dispersive X-ray spectroscopy (EDX) measurements were performed in a LEO (440, 63 kV resolution) microscope after carbon deposition.
Scanning electron microscopy (SEM) images were carried out in a Philips XL-30 FEG coupled to EDS and EBSD accessories with a 20 kV electron beam. All measurements were carried out at room temperature.
Ultraviolet spectra were obtained in a UV-Vis spectrophotometer UV-2550, from Shimadzu in water and chloroform using quartz cuvettes with a 1 cm optical path, and a spectral range of 300–800 nm.
Voltammetric measurements were carried out in an Autolab PGSTAT-30 potentiostat/galvanostat (Eco Chemie). An Autolab PGSTAT 204 potentiostat/galvanostat equipped with an FRA32 module was used for electrochemical impedance spectroscopy (EIS) measurements. Both were coupled to microcomputers and controlled by NOVA 2.1 software.
Preparation of cerebrospinal synthetic fluid (CSF)
For the determination of dopamine, a solution of the cerebrospinal synthetic fluid (CSF) was prepared according to Oser46 and Zhang et al.47 by dissolving NaCl (2.10 g), CaCl2 (0.08 g), KCl (0.07 g), NaHCO3 (0.40 g), glucose (0.20 g) and urea (0.002 g) up to a final volume of 250.0 mL with water. This solution was spiked with dopamine and the pH was adjusted to 7.4. The solution was used just after preparation to avoid the hydrolysis of urea.Gold nanoparticles (AuNP) synthesis and graphite modification
The gold nanoparticles (AuNP) were prepared according to the Turkevich citrate reduction method.48 Briefly, 20.0 mL of 1.0 mmol L−1 HAuCl4 was heated to boiling and maintained under vigorous stirring. Then, 2.0 mL of sodium citrate 1.0% (m/v) was slowly added. The mixture was upheld to boiling until it reached a dark red color. In sequence, the resulting solution was rapidly cooled in an ice bath and kept protected from light.Finally, the aqueous suspension of AuNPs was extracted to an organic phase using equal volumes of aqueous AuNPs and chloroform. This is fundamental once the PU-resin curing is affected by water, which is when the isocyanate reacts with water to form a urea linkage and carbon dioxide gas49; thus, a water-free modifier is required. For this, 5.0 mg of dioctadecyl dimethyl ammonium bromide was added to the reaction medium for each 2.5 mL of the AuNP aqueous suspension. The resulting mixture was kept under vigorous stirring until total phase-transferring of AuNP to the organic phase, separated with a Squibb funnel and stored at 4 °C under light protection as well.
Next, the resulting AuNPs were used for the modification of graphite powder (<20 μm, from Sigma-Aldrich). For this, 0.30 g of graphite was added to an adequate volume of organic AuNP suspension in order to obtain a modification of 2.5% (m/m) and sonicated under 50 °C until complete chloroform evaporation. Finally, the resulting AuNP-modified graphite powder was washed 5 times with ethanol to remove any remaining surfactant.
Preparation of the SPGPUE–AuNP modified electrode
The SPGPUE was prepared according to a procedure adapted from Saciloto et al.50 In this case, the SPGPUE was prepared using a modified graphite–polyurethane-based conductive ink made with the AuNP-modified graphite powder. The polyurethane (PU) resin was prepared by the mixture of 1.1 parts of methylene diphenyl isocyanate (MDI) and 0.8 parts of castor oil.Briefly, the manufacturing process of the screen-printed electrode consists essentially of forcing the ink, composed of a mixture of the graphite polyurethane composite (GPU) modified with AuNP 2.5% (m/m) and chloroform solvent, to pass through a mask to be deposited on a 0.3 mm thick PVC plate.
Finally, the set of imprints that made up the printed electrode was partly covered by a layer of polyurethane resin itself, and used as insulation to define the areas of electrical contacts at one end. At the other end, there was another uncoated area that defined the active areas and allowed the electrodes to be exposed. On one of the imprints, it was staked with a strip of silver epoxy (Conductive Silver Epoxy Kit, Electron Microscopy Sciences) to serve as a pseudo-reference Ag/AgCl electrode.50
The working electrode surfaces were electrochemically treated before use by cyclic voltammetry (CV) from −1.0 V to 1.0 V (vs. pseudo-Ag/AgCl) at 200 mV s−1 in 0.10 mol L−1 phosphate buffer (pH 7.0) for 150 scans since the mechanical polishing was not suitable for this kind of electrode.
Chronocoulometry and electrochemical impedance spectroscopy (EIS)
The electroactive areas of the SPGPUE and SPGPUE–AuNP were evaluated by chronocoulometry using an integrated form of Cotrell's equation (eqn (1))51 in a 5.0 μmol cm−3 K3[Fe(CN)6] solution in 0.50 mol L−1 KCl.
 | (1) |
The EIS measurements were performed using a 1.0 mmol L−1 K3[Fe(CN)6] in 0.5 mol L−1 KCl solution, under a constant DC potential of 0.19 V in a frequency range from 1.0 × 10⁶ to 100 Hz and 10.0 mV amplitude for both.
The SPGPUE and SPGPUE–AuNP 2.5% (m/m) were used as working electrodes. All measurements were performed at room temperature.
SPGPUE–AuNP thermal behavior
Simultaneous TG/DTG and DTA analyses were carried out in α-alumina sample holders in simultaneous SDT Q600 modulus controlled by the Thermal Advantage Q-Series (v. 5.5.24 software, both from TA Instruments). The experimental parameters for the TG curves were: sample mass of ca. 3.0 mg (±0.1 μg), heating rate of 10 °C min−1 under dynamic nitrogen atmosphere flowing at 50 mL min−1 from room to 600 °C temperature, change for dry air flowing at 50 mL min−1 from 600 °C to 1000 °C. The apparatus was calibrated for temperature with a zinc standard as recommended by the manufacturer's instructions.Results and discussion
Gold nanoparticle (AuNP) characterization
First, the morphology of the synthetized AuNP suspended in chloroform was evaluated by transmission electron microscopy (TEM). The resulting micrographs (Fig. 2a–c) revealed a homogeneous distribution of spherical nanoparticles without agglomeration. The data treatment was made using the free software ImageJ, and a monomodal distribution of diameters between 8.5 and 18 nm was found. The nanoparticles presented an average diameter of 13 nm, according to its size distribution histogram (Fig. 2d).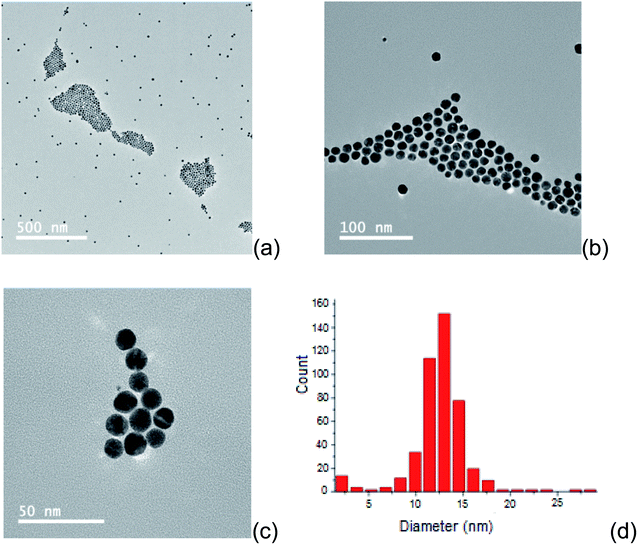 | ||
| Fig. 2 TEM images of the synthetized AuNP, with magnification 500 nm (a), 100 nm (b) and 50 nm (c). Histogram of size distribution of the synthetized AuNPs (d). | ||
Polyurethane is not compatible with water,49 which causes expansion during the curing of the polymer. Thus, it was necessary to extract these AuNPs from the water to another solvent. The effect of the phase transference from water to chloroform on the AuNP diameter was evaluated by UV-Vis spectrophotometry. It is known that the AuNP absorbance peak displaces to a higher wavelength as the nanoparticles agglomerate to larger diameters.52
Fig. 3 shows the absorption spectra of AuNP in water and chloroform. The small displacement of the absorbance peak, when compared to the two media (519 and 525 nm, respectively), indicates that no significant changes occurred in the AuNP size when transferring them from the aqueous to the organic phase. In addition, a more intense absorbance peak was observed for AuNP suspended in chloroform, indicating a higher AuNP concentration in the organic phase once lower volumes were used in the extraction procedure.
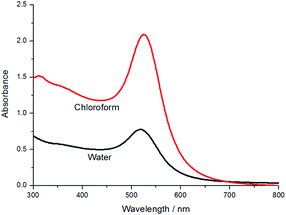 | ||
| Fig. 3 UV-Vis spectra of the synthetized AuNP in water and chloroform in the spectral range 300–800 nm using a quartz cuvette of 1 cm optical path. | ||
Graphite–AuNP characterization
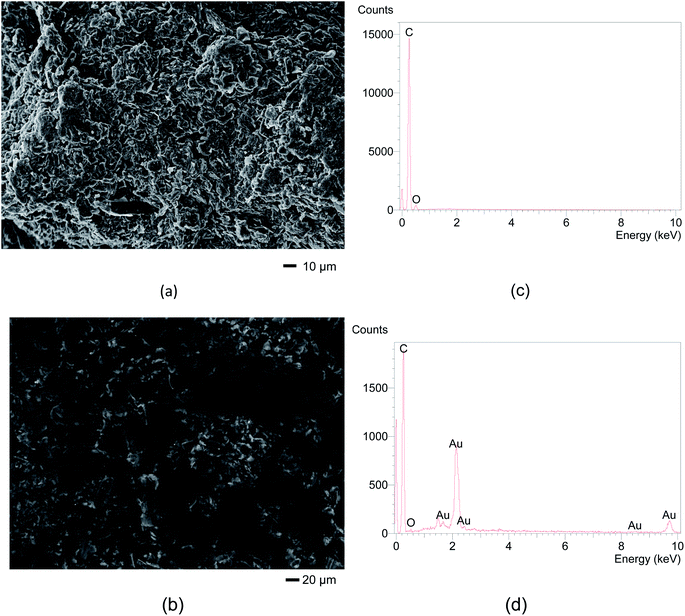
Sequentially, in order to confirm the modification of graphite with AuNP, scanning electron microscopy (SEM, without carbon coating) and X-ray dispersive energy spectroscopy (EDX) measurements were carried out. Initially, micrographs of the graphite-PU (60% graphite, m/m) and of the mixture graphite with 2.5% AuNP were obtained by SEM. Fig. 4a reveals a rough surface typical of the unpolished composite,53 while in Fig. 4c, the EDX spectra indicates the massive presence of carbon (86%) and oxygen (14%).In Fig. 4b, it is possible to observe the presence of small spots dispersed in the sample related to the presence of AuNP, as confirmed by EDX results. Fig. 4d depicts the EDX spectrum obtained for this same mixture with a percentage of 71% C, 2.3% O and 26% Au. The high content of carbon is due to the sample preparation procedure involving carbon deposition and graphite itself. Therefore, due to the presence of a relatively higher gold signal, it was inferred that the graphite modification with AuNP was successful.
Therefore, graphite–AuNPs were used to prepare the screen-printed composite electrodes (SPGPUE–AuNP). The surface of the resulting devices was also evaluated by SEM and EDX. Fig. 5a presents the SEM micrograph, revealing a uniform porous electrode surface. A small amount of AuNP can be seen, represented by the clear spots in the image (Fig. 4a). Although only 2.5% of the conductive phase in the GPU composite is represented by AuNP, it was possible to confirm its presence in the SPGPUE–AuNP concentrated in some regions. Despite the presence of higher amounts of gold in specific spots, these sites are homogeneously distributed after mixture of the conductive phase (modified AuNPs/graphite) after the addition of significantly viscous polyol and pre-polymer during the GPU preparation. The EDX Au mapping measurements (Fig. 5b) showed that the AuNPs were well dispersed throughout the entire SPE surface.
 | ||
| Fig. 5 (a) SEM micrographs obtained with 250× magnification. (b) EDX surface mapping of Au monitoring at 250× magnification. (c) EDX spectrum of the SPGPUE–AuNP 2.5%. | ||
Fig. 5c presents the EDX spectrum with percentages of 76% C, 4.3% O and 19% Au in the SPGPUE–AuNP 2.5% surface. Again, the high content of the carbon element is due to the sample preparation procedure involving carbon deposition and graphite itself. The gold content is relative to the region in which the EDX was taken.
SPGPUE–AuNP thermal behavior
Thermogravimetric curves of the graphite, graphite–PU composite and graphite–PU composite containing AuNPs are presented in Fig. 6. Quantitative data regarding temperature intervals, mass losses and residues are summarized in Table 1.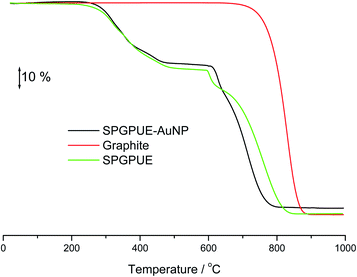 | ||
| Fig. 6 TG curves of the graphite, SPGPUE and SPGPUE–AuNP in dynamic nitrogen until 600 °C and dry air until 1000 °C atmospheres (50 mL min−1) at a heating rate of 10 °C min−1. | ||
| Temperature/°C | % Mass loss | Residue to 1000 °C | |
|---|---|---|---|
| Graphite | 20–600 | — | |
| 700–900 | 100 | ||
| 0 | |||
| SPGPUE | 20–600 | 31.84 | |
| 600–900 | 67.92 | ||
| 0.32 | |||
| SPGPUE–AuNP | 20–600 | 29.82 | |
| 600–900 | 67.27 | ||
| 2.9 |
As expected, graphite was stable under nitrogen atmosphere (room temperature up to 600 °C) and a massive mass loss occurred under air in a single event from 700 °C, without any residue at 1000 °C.
The TGA curves of the composite materials revealed two mass losses from room temperature up to ca. 600 °C. The first referent to the decomposition of the polymer, and a second one proportional to the graphite content, that appeared just after the atmosphere change. A residue of 2.9% was detected only in the curve of the AuNP-modified composite relating to the presence of gold.
SPGPUE–AuNP electrochemical characterization by chronocoulometry and EIS
First, the electroactive areas of the SPGPUE and SPGPUE-AuNP were evaluated by chronocoulometry using the integrated Cotrell's equation (eqn (1)). Values of 0.032 cm2 and 0.059 cm2 for SPGPUE and SPGPUE–AuNP were obtained, respectively.Apparently, the presence of Au nanoparticles makes the active area two times larger than that of the non-modified electrode since the AuNPs are dispersed throughout the conductive material, and also improves its conductivity as seen in the EIS experiments described below.
EIS measurements were carried out in order to verify the conductive behavior of the SPGPUE–AuNP surface in comparison to the SPGPUE surface. The resulting Nyquist plots are presented in Fig. 7.
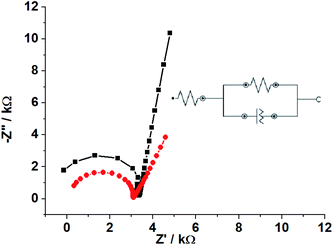 | ||
| Fig. 7 Nyquist plots obtained in EIS measurements for (■) SPGPUE and (●) SPGPUE-AuNP in a frequency range of 100 to 1 × 10⁶ Hz, and using 10.0 mV as the potential amplitude. | ||
Typical Randles circuit profiles for both SPGPUE and SPGPUE–AuNP were obtained: a charge transfer resistance (Rct) concerning the semicircles observed, a CPE (constant-phase element) related to the double-layer capacitance and surface roughness of the electrodes and the diffusional Warburg impedance represented by the linear portion in each Nyquist plot.54
The obtained semicircle diameter noticeably decreased after the addition of AuNP as an electrode modifier in comparison to the bare SPGPUE. Accordingly, the use of 2.5% AuNP in the SPGPUE modification significantly reduced the Rct of 4.12 kΩ (SPGPUE) to 2.99 kΩ (SPGPUE–AuNP), corresponding to 27%, and therefore increases the conductivity of the studied device. This is in agreement with the higher active area value and consequent higher conductivity.
Optimization of electrochemical parameters
After the SPGPUE–AuNP characterization, our preliminary studies regarding dopamine determinations showed the need of an electrochemical activation of the electrode surface in order to provide better electrochemical responses. One mechanical activation is not appropriate for such devices. Different electrolytes were evaluated for the electrochemical treatment of SPGPUE–AuNP, such as 0.10 mol L−1 phosphate buffer (pH 7.0); 0.10 mol L−1 sulfuric acid and 0.10 mol L−1 ammonium hydroxide (pH 10.9), with successive cycling under a scan rate of 200 mV s−1 from −1.0 V to 1.0 V (vs. pseudo-Ag/AgCl)43 for choosing the ideal number of cycles.Fig. 8 presents the behavior of the background current (ΔI) as a function of the number of cycles in different electrolytes at 0.0 V (vs. pseudo Ag/AgCl). Here, ΔI means the difference between the current taken at 0.0 V (vs. pseudo-Ag/AgCl) after a certain number of cycles in relation to the previous set of cycles (e.g., ΔI100 = I100 − I50).
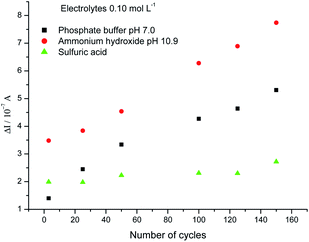 | ||
| Fig. 8 Evolution of ΔI as a function of the number of cycles at potential 0.0 V (vs. pseudo Ag/AgCl). | ||
It was observed that the highest ΔIs occurred in ammonium hydroxide. However, the electrode response was not stable even after 150 cycles. The current still grew at 0.0 V (vs. pseudo-Ag/AgCl) all along the number of cycles investigated here, as represented by the ΔI (red curve) in Fig. 8. This is in agreement with previous findings, in which gold oxides were found to be formed in a basic medium.55
Despite the stable response, the current increase was not significant under the same number of cycles in sulfuric acid, indicating that the Au-NPs were not affected by the acidic medium.
By its turn, phosphate buffer led to a stable response with a significant increase in ΔI after 120–150 cycles, with the advantage of a pH similar to the physiological one. This behavior suggests that a stable oxide/phosphate surface was reached, producing a stable electrode response. Thus, it was chosen for further studies and 150 cycles was established for electrode treatment.
Then, an optimization of the DPV parameters was carried out to guarantee better analytical responses in further dopamine quantifications with this electrode. DPV voltammograms (not presented) were obtained using 1.0 μmol L−1 dopamine solution in 0.10 mol L−1 phosphate buffer (pH 7.0) in the potential interval between −0.15 V and 0.30 V (vs. pseudo Ag/AgCl), as suggested in previous reports.56,57
The scan rate and pulse amplitude were optimized using a factorial planning 2n (n = number of variables studied) based on a multivariate calibration. The tested scan rates were 5 mV s−1 and 10 mV s−1, and the tested pulse amplitudes were 25 mV and 50 mV. The parameters chosen were 50 mV pulse amplitude and 5 mV s−1 scan rate, which presented a higher intensity of dopamine oxidation current with a well-defined voltammetric profile.
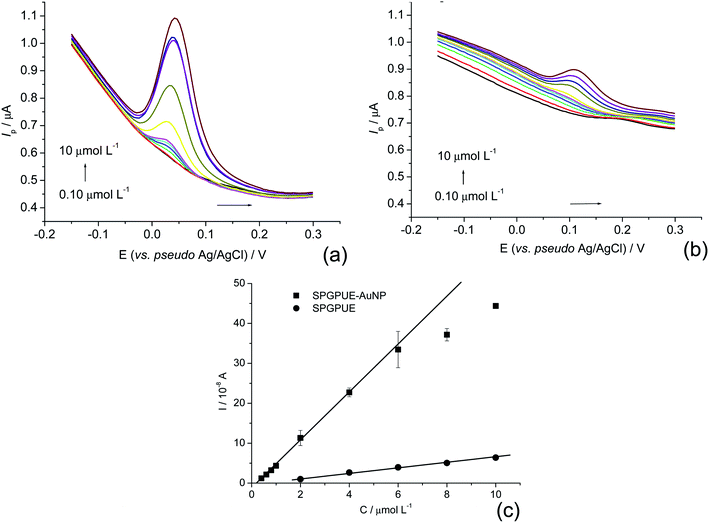
An oxidation peak for dopamine was observed in 0.05 V (vs. pseudo Ag/AgCl) at SPGPUE–AuNP and 0.10 V at SPGPUE. This peak is related to the oxidation of the OH groups.58
Analytical curve
After optimizing the DPV parameters, the analytical curves were obtained in different concentrations from 0.10 to 10.0 μmol L−1 in 0.10 mol L−1 phosphate buffer (pH 7.0) in triplicate at the SPGPUE–AuNP (Fig. 9a) and SPGPUE (Fig. 9b) for comparison with a = 50 mV and ν = 5 mV s−1.At SPGPUE–AuNP, a linear range between 0.40 and 6.0 μmol L−1 was observed (Fig. 9c) at n = 7 (R = 0.9981), obeying eqn (2) with an LOD of 1.55 × 10⁻⁸ mol L−1, calculated according to Winefordner et al.59
| Ip = −8.98 × 10⁻⁹ A + 0.179 × Cdop A mol−1 L | (2) |
At SPGPUE, a linear range was obtained between 2.0 and 10.0 μmol L−1 (Fig. 9c) at n = 5 (R = 0.9974), obeying eqn (3) with an LOD of 2.94 × 10⁻⁷ mol L−1.
| Ip = −4.73 × 10⁻⁹ A + 0.007 × Cdop A mol−1 L | (3) |
Despite the possibility of the electrodes being discarded after use, a single device could be used for at least two months, reducing production costs and minimizing environmental problems. Regarding repeatability, SPGPUE presented 9.8% (n = 15) in the 2.0–10 μmol L−1 range, while SPGPUE–AuNP presented 9.4% (n = 27) in the 0.40–10 μmol L−1 concentration range.
Determination of dopamine in cerebrospinal synthetic fluid (CSF) sample
Table 2 presents the results of the dopamine addition and recoveries in CSF in triplicate at SPGPUE–AuNP. Recoveries of 89–103% were found, suggesting that the electrode can be used as an electroanalytical sensor in the determination of dopamine in biologic samples.| Added/μmol L−1 | Found/μmol L−1 | Recovered/(%) |
|---|---|---|
| a n = 3; SD = standard deviation. | ||
| 1.00 | 1.03 ± 0.02 | 103 |
| 2.00 | 1.80 ± 0.03 | 90.0 |
| 3.00 | 2.68 ± 0.02 | 89.3 |
| 4.00 | 3.63 ± 0.04 | 90.9 |
| Average ± SD | 93 ± 6 | |
Interference tests
Substances usually present in biologic fluids, such as epinephrine (EP), ascorbic acid (AA) and uric acid (UA), were evaluated as potential interfering species regarding the dopamine electrochemical response at SPGPUE–AuNP with a fixed 2.0 10−6 mol L−1 dopamine concentration in the presence of varying concentrations of the interferents, as detailed in Table 3.| Interferent | C/μmol L−1 | Ip/μA | Interference/% | |
|---|---|---|---|---|
| IDA | IDA+interferent | |||
| Uric acid | 1.0 | 1.37 | 1.64 | + 19.9 |
| 2.0 | 1.49 | + 8.75 | ||
| 4.0 | 1.42 | + 3.28 | ||
![[thin space (1/6-em)]](https://www.rsc.org/images/entities/char_2009.gif) |
||||
| Ascorbic acid | 1.0 | 1.53 | 1.84 | + 19.9 |
| 2.0 | 1.86 | + 21.7 | ||
| 4.0 | 1.81 | + 18.0 | ||
![[thin space (1/6-em)]](https://www.rsc.org/images/entities/char_2009.gif) |
||||
| Epinephrine | 1.0 | 1.25 | 1.70 | + 36.4 |
| 2.0 | 1.84 | + 47.6 | ||
| 4.0 | 2.26 | + 80.6 | ||
No significant interferences from ascorbic acid and uric acid were observed. However, the interference of epinephrine was relatively large and probably due to its structural similarity with dopamine.
The use of the standard addition procedure was revealed to be effective for DA determination in synthetic biological fluid, and can be useful in overcoming the interferences.
No significant interferences from ascorbic acid and uric acid were observed. However, interference of epinephrine was relatively large, probably due to its structural similarity with dopamine.
The use of the standard addition procedure revealed to be effective for DA determination in synthetic biological fluid and can be useful in overcoming the interferences.
Although there are several electrodes available for dopamine determination, up to our knowledge, this is the first screen-printed device modified with gold nanoparticles used in dopamine analysis, despite Gupta and collaborators60 presenting a simultaneous analysis of dopamine and 5-hydroxyindoleacetic acid at nanogold-modified screen-printed carbon electrodes.
Performances of other screen-printed devices used in the determination of dopamine are presented in Table 4. Although similar results were described, it is possible to observe that the proposed system presented a slightly lower LOD. In addition, the proposed system possesses additional advantages regarding the use of less robust, relatively difficult modifications, expensive modifiers and/or non-environmentally friend procedures in the previously proposed electrodes and higher sensitivity regarding the non-modified SPGPUE.
| Electrode | Modifier | Linear range/μM | LOD/μM | Ref. |
|---|---|---|---|---|
| SPE | Tyrosinase/chitosan/reduced graphene oxide | 0.4–8 and 40–500 | 0.022 | 21 |
| SPE | La3+/ZnO nanoflower | 0.15–300.0 | 0.08 | 22 |
| SPE | Graphene quantum dots | 0.1–1000.0 | 0.05 | 23 |
| SPE | Nanocomposite of N′-phenyl-p-phenylenediamine/multi-walled carbon nanotubes/nafion | 1–110 | 0.01 | 24 |
| SPE | Palladium nanoparticles decorated on activated fullerene | 0.35–133.35 | 0.056 | 25 |
| SPGPUE | Non-modified | 0.294 | This work | |
| SPGPUE–AuNP | Modified with gold nanoparticles | 0.0155 | This work |
Conclusions
A new screen-printed electrochemical device was proposed based on a graphite polyurethane ink, in which the conductive phase contains AuNP mixed with graphite. The device presented a significant improvement in surface conductivity.The nanoparticles were successfully extracted with chloroform as water was not compatible with polyurethane.
The device was used in the determination of dopamine as a probe in synthetic cerebrospinal fluid without interference from the matrix. Ascorbic and uric acids presented relatively low interference, which was higher for epinephrine probably due to its structural similarity with the probe. Overall, it was found that the proposed device is an alternative screen-printed disposable system for the determination of substances with biological relevance.
Conflicts of interest
There are no conflicts to declare.Acknowledgements
The authors are indebted to the Brazilian agencies CNPq and FAPESP for the research grant (2017/04211-7) and PROCONTES/USP program.References
- J. M. Wenzel, N. A. Rauscher, J. F. Cheer and E. B. Oleson, ACS Chem. Neurosci., 2015, 6, 16–26 CrossRef CAS PubMed.
- N. D. Volkow, G. J. Wang, S. H. Kollins, T. L. Wigal, J. H. Newcorn, F. Telang, J. S. Fowler, W. Zhu, J. Logan, Y. Ma, K. Pradhan, C. Wong and J. M. Swanson, J. Am. Med. Assoc., 2009, 302, 1084–1091 CrossRef CAS PubMed.
- V. Solinova, L. Zakova, J. Jiracek and V. Kasicka, Anal. Chim. Acta, 2019, 1052, 170–178 CrossRef CAS PubMed.
- R. A. Saylor, E. A. Reid and S. M. Lunte, Electrophoresis, 2015, 36, 1912–1919 CrossRef CAS PubMed.
- Y. X. Lan, F. Yuan, T. H. Fereja, C. Wang, B. H. Lou, J. P. Li and G. B. Xu, Anal. Chem., 2019, 91, 2135–2139 CrossRef CAS PubMed.
- L. Zhang, Z. R. Tang and Y. P. Dong, Anal. Methods, 2018, 10, 4129–4135 RSC.
- H. P. Peng, P. Liu, W. H. Wu, W. Chen, X. Y. Meng, X. H. Lin and A. L. Liu, Anal. Chim. Acta, 2019, 1065, 21–28 CrossRef CAS PubMed.
- X. Wei, Z. D. Zhang and Z. H. Wang, Microchem. J., 2019, 145, 55–58 CrossRef CAS.
- H. Wang, G. Q. Fang, K. Wang, Z. Y. Wu and Q. Q. Yao, Anal. Lett., 2019, 52, 713–727 CrossRef CAS.
- J. Wang, R. Du, W. Liu, L. Yao, F. Ding, P. Zou, Y. Y. Wang, X. X. Wang, Q. B. Zhao and H. B. Rao, Sens. Actuators, B, 2019, 290, 125–132 CrossRef CAS.
- J. Chen, Y. C. Li, Y. N. Huang, H. J. Zhang, X. G. Chen and H. D. Qiu, Microchim. Acta, 2019, 186, 58 CrossRef PubMed.
- X. X. Liu, M. M. Tian, W. M. Gao and J. Z. Zhao, J. Anal. Methods Chem., 2019, 6540397 Search PubMed.
- N. Wei, X. E. Zhao, S. Y. Zhu, Y. R. He, L. F. Zheng, G. Chen, J. M. You, S. Liu and Z. Q. Liu, Talanta, 2016, 161, 253–264 CrossRef CAS PubMed.
- H. H. Lu, J. Yu, J. Wang, L. L. Wu, H. Xiao and R. Gao, J. Pharm. Biomed. Anal., 2016, 122, 42–51 CrossRef CAS PubMed.
- Q. He, J. Liu, X. Liu, G. Liu, D. Chen, P. Deng and J. Liang, Electrochim. Acta, 2019, 296, 683–692 CrossRef CAS.
- Q. He, J. Liu, X. Liu, G. Liu, P. Deng and J. Liang, Sensors, 2018, 18, 199 CrossRef PubMed.
- Q. He, J. Liu, X. Liu, G. Liu, D. Chen, P. Deng and J. Liang, Nanomaterials, 2018, 8, 194 CrossRef PubMed.
- R. N. Adams, Anal. Chem., 1976, 48, 1126A–1138A, DOI:10.1021/ac50008a001.
- I. A. R. B. Dias, T. R. Saciloto, P. Cervini and E. T. G. Cavalheiro, J. Anal. Bioanal. Tech., 2017, 8, 1, DOI:10.4172/2155-9872.1000350.
- M. A. Alonso-Lomillo, O. Domínguez-Renedo and M. J. Arcos-Martínez, Talanta, 2010, 82, 1629–1636 CrossRef CAS PubMed.
- R. C. Barry, Y. Lin, J. Wang, G. Liu and C. A. Timchalk, J. Exposure Sci. Environ. Epidemiol., 2009, 19, 1–18 CrossRef CAS PubMed.
- C. Y. Liu, Y. C. Chou, J. H. Tsai, T. M. Huang, J. Z. Chen and Y. C. Yeh, Appl. Sci., 2019, 9, 622, DOI:10.3390/app9040622.
- S. Tajik, H. Beitollahi and M. R. Aflatoonian, J. Electrochem. Sci. Eng., 2019, 9, 187–195 CrossRef.
- H. Beitollahi, Z. Dourandish, M. R. Ganjali and S. Shakeri, Ionics, 2018, 24, 4023–4031 CrossRef CAS.
- M. Singh, I. Tiwari, C. W. Foster and C. E. Banks, Mater. Res. Bull., 2018, 101, 253–263 CrossRef CAS.
- S. Palanisamy, B. Thirumalraj, S. M. Chen, M. A. Ali and F. M. A. AlHemaid, J. Colloid Interface Sci., 2015, 448, 251–256 CrossRef CAS PubMed.
- N. Jeromiyas, E. Elaiyappillai, A. S. Kumar, S. T. Huang and V. Mani, J. Taiwan Inst. Chem. Eng., 2019, 95, 466–474 CrossRef CAS.
- S. B. Patri, P. S. Adarakatti and P. Malingappa, Curr. Anal. Chem., 2019, 15, 56–65 CrossRef CAS.
- S. M. Chen, S. Manavalan, U. Rajaji, M. Govindasamy, T. W. Chen, M. A. Ali, A. K. Alnakhli, F. M. A. Al-Hemaid and M. S. Elshikh, Microchim. Acta, 2018, 185, 520, DOI:10.1007/s00604-018-3048-3.
- S. Jahani, Anal. Bioanal. Electrochem., 2018, 10, 739–750 CAS.
- M. G. Trachioti, J. Hrbac and M. I. Prodromidis, Sens. Actuators, B, 2018, 260, 1076–1083 CrossRef CAS.
- A. Economou, Sensors, 2018, 18, 1032, DOI:10.3390/s18041032.
- M. G. Trachioti, A. E. Karantzalis, J. Hrbac and M. I. Prodromidis, Sens. Actuators, B, 2019, 281, 273–280 CrossRef CAS.
- J. W. Tu, Y. Gan, T. Liang, H. Wan and P. Wang, Sens. Actuators, B, 2018, 272, 582–588 CrossRef CAS.
- S. A. Tukur, N. A. Yusof and R. Hajian, J. Chem. Sci., 2015, 127, 1075–1081 CrossRef CAS.
- J. P. Jasmin, F. Miserque, E. Dumas, I. Vickridge, J. J. Ganem, C. Cannizzo and A. Chausse, Appl. Surf. Sci., 2017, 397, 159–166 CrossRef CAS.
- S. A. B. Shoub, N. A. Yusof and R. Hajian, Sens. Mater., 2017, 29, 555–565 CAS.
- S. A. Tukur, N. A. Yusof and R. Hajian, IEEE Sens. J., 2015, 15, 2780–2784 CAS.
- P. Kanyong, S. Rawlinson and J. Davis, Microchim. Acta, 2016, 183, 2361–2368 CrossRef CAS.
- H. Wan, Q. Y. Sun, H. B. Li, F. Sun, N. Hu and P. Wang, Sens. Actuators, B, 2015, 209, 336–342 CrossRef CAS.
- I. T. Some, A. K. Sakira, D. Mertens, S. N. Ronkart and J. M. Kauffmann, Talanta, 2016, 152, 335–340 CrossRef CAS PubMed.
- R. Karthik, N. Karikalan, S. M. Chen, P. Gnanaprakasam and C. Karuppiah, Microchim. Acta, 2017, 184, 507–514 CrossRef CAS.
- T. R. Saciloto, P. Cervini and E. T. G. Cavalheiro, Anal. Lett., 2013, 46, 312–322 CrossRef.
- T. R. Saciloto, P. Cervini and E. T. G. Cavalheiro, J. Braz. Chem. Soc., 2013, 24, 1461–1468 CAS.
- T. R. Saciloto, P. Cervini and E. T. G. Cavalheiro, Electroanalytical, 2014, 26, 1–14 CrossRef.
- B. L. Oser, Hawk's Physiological Chemistry, TATA McGraw-Hill, New Delhi, 1952, p. 1054 Search PubMed.
- F. Zhang, L. Yang, B. Shuping, J. Liu, F. Liu, X. Wang, X. Yang, N. Gan, T. Yu, J. Hu, H. Li and T. Yang, J. Inorg. Biochem., 2001, 87, 105–115 CrossRef CAS PubMed.
- J. Turkevich, P. C. Stevenson and J. Hillier, Discuss. Faraday Soc., 1951, 55, 55–75 RSC.
- P. K. Bruins, Polyurethane technology, New York, Interscience, 1969, p. 289p Search PubMed.
- T. R. Saciloto, P. Cervini, S. Claro-Neto, and E. T. G. Cavalheiro, Tinta e processo para preparação de eletrodos impressos descartáveis à base de um compósito de grafite e poliuretana e eletrodo obtido pelo referido processo, 2011, INPI 018110042428.
- A. J. Bard and L. R. Faulkner, Electrochemical Methods: Fundamentals and Applications, Wiley, New York, 1980 Search PubMed.
- H. N. Verma, P. Singh and R. M. Chavan, Vet. World, 2014, 7, 72–77 CrossRef CAS.
- C. M. F. Calixto, R. K. Mendes, A. C. de Oliveira, L. A. Ramos, P. Cervini and E. T. G. Cavalheiro, Mater. Res., 2007, 10, 109–114 CrossRef CAS.
- E. Barsoukov and J. R. Macdonald, Impedance Spectroscopy: Theory, Experiment, and Applications, John Wiley & Sons, Hoboken, New Jersey, 2005 Search PubMed.
- I. A. Mattioli, M. Baccarin, P. Cervini and E. T. G. Cavalheiro, J. Electroanal. Chem., 2019, 835, 212–219 CrossRef CAS.
- N. Nasirizadeh, Z. Shekari, H. R. Zare, S. A. Y. Ardakani and H. Ahmare, J. Braz. Chem. Soc., 2013, 24, 1846–1856 Search PubMed.
- B. Fang, G. Wang, W. Zhang, M. Li and X. Kan, Electroanalysis, 2005, 17, 744–748 CrossRef CAS.
- M. Baccarin, S. J. Rowley-Neale, E. T. G. Cavalheiro, G. C. Smith and C. E. Banks, Microchim. Acta, 2019, 186, DOI:10.1007/s00604-019-3315-y.
- G. L. Long and J. D. Winefordner, Anal. Chem., 1983, 55, 713–714 CrossRef.
- P. Gupta, R. N. Goyal and Y. B. Shim, Sens. Actuators, B, 2015, 213, 72–81 CrossRef CAS.
| This journal is © The Royal Society of Chemistry 2019 |


