Parametric sensitivity in the Sabatier reaction over Ru/Al2O3 – theoretical determination of the minimal requirements for reactor activation†
Emanuele
Moioli
 *ab,
Noris
Gallandat
 ab and
Andreas
Züttel
ab
aLaboratory of Materials for Renewable Energy (LMER), Institute of Chemical Sciences and Engineering (ISIC), Basic Science Faculty (SB), École Polytechnique Fédérale de Lausanne (EPFL) Valais/Wallis, Energypolis, Sion, Switzerland. E-mail: emanuele.moioli@epfl.ch
bEmpa Materials Science & Technology, Dübendorf, Switzerland
First published on 6th November 2018
Abstract
The methanation of carbon dioxide is an option for chemical storage of renewable energy together with greenhouse gas reutilization because it offers a product with a high energy density. The reaction CO2 + 4H2 ↔ CH4 + 2H2O is performed on a Ru/Al2O3 catalyst and is strongly exothermal. For this reason, the reactor design must take into account an efficient thermal management system to limit the maximal temperature and guarantee high CO2 conversion. Additionally, the methanation reactor is subject to parameter sensitivity. This phenomenon can generate instability in the operation of a power to gas plant, due to the variability in the hydrogen production rate. Here we present a parametric study of the thermal properties of the reaction and determine the minimal feed temperature for the normal operation of a reactor. The minimal temperature required is determined by several parameters, such as pressure, space velocity and properties of the cooling system. For adiabatic reactors, the required feed temperature is 210 °C for a space velocity of 3000 h−1 and a pressure of 10 bar. The space velocity strongly affects the positioning of the ignition point, causing a large variability of the feed temperature required. At the same time, the optimal working point of the reactor is at the minimal activation temperature. The properties of cooled reactors are elucidated, showing how the interrelationship between cooling and feed temperature makes the management of this class of reactors more challenging. On the base of the modelling results, we propose a reactor configuration that adjusts the thermodynamic limitations and respects the minimal requirements for reaction ignition, allowing a more stable operation and avoiding the functioning at excessive temperature.
1. Introduction
The stochastic nature of wind and solar energy is a major challenge in the development of these renewable energy resources. Following the Energy Roadmap 21, released by the European Commission in 2011,1 the share of electricity produced by wind and solar power has reached a high level.2,3 Nevertheless, a further increase of energy production from these resources has to be accompanied by measures to reduce the impact of the intermittent supply on the grid stability. In order to find a solution to this problem, efficient daily and seasonal energy storage must be designed. The daily energy storage can be mostly accomplished by the use of batteries, but their massive use on large time scales is not sustainable in terms of energy density and cost. Seasonal storage must thus be performed by different systems.4–8 In this framework, the production of synthetic natural gas (SNG) has attracted a special interest in the so-called power-to-gas (PtG) technology. The production of synthetic natural gas from excess energy presents two main advantages: on the one hand, it allows the local use of energy to produce an energy carrier (in this case methane) and, on the other hand, it recovers CO2 from the atmosphere to produce a natural gas with zero carbon footprint. Furthermore, the production of SNG is advantageous compared to pure H2 production because the resulting gas can be directly injected into the natural gas grid.9–11 The PtG technology is already being applied in several demonstrators12,13 and pilot plants.14–16 Many new installations are under construction.17Methane is produced via the Sabatier reaction:
| CO2 + 4H2 ↔ CH4 + 2H2O |
| ΔH0R(298 K) = −165 kJ mol−1 |
| ΔG0R(298 K) = −113 kJ mol−1 |
The reaction is exothermal, which shifts the equilibrium towards the reactants when the temperature is increased. Although the reaction is thermodynamically favourable at low temperature, a proper reactor design is required to achieve high yields of methane. Several catalytic systems have been investigated in the literature for the Sabatier reaction, resulting in the proposal of different process configurations. In general, many metals of groups 8–10 have been found to be active for the methanation reaction.18 Ru, Ni, Co, Fe and Mo are considered the most important catalysts for CO2 conversion into methane.19,66 Molybdenum has the lowest activity in the reaction, while iron shows a high activity in CO2 conversion, but a low selectivity towards methane.20–22 Nickel and cobalt have a similar activity in the reaction, higher than iron and molybdenum.23,24,66 Ruthenium is the most active catalyst, especially at low temperature.19,25 Among the mentioned catalysts, nickel is applied in most of the commercial systems, following economic considerations. In fact, Ru proves to be about 120 times more expensive than Ni.26 However, the Ni-based systems show a lower activity in the CO2 hydrogenation, requiring the use of complex reactors to achieve high conversions.23 This is a major limitation for PtG applications, since the SNG produced in simple small-scale reactors with Ni-based catalysts can respect the limit values for the natural gas grid in terms of H2 content only with the use of complex systems.27 Furthermore, the requirement of a higher operation temperature in the case of Ni causes undesired deactivation effects, such as sintering.28–30 Also, the operation at higher temperature causes higher energy consumption and a more complicated system integration. For all these reasons, a Ru-based catalyst is considered the only possible solution for efficient PtG process intensification, without the need for further gas treatment before injection into the distribution network.
In order to bring the technology to full maturity, the rational design of the methanation reactor is a fundamental step. Determination of the influence of the most important physical parameters (e.g. temperature, pressure and GHSV) is crucial for the design and operation of a PtG system and a systematic understanding of the thermodynamics and kinetics of the reaction can address the right set of parameters to apply according to the requirement of the system studied. Furthermore, the reactor must be operated safely and in a stable way. The intrinsic intermittence in the hydrogen supply due to the stochastic energy production gives major challenges in keeping the reactor stable over the frequent modifications in the gas load. For this reason, the reactor may encounter problems of parametric sensitivity, leading to the thermal deactivation of the reactor itself. Even though the theme of parametric sensitivity has been widely investigated by chemical engineers,31 no systematic investigation of these phenomena is present in literature concerning the Sabatier reaction.
A key element to determine these influences is an accurate and reliable kinetic model. With this aim, several kinetic models can be found in the literature.32–43 Unfortunately, most of these models do not provide useful information for industrial applications since they refer to dilute conditions or do not account for thermodynamic limitations. The only model suitable for the modelling of commercial systems was developed in 1973 by Lunde and Kester.33 The rate law proposed has the following formula:
 | (1) |
The authors in ref. 33 developed the kinetic model for atmospheric pressure and differential conditions, but the model was found to be suitable also to describe other experimental conditions. Recently, Falbo et al.44 extended the application of the kinetic model to industrially relevant conditions, validating the kinetic model in a wide range of CO2 conversions.
Several authors designed reactive systems for the production of SNG from CO2. A classical solution to perform the Sabatier reaction is the use of several adiabatic stages with intermediate cooling. De Saint Jean et al.45,46 presented a system composed of four adiabatic steps with intermediate cooling and a condensation step. Schaaf et al.47 analysed the Sabatier reaction in two different systems, one consisting of two reactors with intermediate condensation and one composed of six reactors combined with four gas intercooling units. The combination of adiabatic and cooled reactors is also object of many studies. Kiewidt et al.48 showed the optimization potential of the direct adjustment of the axial temperature profile using the Semenov number. Anyhow, as stated in ref. 44, the results of this study may be controversial due to the extrapolation of kinetic parameters. El Sibai et al.49 concluded that an optimal reactor in terms of space–time yield can be designed by use of two polytropic fixed bed reactors with intermediate condensation steps. Finally, an experimental study of our research group50 showed that high methane yield can be achieved by using a cooled reactor with an appropriate pre-heating section. However, none of these studies took into consideration the parametric sensitivity of the methanation reactor while designing the optimal reaction pathway. For this reason, this study wants to integrate the existing literature on the topic, focusing in particular on the stability of the operation of the selected reactor network.
Recently, several works focused on the unsteady-state operation of the Sabatier reaction. Matthischke et al.51 reviewed the effect of recirculation on the unsteady-state reactor operation and numerically showed the existence of an optimal recycle ratio for the optimisation of the reactor operation and output.52 Sun et al.53,54 published two studies focused on the dynamics and activation of the reactor in several conditions. Using a 1D pseudo-homogenous reactor model, the authors stated the existence of a bistability region of ignition and extinction of the reaction due to the strong exothermicity of the process.53 Furthermore, the presence of propagating fronts generated by a stepwise increase of the inlet temperature was demonstrated. In another study from the same group, the heat removal and catalyst deactivation phenomena were discussed, describing the optimal operating conditions in a dynamic way.54 Bremer et al.55 presented an optimization study considering the start-up behaviour of the CO2 methanation reactor, performed controlling the cooling temperature of the reactor. The possibility of controlling the reactor under unsteady state conditions was assessed on the basis of a 2D reactor model. However, the existence of multiple working points must be acknowledged in these conditions.56 In a study from Try et al.57 the wrong-way behaviour of the Sabatier reactor was elucidated by investigating steps of the inlet temperature (up to ±20 K).
On the basis of the model derived in ref. 44, we decided to simulate the performance of a methanation reactor in a large set of parameters, focusing in particular on the limits of operation of the reactor. This study aims to represent a roadmap for the reactor design, defining the main elements necessary for the operation of the methanation reaction and drawing the guidelines to achieve high conversion and good heat integration. As a first step, the adiabatic operation of the reactor is simulated, defining the minimal requirements for the operation of the equipment in terms of pressure, temperature and GHSV. These results allow the determination of the performance of an adiabatic stage in terms of conversion and hotspot temperature. On the basis of these results, the operation of a cooled fixed bed reactor is simulated. In this case, the limits of operation of the reactor are dependent also on the cooling parameters, such as the temperature of the cooling fluid. Since the methanation reaction is fast and strongly exothermic, limitation of the hotspot by means of cooling is not possible. For this reason, the last section of the paper is dedicated to the development of a special reactor configuration, which combines thermodynamic and kinetic effects in order to limit the extent of the hotspot by means of an appropriate dosing strategy of the reactants.
2. Modelling section
2.1. Thermodynamics
In order to fully define the thermodynamics of the reaction system, two reactions involving 5 species (CO2, CO, CH4, H2, H2O) must be considered. For our analysis, the reactions investigated for the thermodynamic analysis are the Sabatier (eqn (2)) and the reverse water-gas shift (eqn (3)) reaction:| CO2 + 4H2 ↔ CH4 + 2H2O | (2) |
| CO2 + H2 ↔ CO + H2O | (3) |
A complete model of each reaction is based on the Gibbs free energy of the reaction:
ΔGR(T) = ΔHR − TΔSR = −RT![[thin space (1/6-em)]](https://www.rsc.org/images/entities/char_2009.gif) ln ln![[thin space (1/6-em)]](https://www.rsc.org/images/entities/char_2009.gif) K K | (4) |
The equilibrium partial pressures for both reactions k are calculated from the equilibrium constant equation:
 | (5) |
The system of two equilibrium eqn (5) is solved with the extent of reaction method. The partial pressures at equilibrium are calculated from the initial conditions as:
 | (6) |
λ k is the extent of each reaction. The resolution of the equilibrium system as a function of temperature gives the two values λk and consequently the equilibrium concentration of each component.
2.2. Kinetics
This paper describes the behaviour of a reactor operating the Sabatier reaction on Ru/Al2O3. As mentioned in the introduction, the kinetic model in the literature that best describes industrially relevant conditions for the reaction was published by Lunde et al.33 (eqn (1)). Falbo et al.44 used the rate expression to determine the kinetic parameters valid for pressure between 1–7 bar and temperature between 250 and 410 °C. Since these values are in line with the conditions to be investigated in this study, we used these parameters for our calculations. The parameters of the kinetic model are reported in Table 1. Considering that for these inlet conditions the reaction proceeds without any significant formation of by-products, the process is modelled using a single reaction. This assumption was also verified experimentally in our previous study.50 For this reason, only CO2 conversion is used as a parameter to describe the reactor performance. CO2 conversion is defined as: | (7) |
2.3. Model of the fixed bed reactor
The reactor is modelled with a one-dimensional heterogeneous PFR reactor model. According to the study by Schlereth et al.,58 this model has a sufficient accuracy to describe the behaviour of a methanation reactor in normal conditions. The results of ref. 58, obtained for reactive systems based on Ni catalysts, are valid also for the Ru-based catalyst, since the choice of the catalyst does not modify the general heat management of the reactor and the influence of transport phenomena.The reactor is modelled with the canonic mass and energy balances.59 The heterogeneous model considers the interfacial and intra-phase heat and mass transfer. For the computation of the intra-phase mass transfer limitations, the effectiveness factor model is used.60 The model equations for the fluid phase are:
 | (8) |
 | (9) |
The balance equations for the solid are:
| kgav(cib − cis) = υiηρbrA | (10) |
| kfav(Ts − T) = ηρb(−ΔH)rA | (11) |
 | (12) |
The superficial velocity of the gas phase was calculated by the continuity equation (eqn (13)):
 | (13) |
The effectiveness factor is calculated as:
 | (14) |
This is the formula for the effectiveness factor in a spherical pellet.59
The Thiele modulus is used in its generalized form:
The boundary conditions are:
| ci = ci0 | (15) |
| T = T0 | (16) |
At z = 0.
The wall temperature is considered constant to avoid the effects of coolant properties (flow rate and heat capacity) on the results. This assumption is justified by considering a high flow rate of the coolant, so that the wall temperature can be considered constant. No heat loss to the environment is considered, because the reactor is assumed as externally insulated.
The pressure drop along the axial coordinate of the reactor is neglected and the partial pressures of the components are computed using the ideal gas equation.
U A is the overall effective heat transfer coefficient, calculated with the analogy of a series of resistances. In our case, the considered resistances are the effective heat transfer coefficient for the tube insight, the corresponding coefficient for the tube outside and the conductivity of the tube wall. The resulting formula is:
 | (17) |
The values of k are calculated according to de Wasch and Froment.61 In the case of packed beds, the effective heat transfer coefficient can be divided into a stagnant and a dynamic contribution.62,63 The k value is calculated as:
 | (18) |
The thermal properties of the gases are approximated by polynomials according to the VDI-Wärmeatlas. Heat and mass transfer coefficients for the particle-to-fluid transfer are approximated by Wakao's correlation.64
| Sh = 2 + 1.1Sc1/3Re0.6 | (19) |
| Nu = 2 + 1.1 Pr1/3Re0.6 | (20) |
The simplifications of the model are:
• Neglection of CO formation: CO is thermodynamically not favourable at the outlet temperature and the CO formed in the hotspot further reacts to methane during the cooling phase;
• Constant coolant temperature: the variation in wall temperature is kept low by a high cooling flow rate;
• Neglection of the momentum balance: the pressure drop in the reactor calculated by Ergun's equation is limited;
• 1D model: the suitability of a one-dimensional model, i.e., absence of radial gradients, was proven in literature for comparable conditions.58,65
2.4. Computational methods
The system of differential eqn (8) and (9) is reduced to one mass balance and one heat balance by substitution of the concentration of the various components (CO2, H2, CH4, H2O) with CO2 conversion (eqn (7)). The resulting equations constitute a DAE system together with the eqn (10) and (11) with initial conditions (14) and (15). The DAE system is integrated numerically over the axial reactor coordinate using the Matlab ode23t solver.3. Results and discussion
3.1. Thermodynamics
The thermodynamic equilibrium conversion is calculated on the base of the thermodynamic model developed in section 2.1. The values of λ are calculated for a specific temperature and pressure by numerical resolution of the system of eqn (7). On the base of the λk values calculated and on eqn (2), the equilibrium conversion for a stoichiometric gas mixture (i.e. with composition H2/CO2 = 4/1) is determined at different temperature and pressure. The results are shown in Fig. 1a. The presence of CO is negligible for temperature below 600 °C. The global equilibrium in this region corresponds to the equilibrium of the single Sabatier reaction. At temperature above 600 °C, the equilibrium is influenced by the reverse water-gas shift reaction, causing the increase of the CO2 conversion. For this reason, when considering a reactor operating at temperature below 550–600 °C, neglecting the RWGS reaction generates a limited error in the calculations. Furthermore, if after the hotspot the gases are cooled to the final temperature, the CO produced in the hotspot is converted back to CO2 due to thermodynamic equilibrium.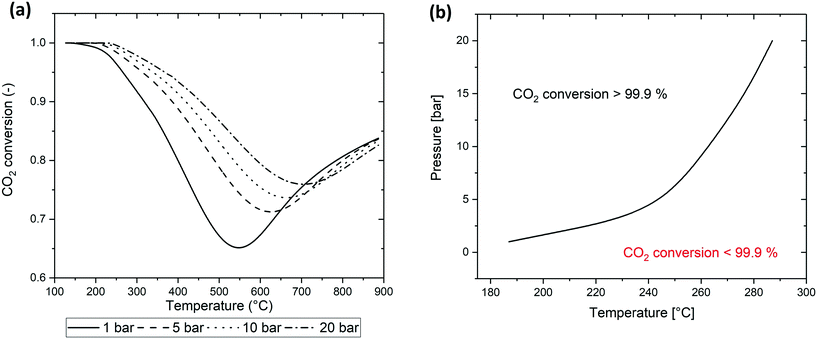 | ||
| Fig. 1 (a) CO2 conversion at thermodynamic equilibrium for a stoichiometric gas composition (H2/CO2 = 4/1), (b) maximal temperature for 100% conversion as a function of pressure. | ||
A fundamental item of information from the thermodynamic analysis is the maximal temperature for complete CO2 conversion. This value is strongly dependent on the pressure and completely dominates the reactor behaviour for high conversion. The value is found by imposing the value of λ corresponding to 99.90% CO2 conversion in eqn (6) and calculating by eqn (5) the maximal temperature that satisfies this requirement. The functional form of the result is:
 | (21) |
Fig. 1b describes the positioning of this point as a function of temperature and pressure. At 1 bar, the maximal temperature for 100% conversion is 180 °C. At this temperature, the reaction rate is slow, requiring extremely low GHSV in order to have the required residence time to complete the reaction. The increase of pressure causes a sharp increase in the 100% conversion value. The required temperature at 5 bar is 250 °C. Considering the Arrhenius dependence of the reaction rate, we can conclude that the increase of pressure from 1 to 5 bar allows the clear reduction of the residence time to complete the reaction. At higher pressure, the slope of increase in the maximal temperature is lower. For example, this value is 280 °C at 10 bar and 300 °C at 20 bar. On the basis of these considerations, it is possible to conclude that the optimal pressure to operate the reactor (from a balance of operative/compression costs and reactor performance) is between 5 and 10 bar.
3.2. Performance of the adiabatic reactor
CO2 methanation is an exothermal reaction and can be operated adiabatically. The course of the reaction causes an increase of temperature that initially increases the reaction rate (Arrhenius expression) but then decreases the reaction rate as soon as the values of temperature and conversion approach the thermodynamic limit. The reaction reaches the equilibrium at a value dependent on the reaction conditions (e.g. pressure and concentration of reactants). For this reason, the reaction goes into thermal runaway, as described by Schlereth et al.58 Nevertheless, even though the thermal runaway is hard to avoid, the phenomenon is limited by thermodynamic equilibrium without reaching the adiabatic temperature rise, calculated to be about 800 °C. Some special conditions are necessary for the initiation of the thermal runaway. In the case of the adiabatic reactor, it is relatively easy to determine the conditions of activation of the reactor since this depends only on the temperature, pressure and GHSV. We screened through the reactor model the temperature and pressure conditions at the inlet of the reactor, in order to identify the requirements for the reactions to ignite. When the conditions are suitable for the ignition of the reaction, the temperature rises in the reactor together with CO2 conversion, resulting in a mixture at thermodynamic equilibrium at the reactor outlet. The minimal reaction activation conditions are calculated by solving the heat and mass balance of the reactor (eqn (8) and (9)) over the entire reactor axial coordinate. The integration routine provides the axial profiles of temperature and concentration of the reactants and final values of the integrated variables. The values of conversion at the reactor outlet for a space velocity of 3000 h−1 are shown in Fig. 2a and the extent of the hotspot is displayed in Fig. 2b. The effect of pressure on the activation temperature is limited, resulting in a 25° shift of the runaway temperature from 1 to 10 bar.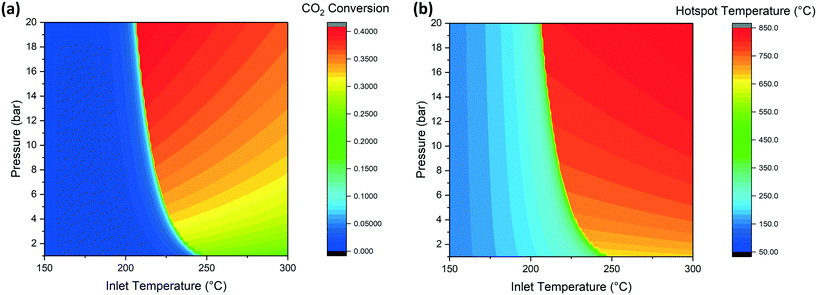 | ||
| Fig. 2 Effect of temperature and pressure on (a) CO2 conversion and (b) hot spot temperature (GHSV = 3000 h−1). | ||
Considering a working point of 10 bar, at temperatures lower than 220 °C, the reaction is not fast enough to produce sufficient heat to be self-sustaining. For this reason, the conversion value at the reactor outlet is low. When the feed temperature is higher than this critical value, the reaction kinetics are fast enough to increase the temperature by product formation and, when working in an adiabatic reactor, to generate the thermal runaway. The reaction mixture reaches the equilibrium conditions in a short time. The outlet conditions are determined by the approach to the thermodynamic equilibrium. In the CO2 conversion-temperature space, the profile inside the reactor follows a line, called the kinetic line. An example of this line is shown in Fig. S1.† The slope of the line is a function of the space velocity and specific heat of the gases. The composition at the adiabatic reactor outlet corresponds to the intersection point of the kinetic line and the thermodynamic equilibrium function. The conversion becomes higher at higher pressure, due to the position of the equilibrium, while it is lower at higher feed temperatures. This influence of the feed is originated by the different starting point of the kinetic line: when the inlet temperature is increased, the distance between this temperature and the equilibrium is reduced, so that the reaction occurs for a shorter reactor length. Since the thermodynamic equilibrium is reached after a shorter reaction path, the matching with this line is at a lower conversion value. For the same principle, the hotspot temperature is higher at higher pressure and feed temperature. By analogy with conversion, an increase of pressure shifts the equilibrium to higher temperatures, resulting in a higher hotspot. The influence of temperature is instead directly reflected in the hotspot, so that a shift in the inlet temperature moves the kinetic line, resulting in a matching point with thermodynamics at higher temperature (and lower conversion). Summarizing, in Fig. 2a and b, the most desired conditions are found on the top and left of the working area. The positioning of the optimal point generates problems in the reactor operation: since the activation of the reactor is subject to sensitivity problems, a small oscillation of the parameters can lead to the shutdown of the reactor. For this reason, the working conditions should be fixed considering the trade-off between reactor optimization and the operability of the set-up. This is a fundamental element to be considered in the design of a methanation reactor. The use of a low temperature active catalyst like Ru/Al2O3 allows a more stable operation of the reactor for the lower runaway temperature.
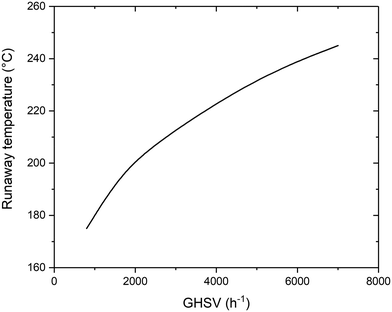
There is particular interest in the effect of the space velocity on the ignition temperature of the reaction. The space velocity controls the residence time in the reactor, as well as the heat transfer mechanism. For this reason, a change in this parameter has a large influence on the minimum temperature required. The increase of GHSV causes an increase on the minimum temperature required. The positioning of the activation temperature is shown in Fig. 3. The reason for the large influence of the space velocity is the time required for the reaction to take place. At higher space velocity, the molecules remain in contact with the catalyst for less time, requiring more severe conditions for the reaction to take place. Since the reaction rate follows an Arrhenius trend, the same production requires less time at higher temperature, explaining the same activation procedure at higher temperature and lower residence time (i.e. higher space velocity). Coherently with what was observed in the previous section, an increase of the activation temperature has an influence on the reactor performance. For this reason, an increase of GHSV causes a decrease in the maximum conversion value, due to the higher equilibrium temperature.
3.3. Performance of a cooled reactor
On the basis of the results of the adiabatic reactor, new simulations were performed to understand the behaviour of a cooled fixed bed catalytic reactor. The use of a cooled reactor allows high values of conversion to be reached, by simultaneous control of reaction and cooling. Unlike the widely applied concept of adiabatic steps with intermediate cooling, where the heat flux is not rigorously controlled, the cooled reactor presents several degrees of freedom and is more flexible for the realization of an optimized process. However, the larger number of parameters influencing the reactor performance makes the design process more complicated and the determination of the reactor behaviour (e.g. in the determination of the operational limits) depends on several factors. In this section, the most important parameters influencing heat transfer are analysed. The reference conditions of the reactor analysed are reported in Table 2. The parameters of the reference case are chosen in line with the experimental setup developed in our research group,50 with the target of a small-scale application of the CO2 methanation.| Pressure | 10 bar |
| T cooling | 180 °C |
| Tube diameter | 0.01 m |
| Cooling flow rate | 10 kg h−1 |
| Number of pipes | 1 |
| Catalyst density | 1500 kg m−3 |
CO2![[thin space (1/6-em)]](https://www.rsc.org/images/entities/char_2009.gif) : :![[thin space (1/6-em)]](https://www.rsc.org/images/entities/char_2009.gif) H2 ratio H2 ratio |
1![[thin space (1/6-em)]](https://www.rsc.org/images/entities/char_2009.gif) : :![[thin space (1/6-em)]](https://www.rsc.org/images/entities/char_2009.gif) 4 4 |
| Space velocity | 3000 h−1 |
| Pellet diameter | 1 mm |
| Catalyst void ratio | 0.6 |
The reaction is strongly exothermic, so an efficient cooling system is required to remove the reaction heat. In the considered case study, the cooling medium considered is a solution of molten salts. In order to keep the temperature constant at 180 °C the coolant flow rate is much larger than the gas flow rate. At the reactor inlet the reaction is extremely fast, so a thermal runaway similarly to the adiabatic reactor is difficult to avoid by the use of classic indirect cooling.58 For this reason, the cooling is necessary to decrease the temperature after the hotspot and to restore the desired set-point temperature to reach high CO2 conversion. The final temperature in the reactor is dependent on the characteristics of the cooling system, so the heat transfer properties are fundamental in determining the reactor performance. Fig. S2† shows the CO2 conversion calculated as a function of the temperature of the cooling fluid (which controls the quantity of heat extracted from the reactor). At high cooling temperatures (matching at the upper limit the hotspot temperature), the CO2 conversion corresponds to the adiabatic value. The decrease of coolant temperature (increase of cooling power) increases the conversion, thanks to the decrease of the reactor temperature consequent to cooling. The maximum conversion value is dependent on pressure and the space velocity. A further increase in the cooling power has a detrimental effect on the reaction, causing a decrease of the conversion due to ‘freezing’ of the kinetics.
The optimal cooling power can be achieved with various technical options. The possible control variables are: temperature of the coolant, flow rate of the cooling fluid, or heat exchange mechanism.
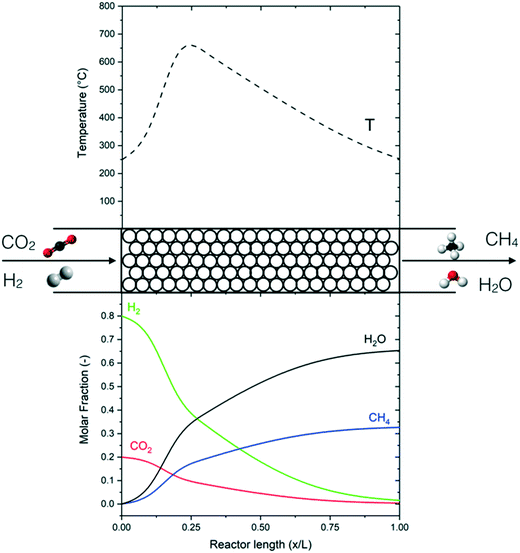
The performance of the reference reactor is shown in Fig. 4 in terms of the temperature and concentration profile with the axial coordinate. Fig. 5 shows the CO2 conversion as a function of temperature. The reactor is clearly divided into two zones: a first area in which the operation is dominated by the reaction kinetics (kinetic regime) and a second area where the reaction is dominated by heat transfer (polytrophic regime). In the first zone, the reaction and the heat production are fast, so the reactor works practically as an adiabatic reactor. In this area, the reaction mixture reaches the thermodynamic equilibrium, which corresponds to the point of minimum reaction rate. From this point, the heat production is reduced, and the reaction kinetics are dominated by thermodynamic effects. The apparent reaction rate is then determined by the heat transfer mechanism, which justifies the naming of the section as the ‘polytropic regime’. In this second zone, which occupies the large majority of the reactor, the temperature is gradually reduced, until reaching the outlet temperature. As mentioned in the previous section, the performance of the adiabatic zone (in terms of the CO2 conversion and final temperature) can be modified by changing the pressure, temperature and space velocity. The heat transfer mechanism has a limited influence in this area because the reaction releases heat quickly. Therefore, it is challenging to control this part of the reactor with a regular indirect cooling; a better control can be achieved with different cooling systems, such as direct cooling by cold gas or by dilution. The performance of the polytrophic zone is instead controlled by the heat transfer parameters, such as coolant temperature and geometry of the cooling system.
3.4. Determination of the activation temperature in the cooled reactor
The main scope of the simulations of the cooled reactor is the determination of the variation of the minimal temperature required to ignite the reaction in comparison with the adiabatic case. The presence of the cooling makes the start of the reaction more difficult, because not all the heat produced is used to warm up the reaction mixture. The effect of cooling temperature on the CO2 conversion is displayed in Fig. 6. When the cooling temperature is lower than the adiabatic runaway temperature, the feed temperature required increases. When the cooling temperature is instead higher than the adiabatic threshold value, the runaway temperature is decreased. This phenomenon is the result of the opposite effect of the external fluid in the two cases: in the former, it acts as a coolant, decreasing the reaction rate. In the latter case, the fluid boosts the reaction, facilitating the runaway behaviour. The coolant temperature has also a major impact on the CO2 conversion value. The highest conversion is found for the lowest coolant temperature. This is due to the increase of the heat transfer in the polytropic reactor zone. In this case, the gases are quickly cooled to the outlet conditions, resulting in a higher conversion at constant residence time. The CO2 conversion decreases quickly when increasing the coolant temperature above 200 °C due to the influence of thermodynamic limitations on the reaction.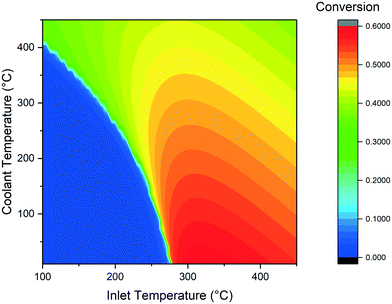 | ||
| Fig. 6 Calculated CO2 conversion at various inlet and coolant temperature (GHSV = 3000 h−1, D = 0.01 m). | ||
The combination of the previous observations suggests that an optimal reactor for the Sabatier reaction should consist of two zones: one first pre-heating zone, where the reactants are pre-heated to the activation temperature and a second finishing zone, characterized by fast cooling of the gases.
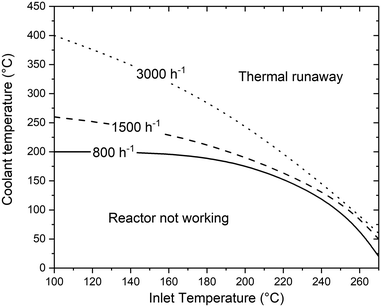
The space velocity has a major effect on the positioning of the reactor activation temperature. The results of the calculations at various GHSV are displayed in Fig. 7. Compared to the reference case, a decrease of space velocity causes a decrease in the coolant temperature required for the activation of the reaction. While at 3000 h−1 the coolant temperature required for the thermal runaway is 400 °C, at 800 h−1 this parameter can be reduced to 200 °C. This is due to the larger residence time in the reactor, which increases the heat exchange between the external fluid and the reactive gases. For a full comparison of the results at different GHSV, the values of CO2 conversion calculated at 1500 h−1 and 800 h−1 varying coolant and inlet temperature are reported in Fig. S3 and S4† (in analogy to Fig. 6).
To conclude this section, we observe that the management of a cooled reactor is more complicated than the exercise of an adiabatic reactor. The advantages related to the rigorous control of the heat fluxes in the reactor are partially compensated by the higher risk of incurring a wrong reactor behaviour. For this reason, the choice of the cooling parameters should be performed considering not only the optimization of the reaction zone but also the minimal requirements for the initiation of the reaction.
3.5. Proposal of a reactor scheme to ensure reactor activation and limit the hotspot
According to the observations of the previous sections, it is not possible to substantially limit the presence of the hotspot in the reactor by means of external cooling. The goal of this section is to propose a special process configuration to limit the influence of the hotspot and ensure normal operation of the system (avoiding the thermal deactivation of the reactor). According to our observations on the influence of thermodynamics on the hotspot temperature, we decided to evaluate the possibility of splitting the feed of CO2 into several parts, keeping the feed of H2 concentrated at the inlet. This allows an improvement of the heat management for two reasons: on the one hand, the thermodynamic equilibrium is shifted because of the varied stoichiometric ratio; on the other hand, the excess hydrogen works as a dilution to decrease the temperature increase in the first stages. The effect of the split ratio (total CO2![[thin space (1/6-em)]](https://www.rsc.org/images/entities/char_2009.gif) :
:![[thin space (1/6-em)]](https://www.rsc.org/images/entities/char_2009.gif) CO2 fed at the first step) in an adiabatic step is assessed in terms of the conversion and hotspot temperature. The results of the calculations are shown in Fig. S5.† In order to limit the hotspot, a relatively high split ratio is necessary. At a split factor = 4, the hotspot is 150 °C lower than the stoichiometric case (550 vs. 700 °C) and the CO2 conversion is almost complete. The different stoichiometric value (excess of H2) limits the side reactions (i.e. the formation of CO) for the change in the thermodynamic limits. Furthermore, the excess hydrogen prevents the formation of carbon on the catalyst surface. For these reasons, the side reactions are not considered in the analysis. The CO2 remaining after the first step is too large to be fed in a second step without the formation of a higher hotspot; as a consequence, also at the second step a feed splitting is necessary. We defined the second split ratio at a lower value than the former and fixed it to 3
CO2 fed at the first step) in an adiabatic step is assessed in terms of the conversion and hotspot temperature. The results of the calculations are shown in Fig. S5.† In order to limit the hotspot, a relatively high split ratio is necessary. At a split factor = 4, the hotspot is 150 °C lower than the stoichiometric case (550 vs. 700 °C) and the CO2 conversion is almost complete. The different stoichiometric value (excess of H2) limits the side reactions (i.e. the formation of CO) for the change in the thermodynamic limits. Furthermore, the excess hydrogen prevents the formation of carbon on the catalyst surface. For these reasons, the side reactions are not considered in the analysis. The CO2 remaining after the first step is too large to be fed in a second step without the formation of a higher hotspot; as a consequence, also at the second step a feed splitting is necessary. We defined the second split ratio at a lower value than the former and fixed it to 3![[thin space (1/6-em)]](https://www.rsc.org/images/entities/char_2009.gif) :
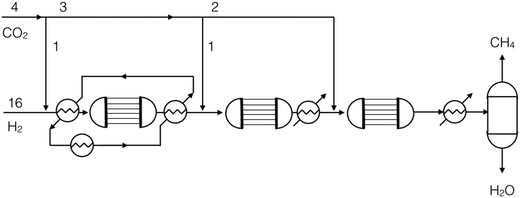
:![[thin space (1/6-em)]](https://www.rsc.org/images/entities/char_2009.gif) 1. The remaining CO2 can be entirely fed to a cooled reactor, because the reaction kinetics is limited by the presence of CH4 in the feed stream. The process scheme designed is reported in Fig. 8. The process scheme allows a high grade of heat integration: the heat produced in the first reactor is sufficient for the pre-heating of the reactants to the same reactor. The gases resulting from the second reactor are cooled by use of an external cooling utility, to adjust the inlet temperature for the third reactor. Finally, the outlet stream of the last reactor is cooled to room temperature to allow the condensation of water and its separation from the produced SNG. The inlet temperature is increased stage by stage to avoid the risk of thermal deactivation of the reactors.
1. The remaining CO2 can be entirely fed to a cooled reactor, because the reaction kinetics is limited by the presence of CH4 in the feed stream. The process scheme designed is reported in Fig. 8. The process scheme allows a high grade of heat integration: the heat produced in the first reactor is sufficient for the pre-heating of the reactants to the same reactor. The gases resulting from the second reactor are cooled by use of an external cooling utility, to adjust the inlet temperature for the third reactor. Finally, the outlet stream of the last reactor is cooled to room temperature to allow the condensation of water and its separation from the produced SNG. The inlet temperature is increased stage by stage to avoid the risk of thermal deactivation of the reactors.
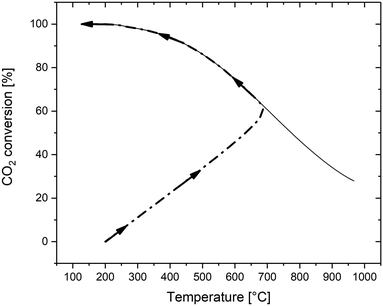
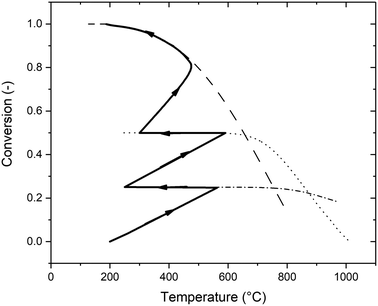
Fig. 9 reports the CO2 conversion profile as a function of temperature. The three reactors designed have different thermodynamic limits, due to the different reaction stoichiometry. In the first and second steps, both performed in adiabatic reactors, the reaction reaches the full CO2 conversion at temperatures between 500 and 600 °C. In this case, it is possible to consume all the CO2 thanks to the large excess of H2. This means that the limiting of the hotspot is performed by adjusting the thermodynamic limits. The last step is a cooled reactor, necessary to complete the reaction. As previously mentioned, in this step the extent of the hotspot is limited by limiting the reaction rate. In fact, the presence of the products in the feed streams to this reactor decreases the reaction rate, according to the thermodynamic limitation.
4. Conclusions
In this paper, we described the most important elements for the activation and heat management of the CO2 methanation reaction on Ru/Al2O3. The reaction is characterized by the presence of a minimal feed temperature, which allows the normal operation of the reactor. At temperatures above this limit, the reaction shows a thermal runaway, with the formation of a pronounced hotspot, whose extent is controlled by thermodynamic equilibrium. The activation temperature in an adiabatic reactor was determined as a function of pressure and space velocity. For a space velocity of 3000 h−1, the activation temperature is 210 °C. This value can be increased or decreased by modifying the space velocity accordingly. When a cooled reactor is used, the required activation temperature is changed as a function of the cooling system. In this paper, we described the influence of the cooling temperature on the minimal feed temperature required for normal operation. A low temperature in the cooling system causes an increase in the feed temperature required for the activation of the reaction. When the coolant temperature is instead higher than the adiabatic activation temperature, the minimal feed temperature decreases thanks to the initial heating effect provided by the cooling. As a last step, we suggested a staged feeding strategy to limit the maximum temperature in the reactor and ensure stable operation of the system. Due to the exothermic character of the reaction and to the fast kinetics, it is complicated to extract sufficient heat from the reactor to limit the hotspot temperature via indirect cooling. The adjustment of the thermodynamic limitations through modification of the stoichiometry of the reaction shows a high potential for the improvement of heat management with a limited complication in the process scheme.Nomenclature
| P i | Partial pressure of the component i (Pa) |
| K eq | Equilibrium constant |
| ΔG | Reaction free Gibbs energy (J mol−1) |
| υ i | Stoichiometric coefficient of the component i |
| λ k | Extent of reaction |
| l | Thermal conductivity (W m−2 K−1) |
| χ | Conversion |
| c b i | Bulk concentration of the species i (mol L−1) |
| c s i | Surface concentration of the species i (mol L−1) |
| k g a v | Material transfer coefficient (mol m−2) |
| h f a v | Local heat transfer coefficient (W m−2 K−1) |
| U A | Global heat transfer coefficient (W m−2 K −1) |
| d tube | Diameter of the reactor tube (m) |
| T | Temperature (K) |
| η | Effectiveness factor of the catalyst pellet |
| r A | Reaction rate (mol m3 s) |
| φ | Thiele modulus |
| V p | Volume of the particle (m3) |
| S p | Surface of the particle (m2) |
| n | Reaction order |
| k | Kinetic constant ((mol m−3)n s−1) |
| D | Diffusion coefficient (m2 s−1) |
| k i | Internal local heat transfer coefficient (W m−2 K−1)) |
| k e | External local heat transfer coefficient (W m−2 K−1)) |
| Re | Reynolds number |
| Nu | Nusselt number |
| Pr | Prandtl number |
| Sc | Schmidt number |
| Sh | Sherwood number |
Conflicts of interest
There are no conflicts to declare.Acknowledgements
The collaboration with Gaznat and the financial support by the KTI/CTI project no. 26441.1 PFIW-IW “Development of a Novel, highly Efficient Energy System for Natural Gas Metering and Regulating Stations Based on Waste Heat Recovery and Synthetic Methane Production” are greatly acknowledged.References
- A. Zervos, C. Lins and L. Tesniere, Mapping renewable energy pathways towards 2020-EU ROADMAP, Brussels, Belgium, 2011, URL, http://refman.et-model.com/publications/1761 Search PubMed.
- Global Wind Energy Council (GWEC), Global Wind Report Annual Market Update 2013, Brussels, Belgium, 2014, URL, http://www.gwec.net/wp-content/uploads/2014/04/GWEC-Global-Wind-Report_9-April-2014.pdf Search PubMed.
- European Environmental Agency, Renewable energy in Europe – 2017 Update - Recent growth and knock-on effects, ISSN 1977-8449 Search PubMed.
- M. Jentsch, T. Trost and M. Sterner, Energy Procedia, 2014, 46, 254–261 CrossRef.
- A. A. El-Moneim, E. Akiyama, H. Habazaki, N. Kumagai, A. Kawashima and K. Asami, Mater. Sci. Eng., A, 1999, 267, 200–206 CrossRef.
- K. Hashimoto, N. Kumagai, K. Izumiya, H. Takano and Z. Kato, Energy Sustain. Soc., 2014, 4, 1–9 Search PubMed.
- G. Pleßmann, M. Erdmann, M. Hlusiak and C. Breyer, Energy Procedia, 2014, 46, 22–31 CrossRef.
- H. S. de Boer, L. Grond, H. Moll and R. Benders, Energy, 2014, 72, 360–370 CrossRef.
- M. Aresta, A. Dibenedetto and A. Angelini, Chem. Rev., 2014, 114, 1709–1742, DOI:10.1021/cr4002758.
- E. A. Quadrelli, G. Centi, J. L. Duplan and S. Perathoner, ChemSusChem, 2011, 4, 1194–1215, DOI:10.1002/cssc.201100473.
- C. Janke, M. S. Duyar, M. Hoskins and R. J. Farrauto, Appl. Catal., B, 2014, 152–153, 184–191, DOI:10.1016/j.apcatb.2014.01.016.
- N. Gallandat, G. Bérard, F. Abbet and A. Züttel, Sustainable Energy Fuels, 2017, 1, 1748–1758 RSC.
- S. Rönsch, J. Schneider, S. Matthischke, M. Schlüter, M. Götz and J. Lefebvre, Fuel, 2016, 166, 276–296 CrossRef.
- U. Zuberbühler and M. Specht, Power-to-Gas: Construction and start-up of a 250 kW research plant. In: Proceedings of the 7th International Renewable Energy Storage Conference, Berlin, Germany, 2012 Search PubMed.
- G. Benjaminsson, J. Benjaminsson and R. B. Rudberg, Svenskt Gastekniskt Center AB, 2013 Search PubMed.
- S. Rieke, Catalytic methanation – the Audi e-gas project as an example of industrialized technology for Power to gas. REGATEC 2015, Barcelona, Spain, 2015 Search PubMed.
- M. Götz, J. Lefebvre, F. Mörs, A. McDaniel Koch, F. Graf and S. Bajohr, Renewable Energy, 2016, 85, 1371–1390 CrossRef.
- M. A. Vannice, Catal. Rev.: Sci. Eng., 1976, 14, 153–191 CrossRef CAS.
- G. A. Mills and F. W. Steffgen, Catalytic methanation, Catal. Rev.: Sci. Eng., 1974, 8, 159–210 CrossRef.
- G. P. van der Laan and A. A. C. M. Beenackers, Catal. Rev.: Sci. Eng., 1999, 41, 255–318 CrossRef CAS.
- G. M. Iglesias, C. de Vries, M. Claeys and G. Schaub, Catal. Today, 2015, 242A, 184–192 CrossRef.
- M. Saito and R. B. Anderson, J. Catal., 1980, 63, 438–446 CrossRef CAS.
- J. B. Powell and S. H. Langer, J. Catal., 1985, 94, 566–569 CrossRef CAS.
- E. Kok, J. Scott, N. Cant and D. Trimm, Catal. Today, 2011, 164, 297–301 CrossRef CAS.
- W. Wang and J. Gong, Front. Chem. Sci. Eng., 2011, 5, 2–10 CrossRef CAS.
- InfoMine: Mining Intelligence & Technology, http://www.infomine.com/investment/nickel/http://www.infomine.com/investment/ruthenium/>[download: 21.03.2018][download: 21.03.2018] Search PubMed.
- Swiss Gas and Water Industry Association, Regulations on quality of natural gas network, Zürich, 2013, http://epaper.svgw.ch/Epaper/Render/Download/?editionId=5c6dacda-e087-e711-80d8-001dd8b729e1&page=, [download: 21.03.2018] Search PubMed.
- M. Agnelli, M. Kolb, C. Nicot and C. Mirodatos, Sintering of a Ni-based catalyst during CO hydrogenation: kinetics and modeling, in: Catalyst Deactivation, ed. C. H. Bartholomew and J. B. Butt, Elsevier, B.V, Amsterdam, 1991, pp. 605–612 Search PubMed.
- I. Fechete and J. C. Vedrine, Molecules, 2015, 20, 5638–5666 CrossRef CAS PubMed.
- W. Wang, S. Wang, X. Ma and J. Gong, Chem. Soc. Rev., 2011, 40, 3703–3727 RSC.
- A. Varrma, M. Morbidelli and H. Wu, Parametric Sensitivity in Chemical Systems, Cambridge Series in Chemical Engineering, Cambridge University Press, Cambridge, 1999 Search PubMed.
- G. Garbarino, D. Belotti, P. Riani, L. Magistri and G. Busca, Int. J. Hydrogen Energy, 2015, 40, 9171–9182 CrossRef CAS.
- P. J. Lunde and F. L. Kester, J. Catal., 1973, 30, 423–429 CrossRef CAS.
- M. Marwood, R. Doepper and A. Renken, Appl. Catal., A, 1997, 151, 223–246 CrossRef CAS.
- X. Wang, Y. Hong, H. Shi and J. Szanyi, J. Catal., 2016, 343, 185–195 CrossRef CAS.
- F. Solymosi, A. Erdohelyi and M. Kocsis, J. Chem. Soc., Faraday Trans., 1981, 77, 1003–1012 RSC.
- Y. Traa and J. Weitkamp, Chem. Eng. Technol., 1999, 21, 291–293 CrossRef.
- M. Kuśmierz, Catal. Today, 2008, 137(2–4), 429–432 CrossRef.
- K. Takeishi and K. Aika, Comparison of carbon dioxide and carbon monoxide with respect to hydrogenation on Raney® ruthenium catalysts, Appl. Catal., A, 1995, 133, 31–45, DOI:10.1016/0926-860X(95)00143-3.
- M. S. Duyar, A. Ramachandran, C. Wang and R. J. Farrauto, Kinetics of CO2 methanation over Ru/Al2O3 and implications for renewable energy storage applications, J. CO2 Util., 2015, 12, 27–33, DOI:10.1016/j.jcou.2015.10.003.
- P. J. Lunde and F. L. Kester, Carbon dioxide methanation on a ruthenium catalyst, Ind. Eng. Chem. Process Des. Dev., 1974, 13, 27–33, DOI:10.1021/i260049a005.
- H. Ohya, J. Fun, H. Kawamura, K. Itoh, H. Ohashi and M. Aihara, et al. , J. Membr. Sci., 1997, 131, 237–247 CrossRef CAS.
- K. P. Brooks, J. Hu, H. Zhu and R. J. Kee, Chem. Eng. Sci., 2007, 62, 1161–1170 CrossRef CAS.
- L. Falbo, M. Martinelli, C. G. Visconti, L. Lietti, C. Bassano and P. Deiana, Appl. Catal., B, 2017, 225, 354–363 CrossRef.
- M. De Saint Jean, P. Baurens, C. Bouallou and K. Couturier, Int. J. Hydrogen Energy, 2014, 39, 6487–6500 CrossRef.
- M. De Saint Jean, P. Baurens and C. Bouallou, Int. J. Hydrogen Energy, 2015, 40, 17024–17039 CrossRef.
- T. Schaaf, J. Grünig, M. R. Schuster, T. Rothenfluh and A. Orth, Energy Sustain. Soc., 2014, 4, 2 CrossRef.
- L. Kiewidt and J. Thöming, Chem. Eng. Sci., 2015, 132, 59–71 CrossRef CAS.
- A. El Sibai, L. K. Rihko Struckmann and K. Sundmacher, Energy Technol., 2017, 5, 911–921 CrossRef CAS.
- N. Gallandat, R. T. A. Mutschler, V. Vernay, H. Yang and A. Züttel, Sustainable Energy Fuels, 2018, 2, 1101–1110 RSC.
- S. Matthischke, R. Krüger, S. Rönsch and R. Güttel, Fuel Process. Technol., 2016, 153, 87 CrossRef CAS.
- S. Matthischke, S. Rönsch and R. Güttel, Ind. Eng. Chem. Res., 2018, 57, 6391–6400 CrossRef CAS.
- D. Sun and D. S. Simakov, J. CO2 Util., 2017, 21, 368 CrossRef CAS.
- D. Sun, F. M. Kahn and D. S. A. Simakov, Chem. Eng. J., 2017, 329, 165 CrossRef CAS.
- J. Bremer, K. H. G. Ratze and K. Sundmacher, AIChE J., 2017, 63, 23 CrossRef CAS.
- J. Lee, V. Balakothai and D. Luss, AIChE J., 1987, 33, 1136 CrossRef CAS.
- R. Try, A. Bengaouer, P. Baurens and C. Jallut, AIChE J., 2018, 64, 468 CrossRef CAS.
- D. Schlereth and O. Hinrichsen, Chem. Eng. Res. Des., 2014, 92, 702–712 CrossRef CAS.
- R. B. Bird, W. E. Stewart and E. N. Lightfoot, Transport Phenomena, John Wiley & Sons, New York, 2nd edn, 2007 Search PubMed.
- G. F. Froment, in Chemical Reaction Engineering Advances in Chemistry, American Chemical Society, Washington DC, 1972 Search PubMed.
- A. P. de Wasch and G. F. Froment, Heat transfer in packed beds, Chem. Eng. Sci., 1972, 27, 567–576 CrossRef CAS.
- E. Tsotsas, Wärmeleitfähigkeit von Schüttschichten, VDI-Wärmeatlas, Springer, Berlin/Heidelberg, 2006, pp. 422–430 Search PubMed.
- E. Tsotsas, Wärmeleitung und Dispersion in durchströmten Schüttungen, VDI-Wärmeatlas, Springer, Berlin/Heidelberg, 2006, pp. 1213–1227 Search PubMed.
- N. Wakao, S. Kaguei and T. Funazkri, Chem. Eng. Sci., 1979, 34, 325–336 CrossRef CAS.
- N. R. Parlikkad, S. Chambrey, P. Fongarland, N. Fatah, A. Khodakov, S. Capela and O. Guerrini, Fuel, 2013, 107, 254 CrossRef CAS.
- R. Mutschler, E. Moioli, W. Luo, N. Gallandat and A. Züttel, J. Catal., 2018, 366, 139–149 CrossRef CAS.
Footnote |
| † Electronic supplementary information (ESI) available. See DOI: 10.1039/c8re00133b |
| This journal is © The Royal Society of Chemistry 2019 |


