 Open Access Article
Creative Commons Attribution 3.0 Unported Licence
Photolysis of cell-permeant caged inositol pyrophosphates controls oscillations of cytosolic calcium in a β-cell line†
S.
Hauke‡
a,
A. K.
Dutta‡
 b,
V. B.
Eisenbeis
 b,
D.
Bezold
 b,
T.
Bittner
 b,
C.
Wittwer
 b,
D.
Thakor
b,
I.
Pavlovic
b,
C.
Schultz
*ac and
H. J.
Jessen
b,
D.
Thakor
b,
I.
Pavlovic
b,
C.
Schultz
*ac and
H. J.
Jessen
 *b
*b
aEMBL, Heidelberg, 69117 Heidelberg, Germany. E-mail: Schultz@embl.de
bUniversity of Freiburg, Institute of Organic Chemistry, 79104 Freiburg, Germany. E-mail: Henning.jessen@oc.uni-freiburg.de
cOHSU, Dept. Physiology & Pharmacology, Portland, OR, USA. E-mail: Schulcar@ohsu.edu
First published on 10th January 2019
Abstract
Among many cellular functions, inositol pyrophosphates (PP-InsPs) are metabolic messengers involved in the regulation of glucose uptake, insulin sensitivity, and weight gain. However, their mechanisms of action are still poorly understood. So far, the influence of PP-InsPs on cellular metabolism has been studied by overexpression or knockout/inhibition of relevant metabolizing kinases (IP6Ks, PPIP5Ks). These approaches are, inter alia, limited by time-resolution and potential compensation mechanisms. Here, we describe the synthesis of cell-permeant caged PP-InsPs as tools to rapidly modulate intracellular levels of defined isomers of PP-InsPs in a genetically non-perturbed cellular environment. We show that caged prometabolites readily enter live cells where they are enzymatically converted into still inactive, metabolically stable, photocaged PP-InsPs. Upon light-triggered release of 5-PP-InsP5, the major cellular inositol pyrophosphate, oscillations of intracellular Ca2+ levels in MIN6 cells were transiently reduced to spontaneously recover again. In contrast, uncaging of 1-PP-InsP5, a minor cellular isomer, was without effect. These results provide evidence that PP-InsPs play an active role in regulating [Ca2+]i oscillations, a key element in triggering exocytosis and secretion in β-cells.
Introduction
Diphosphoinositol polyphosphates (hereafter called inositol pyrophosphates or PP-InsPs) are hyperphosphorylated molecules derived from myo-inositol hexakisphosphate (InsP6) 1.1,2 5-PP-InsP5 2 is the most abundant representative in mammalian cells, but 1-PP-InsP5 3 and 1,5-(PP)2-InsP4 4 are also present and are interconverted by enzymatic action (Fig. 1). Many important biological functions in eukaryotes have been associated with PP-InsPs.3–5 An emerging concept classifies PP-InsPs as ‘metabolic messengers’ that monitor cellular energy and phosphate homeostasis.6–14 Mice lacking inositol hexakisphosphate kinase 1 (IP6K1 KO), one of the three mammalian InsP6 kinases that generate 5-PP-InsP5 2 from InsP6 1, exhibit reduced body weight, do not gain weight on a high-fat diet and are insulin hypersensitive while having reduced levels of circulating insulin.15,16 Recently, the pan-IP6K inhibitor N2-(m-(trifluoromethyl)benzyl)-N6-(p-nitrobenzyl)purine (TNP)17 was shown to protect mildly obese mice from the progression of diet-induced obesity.18 Therefore, IP6K1 was suggested as a potential drug target for the treatment of diabetes and obesity.18 In this context, it has been reported that extracellularly applied InsP6 and 5-PP-InsP5 trigger the release of insulin from the readily releasable pool of permeabilized pancreatic β-cells, measured indirectly using patch clamp technology.19,20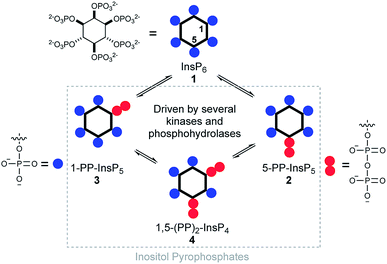 | ||
| Fig. 1 Structure of inositol pyrophosphates and schematic, simplified overview of their metabolic turnover. | ||
Insulin release from pancreatic β-cells in response to changes in blood-glucose levels is the hallmark of β-cell physiology. Glucose stimulated insulin secretion involves the glucose metabolism-induced rise of the intracellular ATP/ADP ratio. Increased ATP-levels act by inhibiting ATP-sensitive K+ (KATP) channels, which results in decreased K+-influx, membrane depolarization and subsequent voltage-gated Ca2+-influx. Even though an involvement of PP-InsPs in the regulation of oscillations of cytosolic Ca2+ levels ([Ca2+]i oscillations) seems reasonable due to their impact on insulin secretion in β-cells, their immediate effect on [Ca2+]i oscillations has not been studied before.
Extracellular application of non-caged metabolites comes with the drawback of unpredictable concentration gradients across the plasma membrane of live cells, especially when studying charged metabolites. Since chemical or electrophysiological permeabilization of cells causes significant perturbation, even more so when the biological effect is driven by changes in the plasma membrane potential, less invasive technologies are in high demand. The spontaneous increase of second messenger levels using photolysis is such a technology.21 The photolabile cage masks the biomolecule to prevent metabolism and target proteins binding until defined light-mediated release of the messenger with high spatiotemporal control. However, if the second messenger under investigation bears significant charge, care must be taken in order to deliver it across the plasma membrane.22 Here, a typical approach is masking the negatively charged phosphates by alkylation with acetoxyalkyloxy esters.23–25
Recently, the cellular delivery of 5-PP-InsP5 using acetoxybenzylesters (AB) has been reported.26 The latter are quickly degraded inside live cells to release the unmasked phosphate ester. Delivery of a photocaged 5-PP-InsP5 using this prometabolite technology has never been achieved before but would additionally facilitate temporal and spatial control over the release of the active messengers and thus avoid concentration gradients. To date, this has not been achieved for any member of the inositol pyrophosphate family. Controlled intracellular release of non-symmetric PP-InsPs, such as 1-PP-InsP5, also remains an unsolved problem that it now addressed in this publication. In contrast, the delivery of a symmetric caged 5-PP-InsP5 using non-covalent association with a guanidinium-rich molecular transporter was recently reported and used to demonstrate the effect of 5-PP-InsP5 on the subcellular localization of the PH domain of Akt in living HeLa cells.27
Here, we demonstrate the efficient loading of pancreatic mouse insulinoma 6 (MIN6) cells28 with the photocaged PP-InsP isomers 1-PP-InsP5, 3-PP-InsP5, and 5-PP-InsP5, without the need for cell permeabilization or use of additives. The simple incubation of cells with photocaged prometabolites is sufficient. Moreover, we provide evidence that an increase of intracellular 5-PP-InsP5 concentrations profoundly impacts β-cell activity ([Ca2+]i oscillations), whereas 1-PP-InsP5 is inactive.
Results and discussion
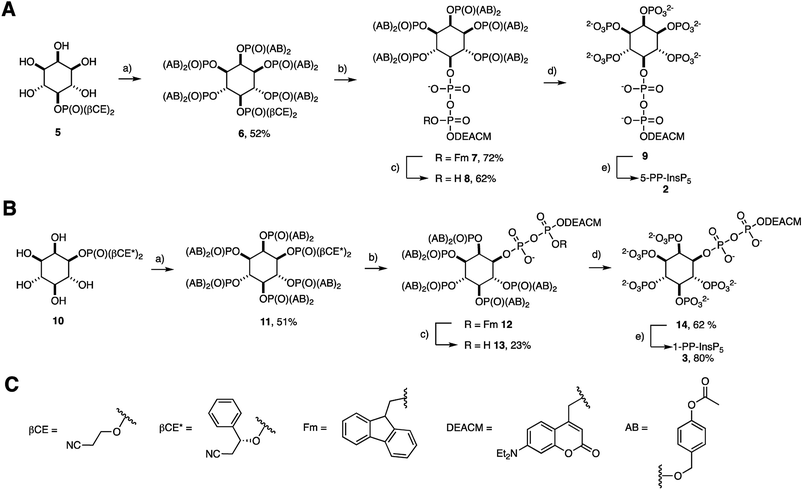
The preparation of acetoxybenzyl (AB) prometabolites of [7-(diethylamino)coumarin-4-yl]methyl (DEACM) caged PP-InsPs is shown in Scheme 1(A and B). Synthesis of (AB)10-DEACM 5-PP-InsP5 8 started from pentanol 5.29 The AB protected phosphates were installed using P(III) chemistry, followed by oxidation to give hexakisphosphate 6 in 52% yield.30 Next, the β-cyanoethyl (β-CE) groups were replaced by TMS esters, which were methanolized, followed by generation of a P(III)–P(V) anhydride and oxidation to the protected diphosphate 7 (72% yield) in a one-flask procedure.26,29,31–33 The P(III)–P(V) anhydride was generated with a fluorenylmethyl (Fm) and DEACM modified P-amidite.24 In the final step, the Fm group was removed with piperidine (1.2 eq.) to release the caged prometabolite (AB)10-DEACM 5-PP-InsP5 8 in 62% yield. For the prometabolite approach, it is vital that the β-phosphate only bears one protecting group (in this case: DEACM) to avoid unwanted side-product formation in the enzymatic cleavage.26 Overall, a yield of 23% was achieved for the transformation of 5 to 8. Cleavage of the AB groups leads to the release of DEACM-caged 5-PP-InsP5 9,27 and irradiation releases the active messenger 5-PP-InsP5 2 (Scheme 1A and B).The synthesis of 1-PP-InsP5 prometabolite 13 required desymmetrization of myo-inositol, which was achieved by asymmetric phosphorylation. This strategy enables the installation of a protected phosphate in the 1- and 3-positions of myo-inositol, such as in phosphate ester 10.29,31 The chiral auxiliary βCE* used in this strategy resembles the achiral βCE protecting group used in approach A (Scheme 1). This strategy enabled the same synthetic approach to generate (AB)10-DEACM 1-PP-InsP5 13 in enantiomerically pure form (Scheme 1B) as well as its enantiomer (AB)10-DEACM 3-PP-InsP5ent-13 (synthesis and data in the ESI†). The overall yield for the synthesis of 13 starting from 10 was 12% after purification by preparative RP-HPLC using evaporative light-scattering detection to avoid cleavage of the photocage. In order to obtain DEACM 1-PP-InsP5 (14) without AB groups as a reference, the AB groups were removed chemically with 33% piperidine in DMF in 68% yield. Furthermore, DEACM was removed by irradiation in a photoreactor releasing 1-PP-InsP5 3 in high purity after ion exchange and precipitation in 80% yield.
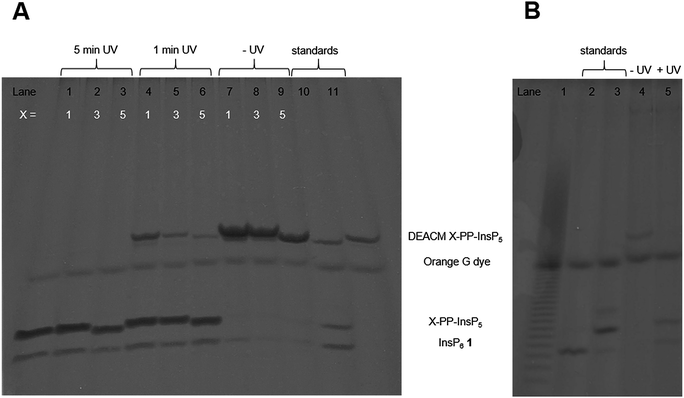
Next, the AB cleavage process was studied in MIN6 cell extract to validate the cleavage of protecting groups and thereby the release of DEACM caged X-PP-InsP5 9, 14, ent-14 from AB prometabolites. Incubation of prometabolites in cell extract, followed by TiO2 enrichment and resolution of the digest on polyacrylamide gels (PAGE)34 and staining with toluidine blue is shown in Fig. 2A. DEACM 5-PP-InsP5 9 was identified by comigration with a synthetic standard as the product of enzymatic hydrolysis, involving complete and selective removal of 10 AB groups in less than 10 min of incubation. Only minor amounts of InsP6 1 due to hydrolysis of the P-anhydride were identified.26 UV irradiation using a 1000 W arc lamp quantitatively released 5-PP-InsP5 2 from the caged compound 9 in MIN6 extract in less than five minutes. A comparable outcome was observed when repeating the experiments with the 1-PP-InsP5 prometabolite 13 and its enantiomer ent-13 (Fig. 2A), demonstrating the versatility of the approach.
Subsequently, we analyzed the ability of MIN6 cells to take up the prometabolite 8 and to release DEACM 5-PP-InsP5 9. MIN6 cells incubated with 8 (30 μM) were lysed after prolonged exposure (24 h; Fig. 2B) and the lysate was enriched for highly phosphorylated metabolites using TiO2 extraction.35 The recovered molecules were then analyzed by PAGE. DEACM 5-PP-InsP5 9 was recovered from MIN6 cells after 24 hours of incubation, thus demonstrating delivery and metabolic stability of 9 in live cells (Fig. 2B, lane 4). This procedure was repeated for the nonsymmetric prometabolites 13 and ent-13 and worked equally well (Fig. S1 in the ESI†).
Next, cellular uptake by MIN6 cells was verified using confocal microscopy. We found comparable loading of compounds after 4 h of incubation on MIN6 cells (Fig. S2 in the ESI†). Here, coumarin fluorescence (DEACM) was used to analyze subcellular localization of the probe. Z-stack analysis revealed homogenous distribution of all DEACM X-PP-InsP5s within internal membranes, whereas no probe was observed in nuclei (Fig. S3 in the ESI†). The proof of cellular uptake of 8 into live MIN6 cells and the quantitative and rapid release of 9 from 8 including the selective photolysis of 9 to 5-PP-InsP5 are important prerequisites for the application of caged compounds in cellulo.
These results served as a starting point for monitoring cellular effects on β-cells of different PP-InsPs after uncaging. [Ca2+]i oscillations in MIN6 cells provided a highly sensitive and physiologically relevant read-out for monitoring the effects of the rapid increase of the metabolic messengers upon UV-irradiation. The oscillations were monitored at the single β-cell level using the Ca2+-sensitive indicator Fluo-4.
(AB)10-DEACM 5-PP-InsP5 loaded MIN6 cells were grouped into two populations that behaved differently, following photolysis. Consistently, both populations transiently reduced their [Ca2+]i oscillations, for ca. 20 min (cell population I) or ca. 10 min (population II) after UV-irradiation (λ = 375 nm, Fig. 3A, B(i, ii) and C, D). Population II was of significantly higher abundance compared to population I (ratio 4![[thin space (1/6-em)]](https://www.rsc.org/images/entities/char_2009.gif) :
:![[thin space (1/6-em)]](https://www.rsc.org/images/entities/char_2009.gif) 1). Even though MIN6 cells within population I stopped [Ca2+]i oscillations at different time points, recovery of cell activity occurred almost simultaneously within cells at different sites in the field of view. Comparable effects were observed for MIN6 cells of population II (Fig. 3A and B).
1). Even though MIN6 cells within population I stopped [Ca2+]i oscillations at different time points, recovery of cell activity occurred almost simultaneously within cells at different sites in the field of view. Comparable effects were observed for MIN6 cells of population II (Fig. 3A and B).
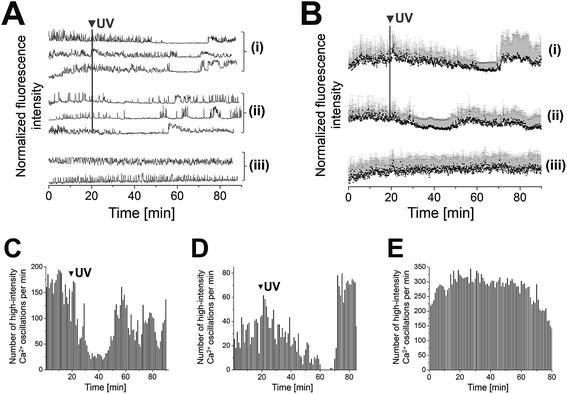 | ||
Fig. 3 Photolysis of (AB)10-DEACM 5-PP-InsP5 in MIN6 cells. (A + B) Representative single (A) and averaged (B) Ca2+ traces from MIN6 cells, recorded with the Ca2+ indicator Fluo-4. (i) Photolysis of (AB)10-DEACM 5-PP-InsP5, cell population I, (ii) photolysis of (AB)10-DEACM 5-PP-InsP5, cell population II (ratio population I![[thin space (1/6-em)]](https://www.rsc.org/images/entities/char_2009.gif) : :![[thin space (1/6-em)]](https://www.rsc.org/images/entities/char_2009.gif) II ∼ 1 II ∼ 1![[thin space (1/6-em)]](https://www.rsc.org/images/entities/char_2009.gif) : :![[thin space (1/6-em)]](https://www.rsc.org/images/entities/char_2009.gif) 4), (iii) (AB)10-DEACM 5-PP-InsP5, -UV control. (C–E) Number of detected high-intensity Ca2+ events within every 60 s interval. (C) (AB)10-DEACM 5-PP-InsP5, cell population I; (D) (AB)10-DEACM 5-PP-InsP5, cell population II; (E) (AB)10-DEACM 5-PP-InsP5, -UV control. For representative individual Ca2+ traces see ESI Fig. S4.† MIN6 cells were loaded with the compounds (10 μM) for 4 h before imaging, which was conducted in the presence of 11 mM glucose. Photolysis: λ = 375 nm, 10 frames, 3.2 s frame time (indicated as: UV). n > 40 cells in 4 experiments. Error bars present SD. 4), (iii) (AB)10-DEACM 5-PP-InsP5, -UV control. (C–E) Number of detected high-intensity Ca2+ events within every 60 s interval. (C) (AB)10-DEACM 5-PP-InsP5, cell population I; (D) (AB)10-DEACM 5-PP-InsP5, cell population II; (E) (AB)10-DEACM 5-PP-InsP5, -UV control. For representative individual Ca2+ traces see ESI Fig. S4.† MIN6 cells were loaded with the compounds (10 μM) for 4 h before imaging, which was conducted in the presence of 11 mM glucose. Photolysis: λ = 375 nm, 10 frames, 3.2 s frame time (indicated as: UV). n > 40 cells in 4 experiments. Error bars present SD. | ||
(AB)10-DEACM 3-PP-InsP5 loaded MIN6 cells transiently reduced their [Ca2+]i oscillations, ca. 15 min after UV-irradiation (λ = 375 nm, Fig. 4A(i, iii) and D), with no effects in the -UV control (Fig. 4A(ii, iv) and E). No comparable effects were observed upon irradiation of (AB)10-DEACM 1-PP-InsP5 pre-loaded MIN6 cells (λ = 375 nm, Fig. 4B(i, iii) and F). 3-PP-InsP5 is the non-natural enantiomer of 1-PP-InsP5 and is not degraded by the enzymes responsible for inositol pyrophosphate turnover, whereas 1-PP-InsP5 is rapidly metabolized.36 This metabolic instability might explain the differential behavior of the two enantiomers in the presented assay. We applied (AB)2-DEACM phosphate as a negative control in MIN6 cell experiments and no effects on [Ca2+]i oscillations were observed upon UV irradiation of loaded MIN6 cells (λ = 375 nm, Fig. 4A, B(v) and ESI Fig. S6†). Also, vehicle-loaded MIN6 cells did not show changes in [Ca2+]i oscillations upon UV irradiation (λ = 375 nm, ESI, Fig. S7†).
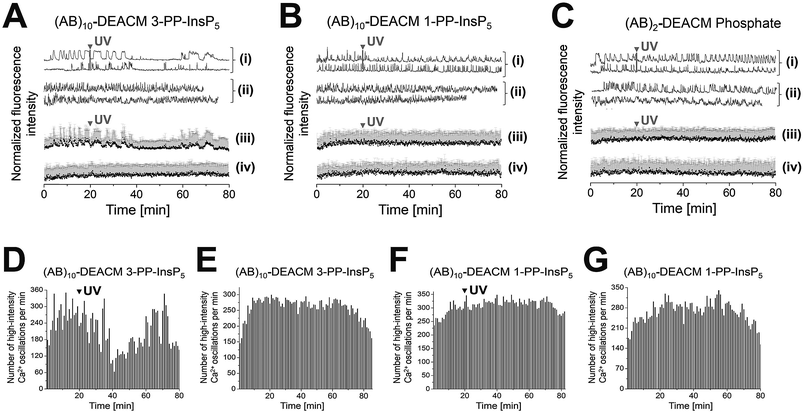 | ||
| Fig. 4 Photolysis of (AB)10-DEACM 1-, 3-PP-InsP5 and of (AB)2-DEACM Phosphate in MIN6 cells. (A–C) Representative single (i + ii) and averaged (iii + iv) Ca2+ traces from MIN6 cells, recorded with the Ca2+ indicator Fluo-4. (i + iii) Photolysis and (ii + iv) -UV controls of (A) (AB)10-DEACM 3-PP-InsP5, (B) (AB)10-DEACM 1-PP-InsP5, and of (C) (AB)2-DEACM Phosphate. (D–G) Number of detected high-intensity Ca2+ events within every 60 s interval. (D) (AB)10-DEACM 3-PP-InsP5; (E) (AB)10-DEACM 3-PP-InsP5, -UV control; (F) (AB)10-DEACM 1-PP-InsP5; (G) (AB)10-DEACM 1-PP-InsP5, -UV control. For representative individual Ca2+ traces see ESI Fig. S5–S7.† MIN6 cells were loaded with (AB)10-DEACM 1- and 3-PP-InsP5 (10 μM) for 4 h before imaging, which was conducted in the presence of 11 mM glucose. Photolysis: λ = 375 nm, 10 frames, 3.2 s frame time (indicated as: UV). n > 40 cells in 4 experiments. Error bars present SD. | ||
Conclusion
In summary, this study provides advanced synthetic procedures for the preparation of complex inositol pyrophosphate prometabolites and of PP-InsPs that are additionally equipped with DEACM photocages. Such photocaged prometabolites of inositol pyrophosphates have not been reported before. The modifications are not only introduced on symmetric 5-PP-InsP5 but also on the two enantiomers 1- and 3-PP-InsP5 by applying asymmetric phosphorylation. The photocaged prometabolites enter live cells and can efficiently release the caged precursor molecule involving clean enzymatic removal of ten protecting groups. The procedure is simple, as it only requires incubation of cells with the prometabolite to achieve efficient loading. Upon photolysis, the effects of a controlled intracellular increase of different inositol pyrophosphate species were read out at the single cell level and averaged on ensembles of cells. The controlled increase of the intracellular 5-PP-InsP5 concentration was found to translate into a transient decrease of [Ca2+]i oscillations within MIN6 cells. In contrast, 1-PP-InsP5, the other relevant cellular inositol pyrophosphate with seven phosphate groups, did not show any of these effects but, interestingly, its unnatural enantiomer did. The underlying mechanisms still have to be identified. This study shows for the first time the modulation of β-cell activity upon temporally defined photo-release of inositol pyrophosphate species. In addition to the described effects on cellular [Ca2+]i oscillations, we propose that the presented tools and strategies will be of high value to also study other effects that are associated with the PP-InsPs.14,37Conflicts of interest
There are no conflicts to declare.Acknowledgements
H. J. J. acknowledges financial support from the Deutsche Forschungsgemeinschaft (DFG Grant JE 572/4-1). C. S. acknowledges financial support from the Deutsche Forschungsgemeinschaft (DFG Transregio TRR86). We thank the NMR facilities of Uni Freiburg (Magres) for extended measurement time and the Advanced Light Microscopy Facility at EMBL for expert instrument maintenance. We thank Stephen Shears and Adolfo Saiardi for valuable discussions.Notes and references
- F. S. Menniti, R. N. Miller, J. W. Putney and S. B. Shears, J. Biol. Chem., 1993, 268, 3850–3856 CAS.
- L. Stephens, T. Radenberg, U. Thiel, G. Vogel, K. H. Khoo, A. Dell, T. R. Jackson, P. T. Hawkins and G. W. Mayr, J. Biol. Chem., 1993, 268, 4009–4015 CAS.
- S. G. Thota and R. Bhandari, J. Biosci., 2015, 40, 593–605 CrossRef CAS PubMed.
- S. B. Shears, Adv. Biol. Regul., 2015, 57, 203–216 CrossRef CAS PubMed.
- C. Azevedo and A. Saiardi, Trends Biochem. Sci., 2017, 42, 219–231 CrossRef CAS.
- S. B. Shears, Mol. Pharmacol., 2009, 76, 236–252 CrossRef CAS PubMed.
- M. S. C. Wilson, T. M. Livermore and A. Saiardi, Biochem. J., 2013, 452, 369–379 CrossRef CAS PubMed.
- Z. Szijgyarto, A. Garedew, C. Azevedo and A. Saiardi, Science, 2011, 334, 802–805 CrossRef CAS PubMed.
- R. Gerasimaite, I. Pavlovic, S. Capolicchio, A. Hofer, A. Schmidt, H. J. Jessen and A. Mayer, ACS Chem. Biol., 2017, 12, 648–653 CrossRef CAS PubMed.
- C. Gu, H. N. Nguyen, A. Hofer, H. J. Jessen, X. Dai, H. Wang and S. B. Shears, J. Biol. Chem., 2017, 292, 4544–4555 CrossRef CAS PubMed.
- R. Wild, R. Gerasimaite, J. Y. Jung, V. Truffault, I. Pavlovic, A. Schmidt, A. Saiardi, H. J. Jessen, Y. Poirier, M. Hothorn and A. Mayer, Science, 2016, 352, 986–990 CrossRef CAS PubMed.
- C. Gu, H. N. Nguyen, D. Ganini, Z. Chen, H. J. Jessen, Z. Gu, H. Wang and S. B. Shears, Proc. Natl. Acad. Sci. U. S. A., 2017, 114, 11968–11973 CrossRef CAS PubMed.
- N. W. Brown, A. M. Marmelstein and D. Fiedler, Chem. Soc. Rev., 2016, 45, 6311–6326 RSC.
- M. X. Wu, L. S. Chong, D. H. Perlman, A. C. Resnick and D. Fiedler, Proc. Natl. Acad. Sci. U. S. A., 2016, 113, E6757–E6765 CrossRef CAS PubMed.
- A. Chakraborty, M. A. Koldobskiy, N. T. Bello, M. Maxwell, J. J. Potter, K. R. Juluri, D. Maag, S. Kim, A. S. Huang, M. J. Dailey, M. Saleh, A. M. Snowman, T. H. Moran, E. Mezey and S. H. Snyder, Cell, 2010, 143, 897–910 CrossRef CAS PubMed.
- R. Bhandari, K. R. Juluri, A. C. Resnick and S. H. Snyder, Proc. Natl. Acad. Sci. U. S. A., 2008, 105, 2349–2353 CrossRef CAS PubMed.
- U. Padmanabhan, D. E. Dollins, P. C. Fridy, J. D. York and C. P. Downes, J. Biol. Chem., 2009, 284, 10571–10582 CrossRef CAS PubMed.
- Q. Z. Zhu, S. Ghoshal, A. Rodrigues, S. Gao, A. Asterian, T. M. Kamenecka, J. C. Barrow and A. Chakraborty, J. Clin. Invest., 2016, 126, 4273–4288 CrossRef PubMed.
- C. Illies, J. Gromada, R. Fiume, B. Leibiger, J. Yu, K. Juhl, S. N. Yang, D. K. Barma, J. R. Falck, A. Saiardi, C. J. Barker and P. O. Berggren, Science, 2007, 318, 1299–1302 CrossRef CAS PubMed.
- M. Hoy, P. O. Berggren and J. Gromada, J. Biol. Chem., 2003, 278, 35168–35171 CrossRef CAS PubMed.
- G. C. Ellis-Davies, Nat. Methods, 2007, 4, 619–628 CrossRef CAS PubMed.
- C. Schultz, M. Vajanaphanich, A. T. Harootunian, P. J. Sammak, K. E. Barrett and R. Y. Tsien, J. Biol. Chem., 1993, 268, 6316–6322 CAS.
- M. Vajanaphanich, C. Schultz, M. T. Rudolf, M. Wasserman, P. Enyedi, A. Craxton, S. B. Shears, R. Y. Tsien, K. E. Barrett and A. Traynor-Kaplan, Nature, 1994, 371, 711 CrossRef CAS PubMed.
- D. Subramanian, V. Laketa, R. Muller, C. Tischer, S. Zarbakhsh, R. Pepperkok and C. Schultz, Nat. Chem. Biol., 2010, 6, 324–326 CrossRef CAS PubMed.
- M. Mentel, V. Laketa, D. Subramanian, H. Gillandt and C. Schultz, Angew. Chem., Int. Ed., 2011, 50, 3811–3814 CrossRef CAS PubMed.
- I. Pavlovic, D. T. Thakor, L. Bigler, M. S. C. Wilson, D. Laha, G. Schaaf, A. Saiardi and H. J. Jessen, Angew. Chem., Int. Ed., 2015, 54, 9622–9626 CrossRef CAS PubMed.
- I. Pavlovic, D. T. Thakor, J. R. Vargas, C. J. McKinlay, S. Hauke, P. Anstaett, R. C. Camuna, L. Bigler, G. Gasser, C. Schultz, P. A. Wender and H. J. Jessen, Nat. Commun., 2016, 7, 10622 CrossRef CAS PubMed.
- J. Miyazaki, K. Araki, E. Yamato, H. Ikegami, T. Asano, Y. Shibasaki, Y. Oka and K. Yamamura, Endocrinology, 1990, 127, 126–132 CrossRef CAS PubMed.
- S. Capolicchio, D. T. Thakor, A. Linden and H. J. Jessen, Angew. Chem., Int. Ed., 2013, 52, 6912–6916 CrossRef CAS PubMed.
- H. J. Jessen, T. Schulz, J. Balzarini and C. Meier, Angew. Chem., Int. Ed., 2008, 47, 8719–8722 CrossRef CAS PubMed.
- S. Capolicchio, H. C. Wang, D. T. Thakor, S. B. Shears and H. J. Jessen, Angew. Chem., Int. Ed., 2014, 53, 9508–9511 CrossRef CAS PubMed.
- I. Pavlovic, D. T. Thakor and H. J. Jessen, Org. Biomol. Chem., 2016, 14, 5559–5562 RSC.
- A. M. Riley, J. E. Unterlass, V. Konieczny, C. W. Taylor, T. Helleday and B. V. L. Potter, MedChemComm, 2018, 9, 1105–1113 RSC.
- O. Losito, Z. Szijgyarto, A. C. Resnick and A. Saiardi, PLoS One, 2009, 4, e5580 CrossRef.
- M. S. C. Wilson, S. J. Bulley, F. Pisani, R. F. Irvine and A. Saiardi, Open Biol., 2015, 5, 150014 CrossRef.
- R. S. Kilari, J. D. Weaver, S. B. Shears and S. T. Safrany, FEBS Lett., 2013, 587, 3464–3470 CrossRef CAS PubMed.
- A. M. Marmelstein, J. A. M. Morgan, M. Penkert, D. T. Rogerson, J. W. Chin, E. Krause and D. Fiedler, Chem. Sci., 2018, 9, 5929–5936 RSC.
Footnotes |
| † Electronic supplementary information (ESI) available. See DOI: 10.1039/c8sc03479f |
| ‡ These authors contributed equally. |
| This journal is © The Royal Society of Chemistry 2019 |

