Hyaluronic acid hydrophilic surface rehabilitating curcumin nanocrystals for targeted breast cancer treatment with prolonged biodistribution†
Peng
Ji
,
Le
Wang
,
Yiwei
Chen
,
Siqi
Wang
,
Zhenghong
Wu
 * and
Xiaole
Qi
*
Key Laboratory of Modern Chinese Medicines, China Pharmaceutical University, Nanjing 210009, China. E-mail: zhenghongwu66@cpu.edu.cn; qixiaole523@cpu.edu.cn
First published on 9th November 2019
Abstract
Due to its high therapeutic efficiency and low systemic toxicity, natural bioactive curcumin has attracted more and more attention as a potential antineoplastic drug. Although the emergence of a carrier-free nanocrystalline technology could improve the solubility and guarantee the high drug loading of curcumin, uncontrollable drug release and fast systemic metabolism are definite obstacles that hinder its further application in cancer treatment. Here, hyaluronic acid (HA) modification was carried out on the surface of curcumin nanocrystals (Cur-NC) to obtain surface reformed hydrophilic HA@Cur-NCs that exhibit prolonged biodistribution. Besides this, HA@Cur-NC shows enhanced intracellular uptake in CD44 overexpressing MDA-MB-231 cells, but reduced uptake when pre-treated with HA. The apoptotic effects, confirmed by flow cytometry, suggest that HA@Cur-NC could achieve high anticancer activity against MDA-MB-231 cells. In vivo pharmacokinetic studies suggest that the t1/2 and mean residence time (MRT) of Cur are significantly extended after the intravenous administration of HA@Cur-NC in normal rats. Moreover, HA@Cur-NC demonstrated superior anticancer effects in a murine 4T1 orthotopic breast cancer model compared with free drug and Cur-NC. Overall, these results show the potential of HA@Cur-NC as a suitable formula for use in breast cancer therapy.
1. Introduction
In terms of rate of disease, breast cancer is in first position and is second in terms of cancer-related death in women worldwide.1 According to the Lancet, in 2012, almost 1.7 million people were diagnosed worldwide, and about half a million people died from this disease. One in eight to ten women will get breast cancer during their lifetime.2 Chemotherapy is still viewed as one of the most common treatments for breast cancer in clinical practice,3 however, the effect of chemotherapy does not meet people's expectations, because chemotherapy drugs may have side effects, such as non-specific toxicity, poor solubility, free delivery in the blood and so on.4 Thankfully, naturally occurring compounds are viewed as promising therapeutic agents against malignancy due to their anticipated multimodal activities and negligible side effects.Flavonoids are such components that are found in nature and have indicated vigorous anticancer activities in various in vitro and in vivo investigations.5,6 Among them, curcumin (Cur), which can be extracted from turmeric, is one of the most plentiful dietary polyphenolic compounds that shows anticancer effects.7 Numerous investigations have shown that the anti-cancer properties of Cur are related to the transcription factors NF-κB and STAT3 in various malignant growth, including lung, cervical, prostate, breast, osteosarcoma, and liver cancers.8 Curcumin is safe in clinical studies at doses of up to 12 grams per day and has been awarded “generally recognized safety” status by the Food and Drug Administration (FDA).9 The USA National Cancer Institute (NCI) has recorded it as a third-generation chemoprevention drug for cancer.10 Although Cur has the potential to treat cancer, its clinical application is hampered by many limitations, such as its low water solubility and fast metabolism.11 To overcome these limitations, researchers have reviewed the possibility of Cur formulations, including polymer micelles, liposomes, solid dispersions, microemulsions, and nanoparticles.12–18 However, these systems are far from ideal drug delivery systems, as they cannot meet the following vital requirements simultaneously, including high drug loading, colloid stability, low toxicity, biodegradability, long-term circulation in vivo and targeted delivery.
Due to the recognition of the problem of low drug loading efficiency, a selection of drugs has been synthesized into small crystal particles called nanocrystals (NCs). Drugs with poor water solubility, such as paclitaxel (PTX) or docetaxel, often form solid particles in water. By optimizing the processing method and surface stabilizer, these insoluble drugs can be prepared into 50–300 nm NCs. The processing method can be “top-down” (decomposition of large particles with high shear pressure), “bottom-up” (nucleation of drug molecules induced by solvent or temperature conditions), or a combination of the two.19 Since the drug itself produces NCs, and a limited quantity of surface stabilizer, the drug content in the NCs is close to 100 wt%, and the NCs are considered to be “pure particles of the drug” with extremely high drug loading yields.20 As nanoparticles with high drug loading efficiency, NCs have attracted increasingly more attention in the field of nanomedicine as a means of delivering poorly water-soluble anticancer drugs. To promote favorable interaction between NCs and cancer cells (thus enhancing the delivery of NCs to cancer cells), various molecules can be used to modify the surface of the NCs. In particular, hyaluronic acid (HA) has gained significant attention as a possible surface modifier because of its low toxicity and biocompatibility. HA, which is alternately composed of D-glucuronic acid and N-acetylglucosamine, is a targeting molecule for cancer cells and is the leading binding agent of the cell surface molecule CD44, which is a surface protein widely expressed in solid tumors, including in breast cancer.21 Also, HA can improve the hydrophilicity and stability of NCs, promote tumor aggregation, and increase the uptake of NCs by cells. Due to the intrinsic instability of NCs, we therefore speculated that the use of the tumor-targeting ligand HA to shroud and stabilize drug NCs could represent an effective means of enabling their intravenous administration for anticancer therapy.
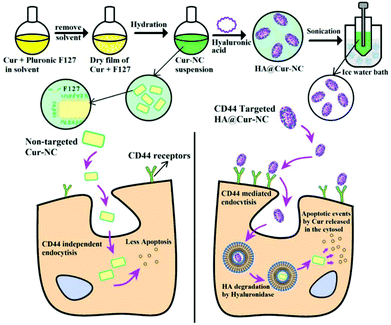
Herein, for the first time, we have developed cost-effective HA@Cur-NCs for the targeted delivery of Cur to breast cancers that express high levels of CD44 (Scheme 1). Coating the surface of the NCs with HA targeting molecules not only enhances the stability of the formulation, but also leads to the compound being able to actively target the tumor. The optimized HA-coated NC formulation (HA@Cur-NCs) has a uniform morphology and high drug loading (DL).
2. Materials and methods
2.1 Materials
Curcumin (Cur, MW = 368.39, purity ≥99%) was purchased from Kang Weisheng Biotech Co., Ltd (Nanjing, China). Hyaluronic acid (MW = 36–1400 kDa) was offered by Shandong Freda Biochem Co., Ltd (Shandong, China). Pluronic F127 (F127) was obtained from Shanghai Concord Chemical Co., Ltd. N-Hydroxy succinimide (NHS) and 1-ethyl-(3-dimethyl aminopropyl) carbodiimide (EDC) were purchased from China Pharmaceutical Group Chemical Reagents Co., Ltd. Dimethyl sulfoxide (DMSO) and MTT were provided by Sigma (St Louis, MO, USA). Dulbecco's modified eagle medium (DMEM), penicillin–streptomycin, and fetal bovine serum were purchased from Gibco BRL (Gaithersburg, MD, USA).Human normal breast cells (MCF10A), human breast cancer cell lines (MDA-MB-231, MCF-7) and the mouse breast cancer cell line 4T1 were obtained from the American Type Culture Collection (ATCC). Female Sprague Dawley (SD) rats (200–250 g) and female Balb/c mice (4–5 weeks old) were obtained from the Laboratory Animal Center of China Pharmaceutical University.
All animal procedures were performed in accordance with the Guidelines for the Care and Use of Laboratory Animals of China Pharmaceutical University and approved by the Animal Ethics Committee of China Pharmaceutical University.
2.2 Preparation of the HA@Cur-NCs
HA@Cur-NCs were prepared in two steps: crystallization in a medium containing surfactant and after, surface coating with HA. The first step was carried out following a previously reported method with modification.22 In short, 6 mg of Cur and 24 mg of Pluronic F127 were completely dissolved in a mixture of 3 mL of chloroform and 1 mL of ethanol in a round-bottom flask. Then, a film was formed on a bottle wall by drying the mixture at 40 °C for 15 min in a rotary evaporator under vacuum (RE-85A rotary evaporator, Yuhua Instrument, China). The Cur/surfactant film was hydrated with water and treated ultrasonically in a water bath for 1 min. In an ice bath, the Cur-NC suspension was further probe-sonicated for 5 min, at an amplitude of 40%, with a duty cycle of 4![[thin space (1/6-em)]](https://www.rsc.org/images/entities/char_2009.gif) :
:![[thin space (1/6-em)]](https://www.rsc.org/images/entities/char_2009.gif) 1 every 5 seconds. In the second step, the Cur-NCs were coated with HA (MW = 570 kDa) using the nanoprecipitation method previously reported by our group.23 Briefly, 10 mg of HA was dissolved in 4 mL of deionized water, and then 0.5 mL of Cur-NCs (5 mg mL−1) were added, and the solution was stirred for 15 min to be thoroughly mixed. Then, 6.8 mL of acetone was added, and the solution was stirred for 15 min. Subsequently, 4 mg of EDC·HCl and 2 mg of ADH were dissolved in 0.1 mL of deionized water and were added for cross-linking. After stirring for 30 min, a further 6.55 mL of acetone was added into the solution, which was then continuously stirred for 3 h. Finally, the acetone was evaporated using a rotary evaporator. The solution was freeze-dried prior to further use.
1 every 5 seconds. In the second step, the Cur-NCs were coated with HA (MW = 570 kDa) using the nanoprecipitation method previously reported by our group.23 Briefly, 10 mg of HA was dissolved in 4 mL of deionized water, and then 0.5 mL of Cur-NCs (5 mg mL−1) were added, and the solution was stirred for 15 min to be thoroughly mixed. Then, 6.8 mL of acetone was added, and the solution was stirred for 15 min. Subsequently, 4 mg of EDC·HCl and 2 mg of ADH were dissolved in 0.1 mL of deionized water and were added for cross-linking. After stirring for 30 min, a further 6.55 mL of acetone was added into the solution, which was then continuously stirred for 3 h. Finally, the acetone was evaporated using a rotary evaporator. The solution was freeze-dried prior to further use.
2.3 Characterization of the HA@Cur-NCs
![[thin space (1/6-em)]](https://www.rsc.org/images/entities/char_2009.gif) :
:![[thin space (1/6-em)]](https://www.rsc.org/images/entities/char_2009.gif) 50 mixture of anhydrous ethanol and water at a concentration of 2 to 6 μg mL−1 and then centrifuged at 8000g for 30 min. The supernatant was measured at 426 nm using a UV spectrophotometer (Fig. S1†).
50 mixture of anhydrous ethanol and water at a concentration of 2 to 6 μg mL−1 and then centrifuged at 8000g for 30 min. The supernatant was measured at 426 nm using a UV spectrophotometer (Fig. S1†).
![[thin space (1/6-em)]](https://www.rsc.org/images/entities/char_2009.gif) 000g for 30 min. Spectrophotometry was utilized to analyze the supernatant from each sample at 549 nm for the determination of the unbound dye. The slopes of the straight lines obtained from a plot of the Rose Bengal partition quotient (the ratio of the amount adsorbed and the initial amount) versus the membrane surface area were used to measure the degree of surface hydrophobicity. The greater the slope means the greater the relative hydrophobicity.
000g for 30 min. Spectrophotometry was utilized to analyze the supernatant from each sample at 549 nm for the determination of the unbound dye. The slopes of the straight lines obtained from a plot of the Rose Bengal partition quotient (the ratio of the amount adsorbed and the initial amount) versus the membrane surface area were used to measure the degree of surface hydrophobicity. The greater the slope means the greater the relative hydrophobicity.
2.4 Cell culture and treatment
Human normal breast cells (MCF10A), human breast cancer cell lines (MDA-MB-231, MCF-7) and the mouse breast cancer cell line 4T1 were cultured under a 5% CO2 atmosphere at 37 °C in DMEM supplemented with 10% FBS and penicillin–streptomycin (100 IU mL−1–100 μg mL−1). Among them, MDA-MB-231 and 4T1 are breast cancer cell lines with high expression of CD44 (CD44+), and MCF-7 is a breast cancer cell line with a low expression of CD44 (CD44−).To further evaluate the cellular pharmacodynamics of the preparation, MDA-MB-231, 4T1, and MCF-7 cells were inoculated in a 96-well plate (3 × 10⁵ cells per mL) and incubated overnight at 37 °C in 5% CO2/95% air for cell attachment. The cells were treated with different Cur formulations (10, 20, 40, 60, 80, and 100 μg mL−1) for 24 h. The MTT assay was selected to determine the cytotoxicity, and Graphpad Prism 7.0 was used to calculate the IC50 values.
To ascertain that the uptake of the HA@Cur-NCs takes place via CD44 receptors, a receptor blocking study was performed in CD44 positive MDA-MB-231 (CD44+), 4T1 (CD44+) cells and MCF-7 (CD44−) cells with low expression.28 For this, an excess of HA (1 mg mL−1) was added to the cell culture media for 1 h before treatment with the HA@Cur-NCs. Then, the MDA-MB-231, 4T1, and MCF-7 cells were treated with the HA@Cur-NCs (100 μg mL−1 Cur) for 4 h and observed by confocal microscopy. The fluorescence intensity was quantified using ImageJ software.
Confocal laser scanning microscopy (CLSM) was performed to study the subcellular distribution of the nanocrystals after endocytosis. Firstly, the MDA-MB-231 cells were seeded at 1 × 10⁵ cells per well for 12 h. After that, each well was incubated with the HA@Cur-NCs for different durations, and the final concentration of Cur was 100 μg mL−1. Finally, the cells were stained using Hoechst 33342 (10 μg mL−1, Beyotime Biotechnology, China) for 15 min and Lyso-Tracker Green (1 mM, Beyotime Biotechnology, China) for 30 min. The intracellular Cur distribution was investigated using CLSM (LSM700, Carl Zeiss, Germany).
2.5 Animal studies
![[thin space (1/6-em)]](https://www.rsc.org/images/entities/char_2009.gif) 000g for 5 min at high speed and filtered the supernatant using a 0.22 μm filter. Finally, the Cur concentration in the supernatant was determined by high-performance liquid chromatography (HPLC) based on a previously reported30 and an established analytical method (Fig. S2†). Various pharmacokinetic parameters were calculated with the help of DAS2.0 software, including AUC, MRT, t1/2, Cmax, CL, and V.
000g for 5 min at high speed and filtered the supernatant using a 0.22 μm filter. Finally, the Cur concentration in the supernatant was determined by high-performance liquid chromatography (HPLC) based on a previously reported30 and an established analytical method (Fig. S2†). Various pharmacokinetic parameters were calculated with the help of DAS2.0 software, including AUC, MRT, t1/2, Cmax, CL, and V.
2.6 Safety profiles
According to the formula, As is the absorbance of the samples, and Ap and An are the absorbances of the positive and negative controls, respectively. If the A% hemolysis ratio is less than 5%, it was considered nontoxic.
2.7 Statistical analysis
All data were examined using SPSS statistics 17.0 software and expressed as means ± standard deviation (SD). The statistical significance was analyzed using Student's t-test; *p < 0.05 was considered as the minimal level of significance.3. Results and discussion
3.1 Preparation and characterization of the HA@Cur-NCs
First, as previously mentioned, HA@Cur-NCs were prepared following a two-step method.22,23 As illustrated in Scheme 1, a mixture of chloroform and ethanol was used to dissolve Cur and F127 and then the solution was evaporated to form a dry film. Incipient Cur-NCs were formed by hydration of the film. In the hydration process, F127, a triblock copolymer of poly(ethylene oxide)-poly(propylene oxide)-poly(ethylene oxide) (PEO-PPO-PEO), began to dissolve and adsorb onto the surfaces of the NCs through the hydrophobic PPO block to expose the hydrophilic PEO domains to water. F127 exists at the interface between the initial NCs and the medium, which effectively inhibits crystal growth and agglomeration. Systematically, Liu et al. have observed the formation of large crystals without F127 and determined the pivotal role of F127 in the formation of small NCs.31,32 In the second step, a nanoprecipitation method was adopted to coat the Cur-NCs with HA, and an Ultrafree®-CL centrifugal device (0.1 μm) was utilized to remove the redundant HA and F127. In the synthesis of HA@Cur-NCs, EDC activated the carboxyl group of the HA and provided an O-acylisourea derivative to react with the two primary amines on ADH to form a peptide bond, resulting in adjacent HA chains becoming curved and cross-linked in the acetone–water system.33 The interaction between HA and Cur-NC can be explained via the intermolecular hydrogen bonding forces or van der Waals forces between them. According to the ESI in Tables S1–S3,† the weight ratio of Cur to F127 applied for the preparation of the Cur-NCs in this study was 1![[thin space (1/6-em)]](https://www.rsc.org/images/entities/char_2009.gif) :
:![[thin space (1/6-em)]](https://www.rsc.org/images/entities/char_2009.gif) 4. When further fabricated with HA, the molecular weight of HA was chosen as 570 kDa, and the weight ratio of HA to Cur-NCs was set as 4
4. When further fabricated with HA, the molecular weight of HA was chosen as 570 kDa, and the weight ratio of HA to Cur-NCs was set as 4![[thin space (1/6-em)]](https://www.rsc.org/images/entities/char_2009.gif) :
:![[thin space (1/6-em)]](https://www.rsc.org/images/entities/char_2009.gif) 1. The size of the optimized HA@Cur-NC nanoparticles was found to be 161.85 ± 1.70 nm, with a polydispersity index (PDI) of 0.25 ± 0.02.
1. The size of the optimized HA@Cur-NC nanoparticles was found to be 161.85 ± 1.70 nm, with a polydispersity index (PDI) of 0.25 ± 0.02.
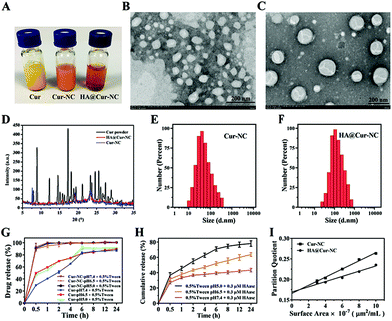
The appearances of the Cur, Cur-NCs, and HA@Cur-NCs are shown in Fig. 1A. The transmission electron microscopy (TEM) images of Cur-NC show an irregular shape (Fig. 1B), while, after surface modification with HA, the HA@Cur-NCs show a regular core–shell structure with an average size of about 150 nm (Fig. 1C). These results can be explained by the effect of hydrophilic HA chains, which are absorbed on the surface of the Cur-NCs to form a hydration layer coverage, resulting in relatively smooth edges of the HA@Cur-NC nanoparticles. When PXRD patterns were assessed, the Cur powder displayed multiple sharp peaks, indicative of a crystalline solid, while the HA@Cur-NC pattern showed increased peak intensities, characteristic of surface-bound HA (Fig. 1D). For a colloidal administration system, the particle size is the main factor that affects the biological distribution in vivo. A narrower particle size distribution or smaller PDI values are also essential to improve the stability of these systems by reducing the Ostwald ripening effect.34 DLS analysis showed that the average hydrodynamic diameters of the Cur-NCs and HA@Cur-NCs were 101.4 ± 7.4 nm and 161.9 ± 1.7 nm, respectively (Fig. 1E, F, and Table S4†). The PDIs of the Cur-NCs and HA@Cur-NCs were found to be 0.33 and 0.25, respectively, indicating the narrow size distributions of these particles. The surface zeta potential of the HA@Cur-NCs was found to be −25.0 ± 0.8 mV, indicating excellent physical stability. The surface zeta potential of the HA@Cur-NCs was found to be smaller than that of the Cur-NCs, which is likely due to the negative potential of HA. The Cur content in the HA@Cur-NCs was found to be 3.3 ± 0.5 wt% (n = 3). The long-term stability of different formulations was evaluated in PBS, and FBS. Since FBS may affect the measurement of size, a previously reported method was used to monitor the agglomeration of the particles.22 DLS was used to measure the particle size in PBS (Fig. S3A†), and particle aggregation was evaluated by measuring the absorbance at 560 nm in both PBS (Fig. S3B†) and FBS (Fig. S3C†). The HA@Cur-NCs were stable for at least 48 h in both types of media, while the Cur-NCs agglomerated immediately, indicating that the HA coating significantly improves the stability of the Cur-NCs.
The controlled release of drug loading in the tumor area is the key performance index of nanoparticles in cancer treatment.35 To simulate normal physiological conditions, the tumor microenvironment and subcellular endosome, buffers with pH values at 5.0, 6.5, and 7.4 were used in the drug release test, respectively. The results of the in vitro drug release are shown in Fig. 1G and H. When the pH was 5.0, and in the absence of HAase, the release rate was less than 10%. With an increase in the HAase concentration, the release rate increased gradually before eventually stabilizing, indicating that the HA@Cur-NCs can only be released in tumor matrix when the level of HAase is high, and the release rate and degree of release depend on the level of HAase (Fig. S4†). As expected, actual drug release was promoted under acidic conditions. The Cur release of the HA@Cur-NCs showed a relatively slow release with less than 40% at pH 7.4, while approximately 80% of the Cur could be rapidly released at pH 5.0. These results suggest that the HA@Cur-NCs release less of the drug in healthy systemic circulation, with fewer toxic side effects on healthy tissues. When the HA@Cur-NCs were swallowed into the cancer cells to reach the endosome, a higher concentration of HAase gradually degraded the HA, on the outer surface of the Cur-NCs and exposed the Cur-NCs, to release a large amount of the drug to kill cancer cells. Thus, the HA@Cur-NCs have the potential to release Cur at tumor sites in a weak acidic environment, and acid-induced Cur release can be attributed to the degradation of the HA. Furthermore, to investigate the relative surface hydrophilicity/hydrophobicity of the Cur-NCs and HA@Cur-NCs. The linear plots of Rose Bengal partition quotient versus membrane surface area are shown in Fig. 1I. The slope for the Cur-NCs and HA@ Cur-NCs have values of 0.0099 and 0.0063, which suggest a degree of surface hydrophobicity. It is not difficult to find that the slopes of the Cur-NCs and HA@Cur-NCs are relatively small, indicating that the nanocrystals can improve the water solubility of Cur, and that the water solubility is further improved after HA coating.
3.2 In vitro cellular toxicity tests and antitumor activity
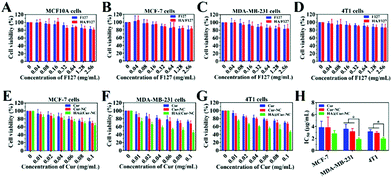
The cytotoxicity of the drug delivery system is one of the vital evaluation factors for the application of nanomaterials in vivo.36 First of all, we evaluated the biocompatibility of the carrier by MTT assay. The cytotoxicity of drug-free HA/F127 to both cancer cells (MCF-7, MDA-MB-231, and 4T1) and healthy cell (MCF10A) was accessed (Fig. 2A, B, C and D). Cells were incubated with F127 and HA/F127 with different concentrations, and cell viabilities were evaluated after 24 h of incubation. F127 and HA/F127 were almost nontoxic to both normal and cancer cells, and all of the cell viabilities were as high as 85%, even at a high concentration of 2.56 mg mL−1, which certifies the low toxicity and excellent biocompatibility of the blank nanocarriers. After that, the potential anticancer activity of the HA@Cur-NCs was evaluated for the MDA-MB-231 and MCF-7 cell lines over 24 h. For all of the tested formulations, the cell viabilities were significantly inhibited in a concentration-dependent manner (Fig. 2E–G), and the IC50 values were calculated with nonlinear regression (curve fit) of the cytotoxicity data using the sigmoidal dose–response (variable slope) equation in the Graphpad Prism software (Table S5†). Furthermore, the HA@Cur-NCs exhibited the most potent inhibiting effect. The IC50 value of the HA@Cur-NCs was lower than those of the free Cur and Cur-NCs on the MCF-7, MDA-MB-231, and 4T1 cell line (Fig. 2H). Besides this, the IC50 values of the HA@Cur-NCs on the MDA-MB-231 and 4T1 cells was significantly lower than that on the MCF-7 cells. These results suggest that HA coating may allow the HA@Cur-NCs to specifically target CD44 over-expressed cancer cells (MDA-MB-231), resulting in enhanced cytotoxicity.37,383.3 Cellular uptake, subcellular distribution and internalization mechanism
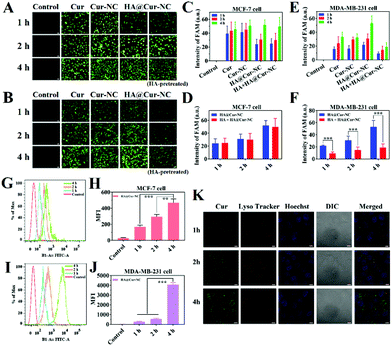
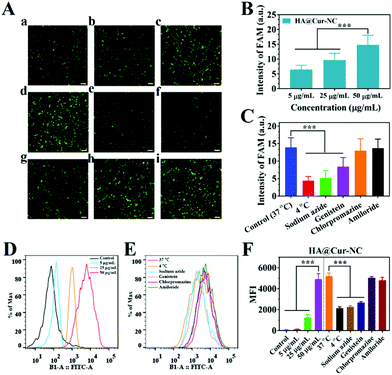
Efficient cellular uptake is necessary for the drug to have therapeutic efficacy.39 To verify whether the HA@Cur-NCs could be effectively internalized by cancer cells via CD44, the cell uptake was studied in MCF-7, MDA-MB-231, and 4T1 cells, in which CD44 was highly expressed in MDA-MB-231 and 4T1 cells, but had low expression in MCF-7 cells.40 The results of the MCF-7, MDA-MB-231 and 4T1 cell lines from fluorescence microscopy show that the HA@Cur-NCs were swallowed in a time-dependent manner (Fig. 3A–F and S5†). The quantitative flow cytometry results also led to a similar observation (Fig. 3G–J). To further confirm the CD44 receptor-mediated uptake and tumor-targeting ability of the HA@Cur-NCs, we performed receptor blocking studies in the MCF-7, MDA-MB-231 and 4T1 cells in the presence of HA. In this case, the CD44 receptor on the cell membrane is blocked by the binding of HA, resulting in increased internalization of the nanoparticles.41,42 As expected, the green fluorescence in the MDA-MB-231 and 4T1 cells exhibited a significant decrease upon preincubation with HA (Fig. 3E, F, S5B and S5C†). Conversely, the fluorescence in MCF-7 cells showed negligible change regardless of whether the media contained HA or not (Fig. 3C and D). These results indicate that surface coating with HA is a critical factor for tumor cell recognition, further confirming the targeting ability of the HA@Cur-NCs towards CD44-overexpressed tumor cells. Fig. 3K illustrates the observation on the tracking of the subcellular distribution of the HA@Cur-NCs after being co-incubated for 1, 2, and 4 h, respectively. LysoTracker™ red was used to stain the lysosomes, the nuclei were stained with Hoechst 33342 (blue), and the Cur emitted green fluorescence. As time passed, the fluorescence intensities in the MDA-MB-231 cells increased; for example, the fluorescence intensities that appeared from the cytoplasm were higher at 4 h compared to those at 1 and 2 h, which suggests that the uptake behavior in the MDA-MB-231 cells is time-dependent. Based on the above results, the HA@Cur-NCs possess excellent cellular uptake due to the presence of HA and CD44 receptor-mediated uptake.In general, cell uptake efficiency is affected by various factors, such as different culture time, different concentrations, varying temperatures, and different inhibitors such as amiloride (micropinocytosis), sodium azide (energy-dependent endocytosis), genistein (caveolae-mediated endocytosis), and chlorpromazine (clathrin-mediated endocytosis).43 To investigate the possible internalization mechanism, the HA@Cur-NCs were explored after pretreatment with various endocytic inhibitors in the MDA-MB-231 cell line. The results of fluorescence microscopy show that the uptake of the HA@Cur-NCs is concentration-dependent from 5 to 50 μg mL−1 (Fig. 4A and B). The rapid uptake at low concentrations is due to the HA-coated surface of the Cur-NCs, which enhances receptor-mediated endocytosis. The amount of cell uptake of the HA@Cur-NCs was reduced after lowering the temperature or pre-treatment with the energy inhibitor sodium azide (Fig. 4A and C). This suggests that the uptake of the HA@Cur-NCs possibly involves transport proteins, which may be related to energy-dependent processes.44 Finally, the absorption mechanism of the HA@Cur-NCs was studied by adding different inhibitors. Among the three endocytic inhibitors, cells treated with genistein significantly down-regulated the internalization of the HA@Cur-NCs (Fig. 4A and C), which further confirms the caveolae-mediated endocytosis pathway. Consistent with the qualitative analysis, the quantitative analysis by FCM also showed similar trends (Fig. 4D–F). According to the results, we believe that HA coating significantly increases the proportion of HA@Cur-NCs entering the cell via the caveolin-dependent endocytic pathway, thus helping to prevent the degradation of lysosomal enzymes.
3.4 Cell apoptosis and cell-cycle analysis
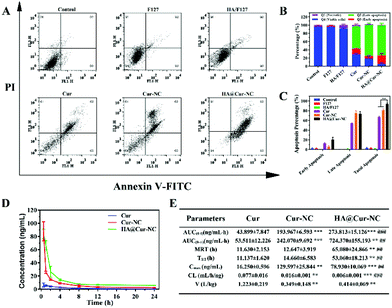
Since cell apoptosis is one of the primary mechanisms leading to cancer cell death, it is essential to evaluate the apoptotic cell potential of different preparations.45 We employed a well-reported Annexin V-FITC/PI apoptosis detection and cell cycle distribution assay by flow cytometry to further support the cytotoxicity assay. The results show that the HA@Cur-NCs induce the highest apoptosis in the MDA-MB-231 cells after 24 h, amounting to 80% apoptosis compared to other groups (Fig. 5A–C). Undoubtedly, the significantly enhanced cancer cell inhibition of the HA@Cur-NCs can be mainly attributed to the caveolin-dependent endocytic pathway tumor-targeted cell uptake, and the release of more Cur to induce cell death, which is consistent with the above results of the in vitro cytotoxicity tests. Moreover, cell cycle analysis showed that MDA-MB-231 cells treated with HA@Cur-NCs led to an apparent S and G2 phase arrest (Fig. S6†), causing more cells to repair damaged DNA.3.5 Pharmacokinetics
To investigate whether the HA coating could improve the stability of HA@Cur-NCs during blood circulation, we intravenously injected various Cur formulations to study the pharmacokinetic behavior in mice. The average plasma concentration–time curve of different Cur formulations is plotted in Fig. 5D and the corresponding pharmacokinetic parameters are summarized in Fig. 5E. The blood elimination half-life of Cur, Cur-NCs, and HA@Cur-NCs was found to be 11.14 ± 1.63 h, 14.66 ± 6.58 h, and 53.06 ± 18.21 h, respectively. Compared with the other two groups, the concentration of Cur in plasma decreased more slowly in the HA@Cur-NC group. After HA was coated on the surface of the Cur-NCs, the level of Cur in plasma remained the same for a long time, even 24 h after administration, which is beneficial to improve the retention of drugs in the systemic circulation and promote the accumulation of drugs at the tumor site.46,47 It is pretty clear that the area under the plasma concentration curves (AUC) of the HA@Cur-NCs is almost 6.3-fold higher than that of Cur, which verifies that the HA@Cur-NCs have good bioavailability. The remarkable improvement in the pharmacokinetics of the HA@Cur-NCs might be attributed to the practical coating of HA, which not only has excellent stability, but also can inhibits drug leakage in vivo.483.6 In vivo antitumor effect
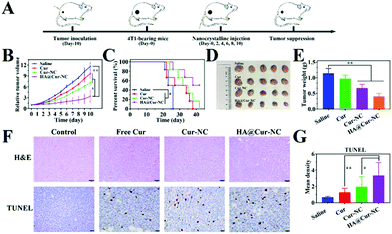
Encouraged by the inhibitory activity of the HA@Cur-NCs and their high cell uptake in vitro, we further proceeded to assess their potential anti-tumor efficiency in vivo by establishing a subcutaneous 4T1 tumor-bearing xenograft mice model. The 4T1 cell line exhibits an aggressive growth pattern, which recapitulates the hallmarks of clinical breast cancer.49 After treatment with different formulations every 2 days for 10 days (Fig. 6A), the tumor volume curve showed decelerated tumor growth in the Cur-NC and HA@Cur-NC groups. In particular, the HA@Cur-NC group showed the best antitumor performance (Fig. 6B), consistent with the above-enhanced cytotoxicity test. The superior antitumor capacity of the HA@Cur-NCs can be attributed to the prolonged enhanced permeability and retention (EPR) half-life and CD44-mediated accumulation in the tumor, which enhance the antitumor effect.50 After the whole regimen, the mice were sacrificed, and the excised tumors were weighed and recorded (Fig. 6D and E), where the tumor weight in the HA@Cur-NC group also exhibited the highest anticancer effect among these formulations. The smallest tumor was observed in the HA@Cur-NC group, further confirming the good antitumor performance of the HA@Cur-NCs. Besides this, the HA@Cur-NC group significantly prolonged the survival rate (Fig. 6C).Regarding the underlying mechanism of different treatments at the molecular level, hematoxylin and eosin (H&E) staining revealed that massive cell necrosis with nuclear rupture and nucleoplasm atrophy occurred mostly in the HA@Cur-NC group (Fig. 6F), further implying that the HA@Cur-NCs can effectively suppress tumor growth. To also further investigate the extent of apoptotic cell death at the tumor site, terminal deoxynucleotidyl transferase dUTP nick end labeling (TUNEL) assay was conducted to analyze the tumor tissues at the end of the efficacy experiment (Fig. 6F, D and Table S6†). The apoptosis degree can be ranked as follows: HA@Cur-NCs > Cur-NCs > free Cur > saline. This order is consistent with the in vitro apoptosis assay results, indicating that the HA@Cur-NC group enhanced the extensive apoptosis and necrosis of tumors compared with the other treatments.
3.7 Safety profiles
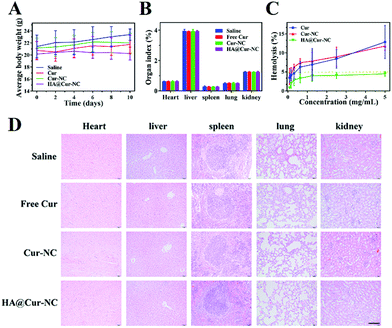
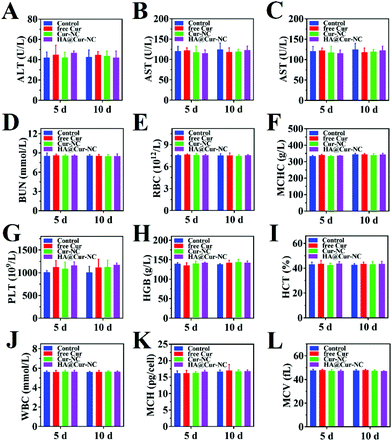
To further evaluate the potential of the HA@Cur-NCs in biomedical applications, we assessed the formulation for possible biosafety and adverse effects after treatment for 10 days. For all formulations, no apparent body weight loss was observed in the mice throughout the experimental period, indicating no serious negative impact, indicating the good in vivo biocompatibility of the HA@Cur-NCs (Fig. 7A). Also, no significant differences were observed in the organ indexes of the heart, liver, spleen, lung, and kidney, indicating no significant toxicity to major organs (Fig. 7B). Additionally, the HA@cur-NCs were found to be biocompatible with blood because hemolysis does not occur when blood cells are incubated with the HA@cur-NCs, while the Cur and Cur-NC groups were slightly hemolytic at high concentrations (Fig. 7C). The results show that the coating of hyaluronic acid on the surface of the Cur-NCs can effectively improve their biocompatibility.51 In the H&E staining sections of major exposed organs, the results show no noticeable pathological changes or damages, which further confirms the excellent biocompatibility of the HA@Cur-NCs (Fig. 7D). Besides this, biochemical blood measurements of alkaline phosphatase (ALP), alanine aminotransferase (ALT), aspartate aminotransferase (AST) and blood urea nitrogen (BUN) were all found to be at normal levels, with no significant differences compared to those of the control group (Fig. 8A–D), indicating that treatment did not impair liver and kidney function. More importantly, routine blood tests showed no meaningful changes between the HA@Cur-NC groups and the control group (Fig. 8E–L). In summary, the HA@Cur-NCs show no significant adverse reactions in long-term treatment, indicating their potential as a safe candidate for breast cancer therapy.4. Conclusions
In summary, HA@Cur-NCs, a novel carrier-free nanoparticle formulation of Cur, was developed successfully through coating Cur-NCs with HA for targeting breast cancer therapy. HA@Cur-NCs demonstrated the advantage of high drug loading capacity and stability. Compared to Cur-NCs, HA@Cur-NCs showed enhanced cellular interaction, uptake, and cytotoxicity in breast cancer models in vitro. It was also confirmed that HA better targets CD44 expressed on cancer cells and enhances the internalization efficiency via caveolae-mediated endocytic mechanisms. Pharmacokinetic studies confirmed that HA@Cur-NCs can significantly improve the bioavailability of Cur and prolong the retention time of Cur in vivo. Furthermore, the in vivo antitumor activity in 4T1 tumor-bearing mice revealed pronounced therapeutic efficacy with negligible systemic adverse effects. As a consequence, our findings suggest that HA@Cur-NCs is a promising new candidate for future clinical breast cancer applications.Conflicts of interest
There are no conflicts to declare.Acknowledgements
This study was supported by the National Natural Science Foundation of China (No. 51472115), the Top-notch Academic Programs Project of Jiangsu Higher Education Institutions (PPZY2015B164), the Double first-class innovation team of China Pharmaceutical University (CPU2018GY40), and the Jiangsu Provincial Graduate Research Innovation and Practice Project (KYCX18_0760).Notes and references
- J. E. Park, J. Park, Y. Jun, Y. Oh, G. Ryoo, Y. S. Jeong, H. H. Gadalla, J. S. Min, J. H. Jo, M. G. Song, K. W. Kang, S. K. Bae, Y. Yeo and W. Lee, J. Controlled Release, 2019, 302, 148–159 CrossRef CAS PubMed.
- N. Harbeck and M. Gnant, Lancet, 2017, 389, 1134–1150 CrossRef.
- X. Liu, C. Wang, H. Ma, F. Yu, F. Hu and H. Yuan, Adv. Healthcare Mater., 2019, 8, e1801486 CrossRef PubMed.
- Z. Shi, X. Chen, L. Zhang, S. Ding, X. Wang, Q. Lei and W. Fang, Biomater. Sci., 2018, 6, 2582–2590 RSC.
- D. Raffa, B. Maggio, M. V. Raimondi, F. Plescia and G. Daidone, Eur. J. Med. Chem., 2017, 142, 213–228 CrossRef CAS PubMed.
- P. Sadhukhan, M. Kundu, S. Chatterjee, N. Ghosh, P. Manna, J. Das and P. C. Sil, Mater. Sci. Eng., C, 2019, 100, 129–140 CrossRef CAS PubMed.
- J. Hong, Y. Liu, Y. Xiao, X. Yang, W. Su, M. Zhang, Y. Liao, H. Kuang and X. Wang, Drug Delivery, 2017, 24, 109–120 CrossRef CAS PubMed.
- Y. Sun, X. Li, L. Zhang, X. Liu, B. Jiang, Z. Long and Y. Jiang, Mol. Pharmaceutics, 2019, 16, 1140–1155 CrossRef CAS PubMed.
- C. D. Lao, M. T. R. Iv, D. Normolle, D. D. Heath, S. I. Murray, J. M. Bailey, M. E. Boggs, J. Crowell, C. L. Rock and D. E. Brenner, BMC Complementary Altern. Med., 2006, 6, 1–4 CrossRef PubMed.
- M. Churchill, A. Chadburn, R. T. Bilinski and M. M. Bertagnolli, J. Surg. Res., 2000, 89, 169–175 CrossRef CAS PubMed.
- S. Guerrero, M. Inostroza-Riquelme, P. Contreras-Orellana, V. Diaz-Garcia, P. Lara, A. Vivanco-Palma, A. Cardenas, V. Miranda, P. Robert, L. Leyton, M. J. Kogan, A. F. G. Quest and F. Oyarzun-Ampuero, Nanoscale, 2018, 10, 22612–22622 RSC.
- A. Mukerjee, A. P. Ranjan and J. K. Vishwanatha, J. Biomed. Nanotechnol., 2016, 12, 1374–1392 CrossRef CAS PubMed.
- L. Duse, M. R. Agel, S. R. Pinnapireddy, J. Schafer, M. A. Selo, C. Ehrhardt and U. Bakowsky, Pharmaceutics, 2019, 11, E282 CrossRef PubMed.
- M. A. Altamimi, M. Kazi, M. Hadi Albgomi, A. Ahad and M. Raish, Drug Dev. Ind. Pharm., 2019, 45, 1073–1078 CrossRef CAS PubMed.
- M. Zhang, B. Zhuang, G. Du, G. Han and Y. Jin, J. Pharm. Pharmacol., 2019, 71, 1044–1054 CrossRef CAS PubMed.
- E. Baghdan, L. Duse, J. J. Schuer, S. R. Pinnapireddy, M. Pourasghar, J. Schafer, M. Schneider and U. Bakowsky, Eur. J. Pharm. Sci., 2019, 132, 63–71 CrossRef CAS PubMed.
- Q. Zhang, L. Suntsova, Y. S. Chistyachenko, V. Evseenko, M. V. Khvostov, N. E. Polyakov, A. V. Dushkin and W. Su, Int. J. Biol. Macromol., 2019, 128, 158–166 CrossRef CAS.
- Q. Chen, X. Shao, Z. Tian, Y. Chen, P. Mondal, F. Liu, F. Wang, P. Ling, W. He, K. Zhang, Z. Guo and J. Diao, Nano Res., 2019, 12, 1009–1015 CrossRef CAS.
- J. Park, B. Sun and Y. Yeo, J. Controlled Release, 2017, 263, 90–101 CrossRef CAS PubMed.
- Y. Wang, Y. Zheng, L. Zhang, Q. Wang and D. Zhang, J. Controlled Release, 2013, 172, 1126–1141 CrossRef CAS PubMed.
- S. Tan, A. Yamashita, S. J. Gao and M. Kurisawa, Acta Biomater., 2019, 94, 320–329 CrossRef CAS PubMed.
- Z. Chai, D. Ran, L. Lu, C. Zhan, H. Ruan, X. Hu, C. Xie, K. Jiang, J. Li, J. Zhou, J. Wang, Y. Zhang, R. H. Fang, L. Zhang and W. Lu, ACS Nano, 2019, 13, 5591–5601 CrossRef CAS PubMed.
- M. Wu, J. Chen, H. Veroniaina, S. Mukhopadhyay, Z. Wu, Z. Wu and X. Qi, Nanomedicine, 2019, 18, 122–134 CrossRef CAS PubMed.
- V. B. Lokeshwar, P. Gomez, M. Kramer, J. Knapp, M. A. McCornack, L. E. Lopez, N. Fregien, N. Dhir, S. Scherer, D. J. Klumpp, M. Manoharan, M. S. Soloway and B. L. Lokeshwar, J. Biol. Chem., 2008, 283, 29215–29227 CrossRef CAS PubMed.
- R. Stern, Semin. Cancer Biol., 2008, 18, 275–280 CrossRef CAS PubMed.
- S. K. Sahoo, J. Panyam, S. Prabha and V. Labhasetwar, J. Controlled Release, 2002, 82, 105–114 CrossRef CAS.
- T. Zhang, H. Lip, C. He, P. Cai, Z. Wang, J. T. Henderson, A. M. Rauth and X. Y. Wu, Adv. Healthcare Mater., 2019, 8, e1900543 CrossRef PubMed.
- G. Pandey, N. Mittapelly, V. T. Banala and P. R. Mishra, ACS Appl. Mater. Interfaces, 2018, 10, 16964–16976 CrossRef CAS PubMed.
- Q. Mu, H. Wang, X. Gu, Z. R. Stephen, C. Yen, F. C. Chang, C. J. Dayringer and M. Zhang, Adv. Healthcare Mater., 2019, 8, e1801505 CrossRef PubMed.
- C. Bi, X. Q. Miao, S. F. Chow, W. J. Wu, R. Yan, Y. H. Liao, A. H. Chow and Y. Zheng, Nanomedicine, 2017, 13, 943–953 CrossRef CAS PubMed.
- Z. G. Huang, F. M. Lv, J. Wang, S. J. Cao, Z. P. Liu, Y. Liu and W. Y. Lu, Int. J. Pharm., 2019, 556, 217–225 CrossRef CAS PubMed.
- F. Liu, J. Y. Park, Y. Zhang, C. Conwell, Y. Liu, S. R. Bathula and L. Huang, J. Pharm. Sci., 2010, 99, 3542–3551 CrossRef CAS PubMed.
- A. Fakhari, Q. Phan, S. V. Thakkar, C. R. Middaugh and C. Berkland, Langmuir, 2013, 29, 5123–5131 CrossRef CAS PubMed.
- X. Yang, Y. Liu, Y. Zhao, M. Han, Y. Guo, H. Kuang and X. Wang, Int. J. Nanomed., 2016, 11, 2979–2994 CrossRef CAS PubMed.
- S. B. Alvi, T. Appidi, B. P. Deepak, P. S. Rajalakshmi, G. Minhas, S. P. Singh, A. Begum, V. Bantal, R. Srivastava, N. Khan and A. K. Rengan, Biomater. Sci., 2019, 7, 3866–3875 RSC.
- C. Fu, X. Duan, M. Cao, S. Jiang, X. Ban, N. Guo, F. Zhang, J. Mao, T. Huyan, J. Shen and L. M. Zhang, Adv. Healthcare Mater., 2019, 8, e1900047 CrossRef.
- V. T. Banala, S. Urandur, S. Sharma, M. Sharma, R. P. Shukla, D. Marwaha, S. Gautam, M. Dwivedi and P. R. Mishra, Biomater. Sci., 2019, 7, 2889–2906 RSC.
- H. Fang, X. Zhao, X. Gu, H. Sun, R. Cheng, Z. Zhong and C. Deng, Biomacromolecules, 2019, 8, 9b01012 CrossRef.
- M. H. Shin, E. Y. Park, S. Han, H. S. Jung, D. H. Keum, G. H. Lee, T. Kim, C. Kim, K. S. Kim, S. H. Yun and S. K. Hahn, Adv. Healthcare Mater., 2019, 8, e1801036 CrossRef PubMed.
- O. P. Oommen, C. Duehrkop, B. Nilsson, J. Hilborn and O. P. Varghese, ACS Appl. Mater. Interfaces, 2016, 8, 20614–20624 CrossRef CAS PubMed.
- J. G. Rosch, M. R. Landry, C. R. Thomas Jr. and C. Sun, Nanoscale, 2019, 11, 13947–13960 RSC.
- Z. Guo, X. Zhou, C. Hou, Z. Ding, C. Wen, L. J. Zhang, B. P. Jiang and X. C. Shen, Biomater. Sci., 2019, 7, 3886–3897 RSC.
- J. Yujie, X. Yanyu, X. Liu, H. Jiayu, Q. Chen, L. Weidong, W. Li, C. Rui, W. Jingjing and H. Rongfeng, Adv. Sci., 2018, 5, 1700867 CrossRef PubMed.
- Z. Chen, L. Xing, Q. Fan, A. G. Cheetham, R. Lin, B. Holt, L. Chen, Y. Xiao and H. Cui, Theranostics, 2017, 7, 2003–2014 CrossRef CAS PubMed.
- Y. Song, Y. Wang, Y. Zhu, Y. Cheng, Y. Wang, S. Wang, F. Tan, F. Lian and N. Li, Adv. Healthcare Mater., 2019, 8, e1900250 CrossRef.
- Y. Zhang, F. Wang, M. Li, Z. Yu, R. Qi, J. Ding, Z. Zhang and X. Chen, Adv. Sci., 2018, 5, 1700821 CrossRef PubMed.
- H. Xiong, J. Ni, Z. Jiang, F. Tian, J. Zhou and J. Yao, Biomater. Sci., 2018, 6, 2527–2540 RSC.
- Y. Liu, Y. Hui, R. Ran, G. Z. Yang, D. Wibowo, H. F. Wang, A. P. J. Middelberg and C. X. Zhao, Adv. Healthcare Mater., 2018, 7, e1800106 CrossRef PubMed.
- Y. Chen, J. Deng, F. Liu, P. Dai, Y. An, Z. Wang and Y. Zhao, Adv. Healthcare Mater., 2019, 8, e1900366 CrossRef PubMed.
- H. Kim, J. Cha, M. Jang and P. Kim, Biomater. Sci., 2019, 7, 2264–2271 RSC.
- C. Chen, W. Tang, D. Jiang, G. Yang, X. Wang, L. Zhou, W. Zhang and P. Wang, Nanoscale, 2019, 11, 11012–11024 RSC.
Footnote |
| † Electronic supplementary information (ESI) available. See DOI: 10.1039/c9bm01605h |
| This journal is © The Royal Society of Chemistry 2020 |

