Confined growth of 2D MoS2 nanosheets in N-doped pearl necklace-like structured carbon nanofibers with boosted lithium and sodium storage performance†
Huayu
Wu
,
Xiue
Zhang
,
Qianhui
Wu
,
Yue
Han
,
Xiaoyu
Wu
,
Penglei
Ji
,
Min
Zhou
,
Guowang
Diao
 and
Ming
Chen
 *
*
School of Chemistry and Chemical Engineering, Yangzhou University, Yangzhou 225002, P. R. China. E-mail: chenming@yzu.edu.cn
First published on 26th November 2019
Abstract
N-Doped amber necklace-like structured MoS2@carbon nanofibers (ANL MoS2@CNFs) were fabricated via the confined growth method, constructing a hierarchical structure with 1D nanofibers, 2D nanosheets, and 3D cross-linked networks. This special structure could effectively alleviate the volume effect and enhance the storage performance of lithium/sodium ion batteries.
Molybdenum disulfide (MoS2) has become a prospective candidate for lithium ion batteries (LIBs), sodium ion batteries (SIBs) and metal electrocatalytic materials due to its special 2D structure and excellent electrochemical performance.1–4 However, the rapid attenuation of capacity and low rate performance greatly limit the application of MoS2.5 Additionally, because of the unprotected surface of MoS2, MoS2 nanosheets still appear to be powdered after repeated cycles.6–8 Therefore, through loading MoS2 nanosheets on carbon materials with various structures, such as hollow nanospheres,9 nanoboxes10 and nanofibers,11 the conductivity and energy storage performance of MoS2 can be improved effectively.
In recent years, one-dimensional (1D) nanostructures have aroused great interest on account of their unique geometry and particular chemical/physical properties.12 In particular, the 1D nanostructures can significantly promote the ion transfer of the electrode material and electron conduction, and simultaneously restrict the aggregation of transition metallization in the course of lithium and sodium insertion.13–17 Currently, there are many methods to composite 2D inorganic metal materials with 1D nanofiber materials, including 2D MoS2 nanosheets directly grown on the surface of 1D nanofibers.18,19 The severe volumetric expansion of electrode materials causes cracking of composite nanofibers during the Li+ or Na+ extraction and interaction process, bringing about rapid attenuation of capacities.20–23 Hence, it is necessary to construct and synthesize new hierarchical composite nanofibers, which can supply adequate cushion space for the volumetric swelling of electrode materials during the process of charging/discharging, thereby keeping the structure stable and electrochemical performance of composite nanofibers.
In this communication, we have firstly developed a method to synthesize MoS2 nanosheets inside pearl necklace-like structured carbon nanofibers (PNL CNFs), which form interesting hierarchical amber necklace-like structured MoS2@CNFs (ANL MoS2@CNFs). When applied to anode materials in LIBs and SIBs, the ANL MoS2@CNFs show the best rate performance and highest reversible capacity, compared to MoS2 nanosheets grown on the surface of CNFs and pure MoS2.
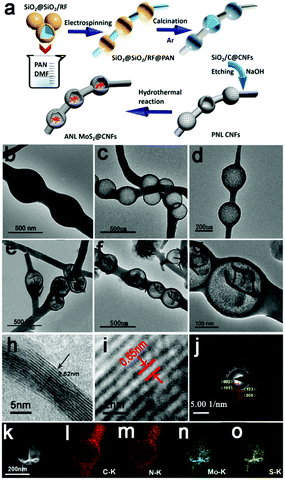
The tactic for fabricating the ANL MoS2@CNFs is demonstrated in Fig. 1a. Firstly, the core–shell structure SiO2@SiO2/RF with a uniform size of 260 ± 50 nm (Fig. S1, ESI†) was synthesized by the reaction of resorcinol-formaldehyde (RF) oligomers and tetraethyl orthosilicate.24 Secondly, the prepared SiO2@SiO2/RF nanospheres and polyacrylonitrile (PAN) were added into DMF and mixed to prepare the electrospinning solution. SiO2@SiO2/RF@PAN composite nanofibers were prepared by the electrospinning method.25 Thirdly, after calcination, the SiO2/C@CNF composite was formed. And then the pearl necklace-like structured carbon nanofibers (PNL CNFs) were obtained by the removal of SiO2 using NaOH as an etching agent. Finally, with the hydrothermal reaction, MoS2 nanosheets were grown in a confined manner inside the PNL CNFs to form typical structured-ANL MoS2@CNFs. Fig. 1b and Fig. S2a, b (ESI†) display the SiO2@C@CNF composite. Fig. 1c, d and Fig. S2c, d (ESI†) show the PNL CNFs after being etched with NaOH. The diameter of CNFs and carbon nanospheres are 100 ± 50 nm and 260 ± 50 nm, respectively. In Fig. S2e and f (ESI†), the PAN nanofibers are synthesized as comparison materials. During the hydrothermal process, the MoS2 nanoflowers grow in the cavity of PNL CNFs, denoted as ANL MoS2@CNFs, and the porous carbon layer maintains structural integrity (Fig. 1e–g and Fig. S2g, h, ESI†). Fig. 1h exhibits the lattice array of ANL MoS2@CNFs from high-resolution TEM (HRTEM), which distinctly suggests a fewer layer structure of MoS2 nanosheets. The (002) crystal plane spacing of hexagonal MoS2 is approximately 0.65 nm (Fig. 1i). Fig. 1j shows four typical diffraction ring patterns of (002), (101), (103), and (008), which correspond to the standard hexagonal MoS2.26 EDX mappings of the amber necklace-like structure exhibit the elemental distribution of C, N, Mo, and S (Fig. 1l–o). Evidently, MoS2 nanosheets are confined inside hollow carbon nanospheres and the N element is doped in the whole CNFs to form N-doped hybrid carbon fibers. From thermogravimetric analysis (TGA) (Fig. S3, ESI†), the weight fraction of MoS2 in the amber necklace-like nanofibers is 88.3%.
In addition, we synthesized the contrast material, MoS2 nanosheets, by directly growing on the surface of carbon nanofibers and the product was named as surface grown (SG) MoS2@CNFs. The synthetic strategy of SG MoS2@CNFs is displayed in Fig. S4 (ESI†). The morphology of SG MoS2@CNFs is shown in Fig. S5 (ESI†). The nitrogen adsorption/desorption analysis (BET) reveals that the ANL MoS2@CNFs are a mesoporous material (Fig. S6, ESI†), and their specific surface area (190.35 m2 g−1) is superior to that of SG MoS2@CNFs (53.43 m2g−1) (Fig. S7, ESI†). Simultaneously, we synthesized pure MoS2via the same hydrothermal method as the reference material (Fig. S8, ESI†).
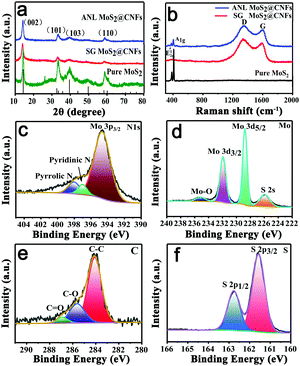
The crystal structures of pure MoS2, SG MoS2@CNFs and ANL MoS2@CNFs are measured by XRD (Fig. 2a), matching with JCPDS card No. 37-1492, which are hexagonal crystal structures.27Fig. 1h shows that the spacing of the (002) plane increases from 0.62 to 0.65 nm. NH4+ could expand the interlayer spacing.28,29 Additionally, the Raman shifts reveal that the ANL MoS2@CNF materials exhibit D and G bands corresponding to values of 1340 and 1591 cm−1,30 confirming the higher degree of graphitization (Fig. 2b). The Raman shifts at 384.2 (E12g) and 411.2 cm−1 (A1g) provide information on highly crystallized MoS2. The XPS spectrum of ANL MoS2@CNFs clearly reveals the peaks of N 1s, Mo 3d, C 1s, and S 2p (Fig. S9, ESI†).31 The N element (Fig. 2c) mainly exists as pyrrolic N, pyridinic N and Mo 3p3/2, which shows that the PAN not only acts as the source for N-doping in the carbon structure, but also reacts in the formation of a Mo–N bond between MoS2 and the carbon framework. In the high-resolution Mo 3d spectrum, Mo 3d5/2 and Mo 3d3/2 are ascribed to the peaks at 228.7 and 231.9 eV, confirming the existence of Mo4+ (Fig. 2d). From the C 1s spectrum, the binding energies of C–O, C–C and C![[double bond, length as m-dash]](https://www.rsc.org/images/entities/char_e001.gif) O are found to be 285.8, 284.3 and 287.2 eV, respectively (Fig. 2e). Two peaks at 161.5 and 162.7 eV in the S 2p spectrum are from the spin–orbit doublet of S 2p3/2 and S 2p1/2,32 respectively (Fig. 2f). Additionally, the effect of growth conditions on morphology was discussed by controlling the reaction time and precursor concentration. The TEM images of ANL MoS2@CNFs, obtained at different reaction times, display the growth evolution of MoS2 from fewer nanosheets to dense spherical structures (Fig. S10a–f, ESI†). At high precursor concentration, the TEM images of ANL MoS2@CNFs show beaded structures (Fig. S10g and h, ESI†), in which MoS2 nanosheets covered the entire cavity.
O are found to be 285.8, 284.3 and 287.2 eV, respectively (Fig. 2e). Two peaks at 161.5 and 162.7 eV in the S 2p spectrum are from the spin–orbit doublet of S 2p3/2 and S 2p1/2,32 respectively (Fig. 2f). Additionally, the effect of growth conditions on morphology was discussed by controlling the reaction time and precursor concentration. The TEM images of ANL MoS2@CNFs, obtained at different reaction times, display the growth evolution of MoS2 from fewer nanosheets to dense spherical structures (Fig. S10a–f, ESI†). At high precursor concentration, the TEM images of ANL MoS2@CNFs show beaded structures (Fig. S10g and h, ESI†), in which MoS2 nanosheets covered the entire cavity.
 | ||
| Fig. 2 (a) XRD pattern and (b) Raman spectra of pure MoS2, ANL MoS2@CNFs and SG MoS2@CNFs. (c–f) XPS spectrum of ANL MoS2@CNFs with high-resolution spectra of N 1s, Mo 3d, C 1s, and S 2p. | ||
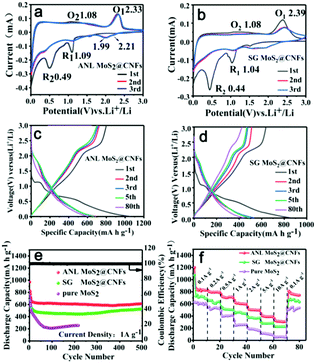
Fig. 3a exhibits the CV curves of the ANL MoS2@CNF material. During the 1st scan of reduction, the cathodic peak R1 is observed at about 1.09 V, indicating the embedding of lithium ions into MoS2 lattices (MoS2 + xLi+ + xe− → LixMoS2).33 The other cathodic peak R2 is observed at about 0.49 V, which corresponds to the formation of a solid electrolyte interface (SEI) and the subsequent process: LixMoS2 + (4 − x)Li+ + (4 − x)e− → Mo + 2Li2S.34 Contrarily, peak O2 is observed at about 1.08 V, owing to the partial oxidation of Mo metal,35 and the other broad peak O1 at 2.33 V could be ascribed to the reverse conversion reaction between Li2S and the metallic Mo matrix (Li2S − 2e− → 2Li+ + S, Li2S + Mo − 2e− → 2Li+ + MoS2).36,37 In addition, the redox peaks of ANL MoS2@CNFs during the 2nd and 3th cycles almost coincided, insinuating that the ANL MoS2@CNFs have both outstanding reversibility and stability. SG MoS2@CNFs have excellent properties as well (Fig. 3b), but the current begins to drop during the second cycle. Pure MoS2 shows poor stability as in Fig. S11a (ESI†).
From the galvanostatic charge/discharge profiles (GCD) (Fig. 3c and d), compared with the three electrodes of ANL MoS2@CNFs, SG MoS2@CNFs and pure MoS2 (Fig. S11b, ESI†) in 1st, 2nd, 3rd and 80th cycles at 1 A g−1. After the 1st cycle, the initial charge/discharge capacities of ANL MoS2@CNFs are 1049 mA h g−1 and 802 mA h g−1 (Fig. 3c), and the value of coulombic efficiency (CE) is 76.4%, respectively, which is much higher than those of SG MoS2@CNFs with a CE of 74.8% (initial capacities of 852 and 637 mA h g−1 in Fig. 3d) and pure MoS2 with a CE of 70.1% (initial capacities of 613 and 430 mA h g−1 in Fig. S11b, ESI†). Moreover, after 500 cycles, Fig. 3e shows that the ANL MoS2@CNFs retain great cyclic stability and good specific capacities (602 mA h g−1) (a CE of nearly 100% after the cyclic process), while the specific capacity of the SG MoS2@CNFs decreases to 439 mA h g−1. There is high possibility that the inferior cyclic stability of SG MoS2@CNFs contributes to the exfoliation of MoS2 nanosheets from the surface of nanofibers. Pure MoS2 nanosheets show rapid decay and ultimately maintain 246 mA h g−1. Meanwhile, we tested the cycling performance of the PNL CNFs after 500 cycles at a current density of 1 A g−1 as comparison (Fig. S12, ESI†). In Fig. 3f, the specific capacity decreases quickly for pure MoS2 nanosheets at higher current densities. The specific capacities of the SG MoS2@CNFs are 729, 610, 512, 439, 366, 279 and 227 mA h g−1 at 0.1, 0.2, 0.5, 1, 2, 5 and 10 A g−1. Relatively, the ANL MoS2@CNFs display preferable values of 840, 794, 703, 602, 501, 389 and 311 mA h g−1. Obviously, the rate performance and cyclic performance of the ANL MoS2@CNFs are better than those of SG MoS2@CNFs, pure MoS2 and PNL CNFs (Fig. S13, ESI†). By comparing the electrochemical performance of other MoS2-based anode materials listed in Table S1 (ESI†), it is clear that the ANL MoS2@CNFs are a powerful competitive candidate in terms of capacity output and cycling stability.
Fig. S14a (ESI†) exhibits the curves of electrochemical impedance spectroscopy (EIS), which detect that the ANL MoS2@CNFs exhibit the smallest semicircle arc diameter, demonstrating the lowest charge-transfer resistance (Rct) at the interfaces in contrast to SG MoS2@CNFs and pure MoS2. The calculated values of apparent diffusion coefficients (DLi+) in three materials are shown in Table S2 (for more details see Fig. S15, ESI†). It is proved that the ANL MoS2@CNFs have excellent properties. At the same time, we compared the impedance performance of two materials after different cycles. The Nyquist plots of ANL MoS2@CNFs and SG MoS2@CNFs (Fig. S14b and c, ESI†) were investigated at a fresh cell and after the 100th and 300th cycles at 1 A g−1. Although the Rct of two electrode materials gradually increases with the number of cycles, the Rct values of ANL MoS2@CNFs are always smaller than those of SG MoS2@CNFs at the same number of cycles, which display good structural stability and confirm the best reaction kinetics of ANL MoS2@CNFs than those of SG MoS2@CNFs and pure MoS2.
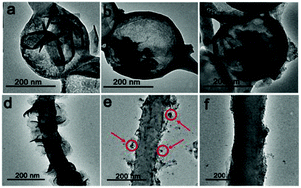
The morphology of ANL MoS2@CNFs observed after 0, 50, and 100 charge–discharge cycles is shown in Fig. 4a–c. The ANL MoS2@CNFs almost keep the structure intact, demonstrating that the free space effectively alleviates the volume effect. In the meantime, the morphology of SG MoS2@CNF electrode material is characterized by TEM (Fig. 4d–f) after 0, 50 and 100 cycles. It is found that the electrode active material is pulverized and fell off from the nanofibers. Because of the pulverization, the nanosheets were transformed into small nanoparticles around the fibers (Fig. 4e, red circles). After 100 cycles, nanoparticles cannot be even observed (Fig. 4f), indicating that the pulverization and exfoliation phenomenon of SG MoS2@CNF electrode material is due to the severe volume effect.
Based on the advantage of the ANL MoS2@CNF electrode for Li+ storage, we also reported the application of sodium ion batteries (SIBs). And all the electrochemical performance data and discussions are shown in the electronic supplementary information.
Compared with the performance of ANL MoS2@CNFs in LIBs, the storage sodium performance of ANL MoS2@CNFs is poor due to the large ionic radius and slow migration rate of Na+.
To summarize, ANL MoS2@CNFs with hierarchical structures have been prepared successfully by electrospinning, thermal treatment, etching and subsequent hydrothermal synthesis. The PNL CNFs with hollow structures acting as nanoreactors confine the growth of MoS2 nanosheets under control and restriction, which efficiently promote structural stability and the electronic conductivity of the hybrid material during the lithium and sodium insertion/extraction process. It is confirmed that the ANL MoS2@CNFs achieve excellent rate capability (501 mA h g−1 at 2 A g−1) and outstanding cyclic property (602 mA h g−1 at 1 A g−1 after 500 cycles) as anode materials for LIBs. At the same time, the ANL MoS2@CNFs exhibit good rate performance (260 mA h g−1 at 1 A g−1) and great cyclic property (340 mA h g−1 at 0.5 A g−1 after 100 cycles) as anode materials for SIBs. The inspiration of the amber necklace tactic offers an approach for the design of anode materials for LIBs and SIBs with outstanding electrochemical properties.
The funding support from the National Natural Science Foundation of China (Grant No. 21773203), the Natural Science Foundation of Jiangsu Province (BK20161329), and a Project Funded by the Priority Academic Program Development of Jiangsu Higher Education Institutions is acknowledged.
Conflicts of interest
There are no conflicts to declare.Notes and references
- C. B. Zhu, X. K. Mu, P. A. van Aken, Y. Yu and J. Maier, Angew. Chem., Int. Ed., 2014, 53, 2152–2156 CrossRef CAS PubMed.
- Y. H. Zhu, S. Yuan, D. Bao, Y. B. Yin, H. X. Zhong, X. B. Zhang, J. M. Yan and Q. Jiang, Adv. Mater., 2017, 29, 1603719 CrossRef PubMed.
- G. Wang, J. Zhang, S. Yang, F. X. Wang, X. D. Zhuang, K. Müllen and X. L. Feng, Adv. Energy Mater., 2018, 8, 1702254 CrossRef.
- F. Zhou, S. Xin, H. W. Liang, L. T. Song and S. H. Yu, Angew. Chem., Int. Ed., 2014, 53, 11552–11556 CrossRef CAS PubMed.
- K. Xie, K. Yuan, X. Li, W. Lu, C. Shen, C. L. Liang, R. Vajtai, P. Ajayan and B. Q. Wei, Small, 2017, 13, 1701471 CrossRef.
- X. E. Zhang, R. F. Zhao, Q. H. Wu, W. L. Li, L. B. Ni, H. Yan, G. W. Diao and M. Chen, ACS Nano, 2017, 11, 8429–8436 CrossRef CAS.
- T. Wang, X. T. Shen, J. F. Huang, Q. Xi, Y. X. Zhao, Q. Guo, X. Wang and Z. W. Xu, J. Mater. Chem. A, 2018, 6, 24433–24440 RSC.
- K. Zhang, P. Li, S. Y. Guo, J. Y. Jeong, B. J. Jin, X. M. Li, S. L. Zhang, H. B. Zeng and J. H. Park, J. Mater. Chem. A, 2018, 6, 22513–22518 RSC.
- M. Z. Hou, Y. T. Qiu, G. F. S. Yan, J. M. Wang, D. Zhan, X. Liu, J. C. Gao and L. F. Lai, Nano Energy, 2019, 62, 299–309 CrossRef CAS.
- Z. Li, Y. J. Fang, J. T. Zhang and X. W. Lou, Adv. Mater., 2018, 30, e1800525 CrossRef.
- B. R. Jia, Q. Y. Yu, Y. Z. Zhao, M. L. Qin, W. Wang, Z. W. Liu, C.-Y. Lao, Y. Liu, H. W. Wu, Z. L. Zhang and X. H. Qu, Adv. Funct. Mater., 2018, 28, 1803409 CrossRef.
- H. Xie, K. Fu, C. P. Yang, Y. G. Yao, J. C. Rao, Y. B. Zhou, B. Y. Liu, D. Kirsch and L. B. Hu, Small Methods, 2018, 2, 1700371 CrossRef.
- Q. H. Wu, R. H. Xu, R. F. Zhao, X. E. Zhang, W. L. Li, G. W. Diao and M. Chen, Energy Storage Mater., 2019, 19, 69–79 CrossRef.
- Q. H. Wu, R. F. Zhao, W. J. Liu, X. E. Zhang, C. Shen, W. L. Li, G. W. Diao and M. Chen, J. Power Sources, 2017, 344, 74–84 CrossRef CAS.
- C. Wu, X. H. Zeng, P. G. He, L. B. Chen and W. F. Wei, Adv. Mater. Interfaces, 2018, 5, 1701080 CrossRef.
- X. Q. Zhang, X. N. Li, J. W. Liang, Y. C. Zhu and Y. T. Qian, Small, 2016, 12, 2484–2491 CrossRef CAS.
- L. L. Zou, C. C. Hou, Z. Liu, H. Pang and Q. Xu, J. Am. Chem. Soc., 2018, 140, 15393–15401 CrossRef CAS.
- Y. M. Chen, L. Yu and X. W. Lou, Angew. Chem., Int. Ed., 2016, 5, 8067–8072 Search PubMed.
- Y. L. Bai, Y. S. Liu, C. Ma, K. X. Wang and J. S. Chen, ACS Nano, 2018, 12, 11503–11510 CrossRef CAS.
- H. L. Huang, W. H. Huang, Z. H. Yang, J. Y. Huang, J. D. Lin, W. P. Liu and Y. J. Liu, J. Mater. Chem. A, 2017, 5, 1558–1566 RSC.
- X. Zheng, S. Wang, C. X. Xiong and G. H. Hu, Carbon, 2018, 133, 162–169 CrossRef CAS.
- X. H. Wang, J. J. Ding, S. W. Yao, X. X. Wu, Q. Q. Feng, Z. H. Wang and B. Y. Geng, J. Mater. Chem. A, 2014, 2, 15958–15963 RSC.
- J. Ren, R. P. Ren and Y. K. Lv, Chem. Eng. J., 2018, 353, 419–424 CrossRef CAS.
- H. W. Zhang, O. Noonan, X. D. Huang, Y. N. Yang, C. Xu, L. Zhou and C. Z. Yu, ACS Nano, 2016, 10, 4579–4586 CrossRef CAS.
- Y. Jin, D. Y. Yang, D. Y. Kang and X. Y. Jiang, Langmuir, 2010, 26, 1186–1190 CrossRef CAS.
- Y. S. Wang, Z. M. Ma, Y. J. Chen, M. C. Zou, M. Yousaf, Y. B. Yang, L. S. Yang, A. Y. Cao and R. P. Han, Adv. Mater., 2016, 28, 10175–10181 CrossRef CAS.
- N. Savjani, E. A. Lewis, M. A. Bissett, J. R. Brent, R. A. W. Dryfe, S. J. Haigh and P. O’Brien, Chem. Mater., 2016, 28, 657–664 CrossRef CAS.
- A. Zak, Y. Feldman, V. Lyakhovitskaya, G. Leitus, R. PopovitzBiro, E. Wachtel, H. Cohen, S. Reich and R. Tenne, J. Am. Chem. Soc., 2002, 124, 4747–4758 CrossRef CAS.
- Z. Hu, L. X. Wang, K. Zhang, J. B. Wang, F. Y. Cheng, Z. L. Tao and J. Chen, Angew. Chem., Int. Ed., 2014, 53, 12794–12798 CrossRef CAS.
- M. Chen, X. Shen, K. Y. Chen, Q. H. Wu, P. F. Zhang, X. E. Zhang and G. W. Diao, Electrochim. Acta, 2016, 195, 94–105 CrossRef CAS.
- H. G. Wang, P. Chen, F. F. Wen, Y. Zhu and Y. Zhang, Sens. Actuators, B, 2015, 220, 749–754 CrossRef CAS.
- X. Y. Xu, G. Zhou, X. F. Dong and J. G. Hu, ACS Sustainable Chem. Eng., 2017, 5, 3829–3836 CrossRef CAS.
- J. Wang, J. L. Liu, D. L. Chao, J. X. Yan, J. Y. Lin and Z. X. Shen, Adv. Mater., 2014, 26, 7162–7169 CrossRef CAS.
- T. Stephenson, Z. Li, B. Olsen and D. Mitlin, Energy Environ. Sci., 2014, 7, 209–231 RSC.
- Y. J. Gong, S. B. Yang, L. Zhan, L. L. Ma, R. Vajtai and P. M. Ajayan, Adv. Funct. Mater., 2014, 24, 125–130 CrossRef CAS.
- Y. Li, K. Chang, E. Shangguan, D. L. Guo, W. Zhou, Y. Hou, H. W. Tang, B. Li and Z. R. Chang, Nanoscale, 2019, 11, 1887–1900 RSC.
- X. X. Zuo, K. Chang, J. Zhao, Z. Z. Xie, H. W. Tang, B. Li and Z. R. Chang, J. Mater. Chem. A, 2016, 4, 51–58 RSC.
Footnote |
| † Electronic supplementary information (ESI) available. See DOI: 10.1039/c9cc07291h |
| This journal is © The Royal Society of Chemistry 2020 |


