Cell-penetrating peptide-modified quantum dots as a ratiometric nanobiosensor for the simultaneous sensing and imaging of lysosomes and extracellular pH†
Yan
Yang
,
Mengchan
Xia
,
Sichun
Zhang
 * and
Xinrong
Zhang
Department of Chemistry, Tsinghua University, Beijing, China. E-mail: sczhang@mail.tsinghua.edu.cn
First published on 18th November 2019
Abstract
The selective measurement of cellular pH at specific regions is significant for the in-depth study of cell functions and pathological processes. Herein, we combined our previously developed rhodamine B-labeled cell-penetrating peptide spirolactam derivative with quantum dots to create a ratiometric nanobiosensor for the simultaneous sensing and imaging of lysosomes and extracellular pH.
Acid–base homeostasis is one of the vital biological processes occurring in living cells. The specific pH value in subcellular regions helps maintain the normal function of cells and an abnormal level of pH is the manifestation of cell dysfunction,1 which is often accompanied with the occurrence of diseases such as a stroke, Alzheimer's disease, and even cancer.2 Additionally, the decrease in the pH value on the cell surface is recognized as the characteristic of some pathological states.3 The accurate and sensitive monitoring of pH fluctuations at defined cellular locations is therefore helpful for understanding cytophysiology, cell internalization and the diagnosis of diseases.
The fluorescence technique has high specificity and non-invasive and real-time imaging properties, which make it particularly suitable for the detection of the local pH in living cells. The accurate determination of pH can be achieved using ratiometric fluorescent probes with two-emission signals.4 In recent years, a variety of ratiometric fluorescent probes has been reported for visualizing subcellular pH distribution and fluctuation.5 However, most of them are concentrated in a specific region of the cells, and the probes that can simultaneously monitor the intracellular and extracellular pH of living cells are not well explored.
Various nanomaterials are used to construct pH nanosensors,6 among which quantum dots (QDs) have unique photophysical properties, making them ideal scaffolds to create smart nanosensors for physiological pH determination.7 Moreover, the highly engineerable surface of QDs allows them to be conveniently functionalized by fluorescent indicator dyes, thus producing a QD-based ratiometric nanosensor.8 In order to fulfill the intracellular pH sensing requirement, the QD-dye conjugates need to be further modified with biomolecules.9 The use of cell-penetrating peptides (CPPs) for facilitating the internalization of QD sensors is an efficient delivery strategy.10 According to the two-step method for functionalizing QDs with analyte-sensitive indicators and CPPs, Bao et al. fabricated a FRET system for the detection of H+ using QDs as donors and pH-sensitive fluorescent proteins as acceptors.11 To facilitate cell internalization, the developed QD biocomposites were further functionalized with polyarginine, thus achieving intracellular pH sensing. Using a similar strategy, the Feltz research group designed a FRET-based nanobiosensor for intracellular Ca2+ transient detection.12 However, the construction of such a nanobiosensor needed complicated manipulations. Our group previously reported a rhodamine B (RhB)-labeled cell-penetrating peptide spirolactam derivative for intracellular pH imaging.13 This RhB-CPP derivative has both pH sensing and cell-penetrating functions, thus pointing to a potentially simpler approach for exploring QD-based ratiometric pH nanobiosensors.
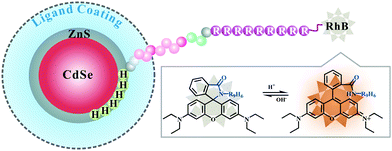
Herein, a hybrid QD-peptide nanobiosensor (denoted as RhB-R9H6-QD) was developed for ratiometric pH sensing. We first designed an RhB-labeled CPP sequence composed of several functional modules (Scheme 1). These include a 9-mer polyarginine (R9) for facilitating cell internalization, the RhB dye introduced on the N-terminal of arginine as a part of the pH indicator, a helix linker rich in Ala and Aib residues ((Aib)AAA(Aib)AA) for providing rigidity and orientation, and finally a C-terminal hexameric histidine (His6) domain for mediating self-assembly onto the QD surface. Then, this rationally designed CPP spirolactam derivative RhB-R9H6 was conjugated with red fluorescent QDs. Upon a spontaneous Hisn-metal-affinity coordination reaction between His6-module in the CPP sequence and Zn-rich QD surface,14 the RhB-R9H6-QD nanoconjugates were finally generated. Under acidic conditions, the presence of H+ triggered a ring-opening reaction of the spirolactam derivative RhB-R9H6 fixed on the QD surface and caused strong fluorescence; however, it had little effect on the intrinsic fluorescence of QDs, thus realizing the ratiometric sensing of pH.
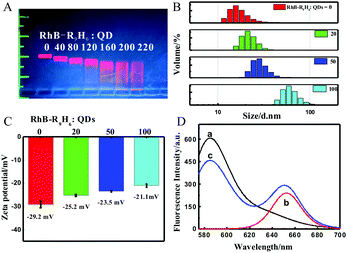
The formation of the RhB-R9H6-QD nanoconjugates was validated by gel retardation and DLS analyses. The reduced mobility of QDs upon the addition of CPPs indicated the successful binding of RhB-R9H6 and QDs (Fig. 1A). When the ratio of RhB-R9H6 to QDs was higher than 160, the mobility of the nanoconjugates remained stable. At this ratio, RhB-R9H6 almost reached saturated loading on the surface of QDs. In solution, the hydrodynamic size of QDs was 17.0 ± 1.1 nm based on DLS analysis. With the addition of the RhB-R9H6 peptide, the size of RhB-R9H6-QD increased continuously, providing strong evidence for the conjugation of RhB-R9H6 with QDs (Fig. 1B). The surface charge of the nanoconjugates in an aqueous solution was determined by measuring the zeta potential. PEG-capped QDs have a negatively charged surface with a zeta potential of −29.2 ± 1.5 mV. The binding of the positively charged RhB-R9H6 on QDs partially neutralized their negative charge, so that the zeta potential of RhB-R9H6-QD shifted to a more positive value with an increase in the RhB-R9H6-to-QDs ratios (Fig. 1C).
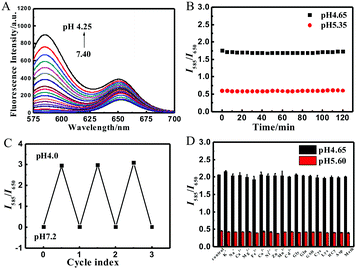
The fluorescence of RhB-R9H6-QD was investigated in a B–R buffer. Since quantum dots have broad excitation wavelengths, the QD-based RhB-R9H6-QD can be excited using the optimum excitation wavelength of the RhB dye. When excited at 559 nm, the nanobiosensor exhibited an evident dual fluorescence emission at 585 nm and 650 nm in acidic media, which was practically identical to those of the RhB dye and QDs (Fig. 1D). Furthermore, the decrease in pH raised the fluorescence intensity of the RhB part at 585 nm dramatically, while that of the QD part at 650 nm increased slightly (Fig. 2A), indicating that the spirolactam part of RhB-R9H6 still retained the sensitive response to pH and the modification of RhB-R9H6 had a certain effect on the fluorescence intensity of QDs. Most notably, an exponential relationship was observed when the intensity ratio between the maximum emissions at 650 and 585 nm (I650/I585) was plotted as a function of pH values in the range of 4.25–7.40 (R2 = 0.9820, Fig. S1A, ESI†). In addition, good residual analysis data were obtained (Fig. S1B, ESI†). These results suggest that RhB-R9H6-QD can be used for the quantitative detection of pH in a ratiometric manner.
Then, the photostability, reversibility and specificity of RhB-R9H6-QD were evaluated. The nanobiosensor was subjected to intermittent radiation every five minutes. The recorded I585/I650 value barely changed after 2 h of being exposed to the radiation at pH 4.65 and 5.35, suggesting that RhB-R9H6-QD has good photostability. To examine the reversibility, the pH values of the RhB-R9H6-QD solutions were adjusted back and forth between 4.0 and 7.2. The result showed that the nanobiosensor could work normally for three cycles (Fig. 2C). In the interference study, the addition of a certain concentration of a potential interfering substance to the detection system caused no visible effect on I585/I650 at pH 4.65 and 5.60.
Regarding its favorable analytical performance in vitro, RhB-R9H6-QD was used for cell imaging. We first evaluated the effect of RhB-R9H6-QD on the proliferation of living cells via a CCK-8 assay. The measured cell viability was close to 90% even after 24 h of incubation (Fig. S2, ESI†), indicating that RhB-R9H6-QD was nearly non-toxic to living cells under the studied experimental conditions. Subsequently, fluorescence imaging assays were carried out. As shown in Fig. 3, the dual fluorescence signals of the orange and red channels are observed in both the intracellular and extracellular regions, suggesting that RhB-R9H6-QD may be located not only inside the cells but also on the membrane. More importantly, co-localization analysis in a region of interest (ROI) indicated that the images from the two channels almost overlapped, with a Pearson's correlation coefficient of 0.8790. This spatial matching suggested that RhB-R9H6 was firmly immobilized on the QD surface during the process of internalization.
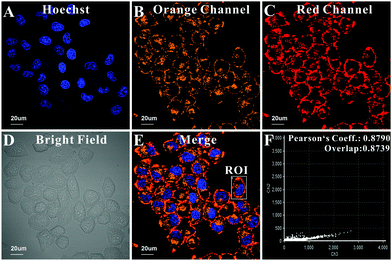 | ||
| Fig. 3 Location of RhB-R9H6-QD. (A–E) Confocal images of HeLa cells modified with RhB-R9H6-QD. (F) The relationship between signals of the orange and red channels in ROI chosen from Fig. 3E. Scale bar: 20 μm. | ||
To further confirm the distribution of the nanobiosensor, a Z-axis depth scanning experiment was performed. In the initial scanning, only a weak fluorescence signal could be observed on the cell surface. With the increase in the scanning depth, obvious punctate fluorescence signals began to appear inside the cells, while the circular fluorescence signal on the cell surface still existed and increased gradually (Fig. S3, ESI†). In an additional Trypan blue (TP) quenching assay, RhB-R9H6-QD-modified HeLa cells were treated with TP, which is a known cell-impermeable quencher with the ability to quench the fluorescence emission in the range of 500–600 nm.15 The addition of TP greatly attenuated the circular fluorescence signal in the orange channel but had no effect on the red channel (Fig. S4, ESI†), indicating that a portion of the nanobiosensor was distributed on the cell surface. Meanwhile, both punctate fluorescence signals in the orange and red channels did not show significant changes, indicating that a part of the nanobiosensor entered the cells; thus, the orange signal could not be quenched by TP. The Z-axis depth scanning images combined with the TP quenching experiment strongly suggested that RhB-R9H6-QD was indeed located on the cell surface and inside the cells at the same time.
We next monitored the process of cell labeling with RhB-R9H6-QD. The confocal images with 1 h co-incubation showed weak dual fluorescence mainly observed on the cell membrane, and the red fluorescence was stronger than the orange one at this time (first row in Fig. S5, ESI†). When the co-culture time was prolonged to 5 h, the fluorescence signal, either intracellular or extracellular, became more and more obvious, especially in the orange channel (second row in Fig. S5, ESI†). Therefore, we speculated that during the co-incubation of RhB-R9H6-QD with cells, the nanobiosensor first gradually concentrated in the cell membrane from the bulk solution due to the affinity of CPPs for the cell membrane; then, a part internalized and accumulated inside the cell, while the other part did not desorb from the cell membrane and remained on the cell surface. The difficult desorption of the nanobiosensor may be related to the distribution of RhB-R9H6 on the QD surface. As mentioned earlier, RhB-R9H6 attached on the QD surface through Hisn-metal-affinity coordination; this provided rigidity and orientation, which allowed the R9 part of the CPP sequence to be far from the surface of QDs, thus generating a strong electrostatic adsorption effect between R9 and the negatively charged cell membrane. Moreover, it was noted that RhB-R9H6-QD could be retained in the plasma membrane for prolonged periods of time, even up to ∼8 h, before eventually being internalized. This robustness is an advantage of the nanobiosensor for labelling the cell membrane because the challenge of building optical probes for an extracellular environment is their short working life owing to rapid internalization.
Careful observations of the confocal images for 5 h and 8 h shown in Fig. S5 (ESI†) reveal that the orange fluorescence inside the cells is brighter than that on the cell membrane; thus, the generated ratio images present distinctly different colours between the intracellular region and the cell membrane, which reflect the pH difference between the intracellular and extracellular regions. In addition, after staining the nucleus with a commercial nuclear dye, it was clearly observed that the punctate fluorescence signal inside the cells was distributed near the perinuclear region (Fig. 3E), which may suggest lysosomal localization. A co-localization experiment was carried out by co-staining HeLa cells with RhB-R9H6-QD and a commercial lysosome-specific probe. As exhibited in Fig. S6 (ESI†), the orange fluorescence from RhB-R9H6-QD overlapped well with the blue signal of Lyso-Tracker and the Pearson's correlation coefficient was determined to be 0.63, indicating that the nanobiosensor inside the cells was distributed mainly in lysosomes. Furthermore, we tried to incubate RhB-R9H6-QD with different types of cells, including cancer cells, namely, A549 and normal cells, namely, MCF-10A. It was found that there were punctate dual fluorescence signals inside the cells and circular dual signals on the cell membrane, which was consistent with that observed in HeLa cells (Fig. S7, ESI†), demonstrating the universality of the nanobiosensor.
To determine whether RhB-R9H6-QD could work well in the ratiometric mode for pH detection in a cellular environment, fluorescence pH titration was performed in vivo. As shown in Fig. S8A (ESI†), when the pH value of the external buffer increases from 4.0 to 7.5, the fluorescence intensity of the orange channel decreases greatly, while the fluorescence intensity of the red channel barely changes. Moreover, the ratio images listed in the third row of Fig. S8A (ESI†) also present pH-dependent pseudo-colours. The quantitative analysis indicated that there was also an exponential correlation between the pH and the intensity ratio of the two channels (FRed/FOrange) (Fig. S8B, R2 = 0.9976, ESI†). According to the established exponential equation, the average pH value of the lysosomes was determined to be 4.6 ± 0.2 (Fig. S8C, ESI†).
The biological applications of RhB-R9H6-QD for the ratiometric monitoring of the pH changes in living cells were determined. We treated RhB-R9H6-QD-stained HeLa cells with chloroquine (CQ), a lysosomal inhibitor that allows the increase in lysosome pH.16 As exhibited in Fig. 4, the fluorescence signal from the orange channel inside the cells decreases significantly, while the red one is almost unchanged. Meanwhile, the addition of CQ did not affect the intensity of the probe distributed on the cell membrane. The decrease in orange fluorescence in the lysosomes increased the ratio of the fluorescence intensities of the two channels, thereby breaking down the obvious difference in colors between the lysosomes and the extracellular regions on the ratio images. We next attempted to employ RhB-R9H6-QD for tracking extracellular acidification associated with cell metabolism. The statistical results from time course imaging showed that FRed/FOrange decreased with the increase in culture time in both groups (Fig. S9, ESI†), indicating that the surface microenvironment of the cancer cells gradually acidified with cell proliferation and metabolism. Notably, the cells cultured with additional glucose exhibited greater extracellular acidification, which was consistent with a previous study in which glucose could enhance and promote cellular metabolism.17 All these results strongly validate the function of the nanobiosensor for monitoring pH fluctuations in a ratiomeric manner not only in lysosomes, but also in the extracellular region.
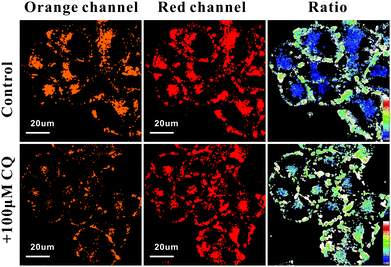 | ||
| Fig. 4 Confocal and ratio images of RhB-R9H6-QD-modified HeLa cells treated with CQ. The color strip represents the pseudo-color change with pH. | ||
In summary, we functionalized red-emitting QDs with an RhB-labeled CPP spirolactam derivative to create a ratiometric nanobiosensor RhB-R9H6-QD with an excellent analytical performance and biocompatibility. RhB-R9H6-QD was found to be located both in the lysosomes and the extracellular juxtamembrane region, which made it an effective tool for the simultaneous sensing and imaging of pH in these two parts. Using the ratiometric detection mode, the nanobiosensor was successfully applied for the accurate determination of the pH value in lysosomes. Moreover, the nanobiosensor was used for the real-time monitoring of lysosomal pH changes and extracellular acidification related to cell metabolism, thereby demonstrating its practicability. In view of the specific dual-targeting and accurate quantitative ability of RhB-R9H6-QD, we believe that this design strategy has a potential application prospect in studying the cellular internalization of QDs mediated by CPPs and cell heterogeneity based on pH distribution.
This research was supported by the Ministry of Science and Technology of China (2016YFF0100301) and the National Natural Science Foundation of China (No. 21390410, 21727813 and 21621003).
Conflicts of interest
There are no conflicts to declare.Notes and references
- (a) C. Martin, S. F. Pedersen, A. Schwab and C. Stock, Am. J. Physiol.: Cell Physiol., 2011, 300, C490 CrossRef CAS PubMed; (b) B. A. Webb, M. Chimenti, M. P. Jacobson and D. L. Barber, Nat. Rev. Cancer, 2011, 11, 671 CrossRef CAS.
- H. Izumi, T. Torigoe, H. Ishiguchi, H. Uramoto, Y. Yoshida, M. Tanabe, T. Ise, T. Murakami, T. Yoshida, M. Nomoto and K. Kohno, Cancer Treat. Rev., 2003, 29, 541 CrossRef CAS.
- R. R. Kedika, R. F. Souza and S. J. Spechler, Dig. Dis. Sci., 2009, 54, 2312 CrossRef CAS.
- X. Huang, J. Song, B. C. Yung, X. Huang, Y. Xiong and X. Chen, Chem. Soc. Rev., 2018, 47, 2873 RSC.
- (a) Y. Yang, M. Xia, H. Zhao, S. Zhang and X. Zhang, ACS Sens., 2018, 3, 2278 CrossRef CAS; (b) L. Wu, Y. Wang, T. D. James, N. Jia and C. Huang, Chem. Commun., 2018, 54, 5518 RSC; (c) M. J. Chang, K. Kim, K. S. Park, J. S. Kang, C. S. Lim, H. M. Kim, C. Kang and M. H. Lee, Chem. Commun., 2018, 54, 13531–13534 RSC.
- (a) T. Fujisaku, R. Tanabe, S. Onoda, R. Kubota, T. F. Segawa, F. T. So, T. Ohshima, I. Hamachi, M. Shirakawa and R. Igarashi, ACS Nano, 2019, 13, 11726–11732 CrossRef CAS; (b) H. Nie, M. J. Li, Q. S. Li, S. J. Liang, Y. Y. Tan, L. Sheng, W. Shi and S. X. A. Zhang, Chem. Mater., 2014, 26, 3104–3112 CrossRef CAS.
- P. Zrazhevskiy and X. Gao, Nat. Commun., 2013, 4, 1619–1631 CrossRef PubMed.
- P. Wu, X. Hou, J. J. Xu and H. Y. Chen, Nanoscale, 2016, 8, 8427 RSC.
- J. B. Blanco-Canosa, M. Wu, K. Susumu, E. Petryayeva, T. L. Jennings, P. E. Dawson, W. R. Algar and I. L. Medintz, Coord. Chem. Rev., 2014, 263–264, 101 CrossRef CAS.
- M. Zhao and R. Weissleder, Med. Res. Rev., 2004, 24, 1 CrossRef CAS.
- A. M. Dennis, W. J. Rhee, D. Sotto, S. N. Dublin and G. Bao, ACS Nano, 2012, 6, 2917 CrossRef CAS.
- A. I. Zamaleeva, M. Collot, E. Bahembera, C. Tisseyre, P. Rostaing, A. V. Yakovlev, M. Oheim, M. de Waard, J. M. Mallet and A. Feltz, Nano Lett., 2014, 14, 2994 CrossRef CAS.
- M. Xia, L. Cai, S. Zhang and X. Zhang, Anal. Chem., 2017, 89, 1238 CrossRef CAS.
- D. E. Prasuhn, J. R. Deschamps, K. Susumu, M. H. Stewart, K. Boeneman, J. B. Blanco-Canosa, P. E. Dawson and I. L. Medintz, Small, 2010, 6, 555 CrossRef CAS.
- J. D. Loike and S. C. Silverstein, J. Immunol. Methods, 1983, 57, 373 CrossRef CAS.
- B. Poole and S. Ohkuma, J. Cell Biol., 1981, 90, 665 CrossRef CAS.
- M. Anderson, A. Moshnikova, D. M. Engelman, Y. K. Reshetnyak and O. A. Andreev, Proc. Natl. Acad. Sci. U. S. A., 2016, 113, 8177 CrossRef CAS.
Footnote |
| † Electronic supplementary information (ESI) available. See DOI: 10.1039/c9cc07596h |
| This journal is © The Royal Society of Chemistry 2020 |

