De novo formation of citrate-based fluorophores on N-termini of peptides and proteins in cells and tissues†
Dongwook
Jung
a,
Dongkil
Choi
a,
Changgon
Sim
a,
Yumin
Kim
a,
Sunyoung
Kang
a,
So Hee
Nam
a,
Joomyung
Jang
a,
Dokyoung
Kim
 b,
Mee Soo
Chang
*c,
Ji-Ung
Park
*d and
Yan
Lee
 *a
*a
aDepartment of Chemistry, College of Natural Sciences, Seoul National University, Seoul 08826, Korea. E-mail: gacn@snu.ac.kr
bDepartment of Anatomy and Neurobiology, College of Medicine, Kyung Hee University, Seoul 130-701, Korea
cDepartment of Pathology, Seoul National University Boramae Medical Center, Seoul National University College of Medicine, Seoul 07061, Korea. E-mail: meesooch@snu.ac.kr
dDepartment of Plastic and Reconstructive Surgery, Seoul National University Boramae Medical Center, Seoul 07061, Korea. E-mail: alfbskan@gmail.com
First published on 26th November 2019
Abstract
We developed a new method for the de novo formation of fluorophores based on citrate (DNFC) in biological samples. Use of an amide coupling reagent and microwave irradiation greatly facilitates the fluorophore formation on peptides and proteins with N-terminal cysteine or serine. Since N-terminal cysteine and serine can form thiazolopyridone- or oxazolopyridone-based fluorophores emitting blue and green fluorescence, respectively, by the DNFC staining, each organelle, cell and tissue exhibited a characteristic fluorescence distribution. The DNFC staining is able to provide a new potential protocol for future cell imaging, histology and diagnosis.
Fluorescence-based imaging is a current paradigm method for visualising biological samples as it is highly sensitive, has a low detection limit and is non-invasive.1 Well-designed chemical fluorophores are commonly introduced to biological molecules.2 Unlike most chemical fluorophores having fluorogenic structures that were formed prior to their introduction into biological molecules, some biological fluorophores are gradually formed via maturation from almost non-fluorogenic structures. Fluorophore formation in green fluorescent protein from threonine, tyrosine and glycine (Gly) is a representative example.3 The research on de novo fluorophore generation will improve understanding of the origin of biological fluorophores as well as facilitate the discovery of new ones, although few examples have been reported so far except for biological fluorophores.
In a previous study, Yang's group reported that fluorescence properties could be induced in polymers by heating with citrate (Cit) and amino acids.4 The strongest fluorescence occurred when L-cysteine (Cys) reacted with Cit. Kasprzyk's group subsequently confirmed that the fluorescence originated from the structure of 5-oxo-2,3-dihydro-5H-[1,3]thiazolo[3,2-a]pyridine-3,7-dicarboxylic acid (TPA).5 It was proposed that the dihydrothiazolopyridone ring in TPA is formed via serial condensation/dehydration reactions between Cit and Cys. As the condensation/dehydration reactions normally require extreme conditions, the reported syntheses proceeded at high temperatures (140 °C–180 °C).6 Furthermore, the reaction conditions frequently led to heterogeneous products of oligomers and polymers of TPA or even carbon dots with varying luminescence properties.7
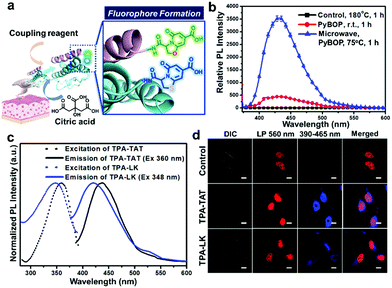
The de novo TPA fluorophore formation from natural non-fluorogenic tricarboxylic acid and amino acid may be very useful for introducing fluorescence into native peptides and proteins if the fluorophore can be generated under mild conditions. We intended to develop a method to facilitate formation of the Cit-based fluorophores at conditions avoiding significant disruption of biomolecular structures. Then these conditions were applied to introduce the fluorophores into peptides and proteins in cells and tissues (Fig. 1a).
Inspired by the proposed mechanism in which TPA formation begins from successive amide/imide couplings between Cit and Cys (Scheme S1, ESI†), we expected that TPA formation could be facilitated by coupling reagents in peptide synthesis. Thus, we checked the effect on fluorophore formation of adding (benzotriazol-1-yloxy)tripyrrolidinophosphonium hexafluorophosphate (PyBOP) to a mixture of Cit and Cys. Furthermore, we analysed the effect of microwave irradiation, which is known to promote amide formation.8Fig. 1b compares the fluorescence intensities of Cit/Cys mixtures after treating under different reaction conditions. Remarkably, when PyBOP was added to a Cit/Cys mixture at 25 °C, the intensity was over 400 times higher than the intensity of the mixture heated at 180 °C using the previous method (control).6 Furthermore, after the microwave irradiation, the PyBOP-containing mixture exhibited approximately 3500 times higher fluorescence intensity than did the control. The fluorescence intensities were carefully compared according to the reaction conditions (Fig. S12a–c, ESI†).
Through the analyses of 1H NMR, MS and absorption/emission spectra of the major fluorescent reaction product of the mixture (Fig. S3, S10a, S12d, ESI†), we verified that the TPA structure could be synthesised much more efficiently using coupling reagents and microwave irradiation under milder conditions than those previously reported. We also applied the PyBOP/microwave-assisted method to a mixture of L-serine (Ser) and Cit. The resulting fluorescence intensity was about 10 times higher than that of the sample prepared by heating at 180 °C (Fig. S13a, ESI†). The fluorescence of Ser-based 5-oxo-2,3-dihydro-5H-[1,3]oxazolo[3,2-a]pyridine-3,7-dicarboxylic acid (OPA) was red-shifted by about 40–50 nm compared to that of Cys-based TPA (Fig. S13b, ESI†).5
We then determined whether the TPA fluorophore could be de novo generated on peptides. Since both amine and thiol groups are needed for dihydrothiazolopyridone ring formation, N-terminal Cys with both groups in a peptide sequence may be a suitable target for TPA introduction. Cysteine–leucine–n-butylamine was reacted with Cit in the presence of PyBOP (Scheme S2, ESI†). The 1H NMR and LC/MS spectra (Fig. S9 and S10b, ESI†) confirmed that the TPA structure was successfully introduced to the dipeptide N-terminus. Like TPA, the TPA-conjugated dipeptide emitted strong fluorescence at 420 nm when excited at 350 nm (Fig. S14, ESI†). The TPA fluorophore was also generated on longer peptides conjugated to a solid phase peptide synthesis resin. We synthesised a 12-meric TAT peptide (CYGRKKRRQRRR) and a 17-meric peptide (LK-peptide) (CLKKLCKLLKKLCKLAG) on a solid phase resin (Scheme S3, ESI†). The peptides were treated with Cit/PyBOP, cleaved from the resin and purified by HPLC (Fig. S11, ESI†). TPA-TAT and TPA-LK peptides exhibited maximum emission intensities at 440 and 423 nm, respectively (Fig. 1c), suggesting that the emission is dependent upon the peptide sequences.
The hydrophobic leucine (L) residues next to the cysteine (C) in the LK peptide may induce the blue shift of the emission maximum from that of free TPA (430 nm) through hydrophobic interaction,9 whereas the tyrosine (Y) and successive hydrophilic charged residues in the TAT sequence may induce the red shift.10
A peptide having an N-terminal TPA structure could be directly used for bioimaging. As the TAT and LK peptides were reported as cell-penetrating peptides,11 we examined the internalization of TPA-labelled TAT and LK into HeLa cells. Confocal laser scanning microscopy (CLSM) images show blue fluorescent dots in the cell interior (Fig. 1d). The TPA-TAT-treated cells showed more concentrated localisation of the TPA fluorescence in the nucleus than TPA-LK-treated ones (Fig. S18, ESI†). These results suggested that the cell-penetrating activity of both peptide sequences as well as the nuclear localisation activity of the TAT sequence was well maintained even after TPA formation on the peptides.
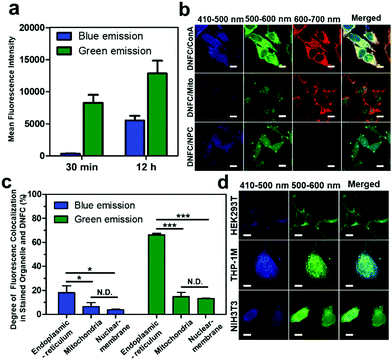
We expected that proteins in biological samples could be directly labelled with the fluorophore via the same method. As a proof of concept, we treated fixed HeLa cells with Cit and PyBOP in a mixed solvent (DMSO/H2O = 70/30) (Fig. S19a, ESI†). After the treatment, the cells exhibit both blue and green fluorescence by excitation at 405 nm (Fig. S19b, ESI†). The intensities of green and blue fluorescence were increased according to the incubation time (Fig. 2a).
We performed a more detailed analysis of the fluorescence distribution in HeLa cells stained by the DNFC method. Interestingly, both blue and green fluorescent dots were mainly observed in the cytoplasm outside the nucleus (Fig. S19b, ESI†). We compared the co-localisation of DNFC-derived blue and green fluorescence signals with red fluorescence-labelled molecules targeting major membrane-bound organelles: the endoplasmic reticulum (ER), mitochondria and nuclei. Co-localisation was identified as purple or yellow signals in the merged images (Fig. 2b), clearly indicating a high extent of co-localisation of DNFC-derived green fluorescence and ER. Statistical image analysis also confirmed a significantly higher degree of fluorescence co-localisation in ER membrane than in mitochondrial and nuclear membranes (Fig. 2c).
Considering that an amino group is needed as well as the thiol or hydroxyl group for formation of TPA and OPA, we predicted that N-terminal Cys or Ser would be the optimised point of the fluorophore formation. Most cytosolic proteins initially have an N-terminal methionine (Met), but in a cell-free experiment using tripeptides (Met-Gly-Gly, Cys-Gly-Gly and Ser-Gly-Gly), we found that the fluorophore formation on Met was negligible compared to those on Cys or Ser (Fig. S17, ESI†). Post-translational cleavage may subsequently occur to expose a non-Met residue on the N-termini of certain proteins. The N-terminal signal peptides of most non-cytosolic proteins are trimmed by endopeptidases in the ER membrane and sorted to their final destinations.12 Thus, compared to cytosolic proteins, ER proteins are more likely to expose non-Met amino acids, conceivably Cys or Ser, on the N-termini, where DNFC staining may occur at higher rates. A portion of Cys- or Ser-terminal proteins in membrane-bound organelles, which were predominantly trafficked from the ER, may also react with Cit to display DNFC-based fluorescence in the organelles.
Remarkably, green fluorescence is much stronger than blue by single-photon excitation at 405 nm or by two-photon excitation at 780 nm in most DNFC-based cell staining images (Fig. S19c, ESI†) although the direct comparison of fluorescence intensity is rather difficult due to the different sensitivity of the detector according to the wavelength. In a cell-free condition, the OPA fluorescence was generated faster but saturated earlier (Fig. S15, ESI†). On the other hand, the TPA fluorescence was generated in a slower rate and not saturated even after 30 min. The slower formation rate of TPA may be one of the reasons for the stronger green fluorescence than the blue one. In addition, although the TPA fluorescence was much stronger than the OPA fluorescence at the maximum λex (370 nm), it was weakened at 405 nm, the excitation wavelength of the CLSM laser (Fig. S16, ESI†). The inferior excitation of TPA by the CLSM laser could also be a reason for the weak blue fluorescence. More importantly, we anticipated that the predominance of green fluorescence was due to the different frequencies of Cys- or Ser-terminal proteins in cells. The whole N-terminal proteome of human proteins has not yet been identified; however, Ser is frequently exposed in a non-acetylated form at the N-termini of trimmed proteins after cleavage of signal peptides but the exposure of N-terminal Cys is extremely rare.13 Variation in the green/blue fluorescence ratios might be linked to variation in Cys- and Ser-terminal proteomes among organelles. We propose that the N-terminal proteome in mitochondria might have a higher Cys-/Ser- ratio than the ER or nuclear membrane (Fig. 2c).
We compared the morphologies of HEK293T (human embryonic kidney), THP-1M (human macrophage) and NIH3T3 (mouse fibroblast) after the DNFC staining (Fig. 2d). The CLSM image shows the characteristic morphology of each cell line: the extended multipolar HEK293T and NIH3T3 and irregular spherical THP-1M cells. The fluorescence preferentially developed in the cytoplasm rather than in the nuclei of the three cell lines. HEK293T cells developed the lowest fluorescence intensities at both wavelengths. However, THP-1M cells exhibited much stronger blue fluorescence than other cells. Both the Cys- and Ser-terminal proteomes and the protein expression levels might be characteristically represented by the fluorescence variations in each cell line.
Inspired by each cell type exhibiting a characteristic fluorescence distribution after DNFC staining, we predicted that detailed shapes and structures of human tissues could be identified by this staining. Paraffin-embedded human skin and attached subcutaneous fat tissues were microsectioned, placed on glass slides and treated with Cit and PyBOP in DMSO, rather than DMSO/H2O, to enhance reagent penetration into the densely packed epidermis in a fixed state.
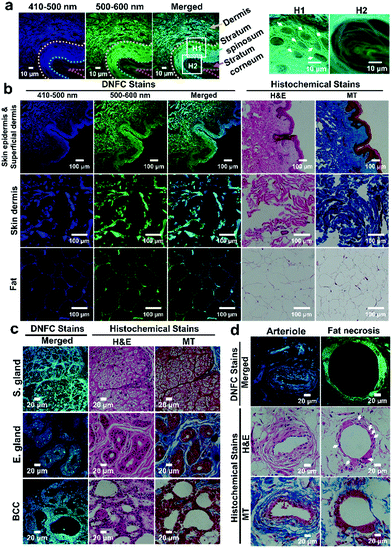
DNFC-stained skin/subcutaneous tissue exhibited strong blue and green emission, which was much stronger than the autofluorescence of tissues (Fig. 3, Fig. S20, ESI†). In the epidermis, multiple layers of flake-like keratin at the stratum corneum were clearly observed (Fig. 3a, H2). Additionally, we confirmed that the extracellular matrix surrounding polyhedral keratinocytes in the stratum spinosum (Fig. 3a, H1) was strongly stained. The DNFC-stained tissue slice and adjacent tissue slices of conventional hematoxylin and eosin stain (H&E stain) and Masson's trichrome stain (MT stain), exhibited almost the same microscopic features of substructures, allowing the DNFC-stained substructures to be histomorphologically interpreted (Fig. 3b). In the dermis (top and middle panels), the DNFC could stain collagen and elastic fibre bundles. In the subcutaneous fat tissues (bottom panel), the extracellular matrix and thin cytoplasm of adipocytes, except for the lipid droplets, were visually accentuated in the DNFC-stained sample over the H&E- or MT-samples.
We also discerned substructures of a DNFC-stained skin/subcutaneous tissue sample from a patient with basal cell carcinoma (BCC) (Fig. 3c and Fig. S21a, ESI†). Mesh-like cribriform structures were observed in a DNFC-stained image of sebaceous glands (top panel). Lipid-based adipocyte material was not stained by the DNFC method. Other images showed the characteristic shape of eccrine glands (middle panel). We clearly observed bright dot-like structures scattered throughout the DNFC-stained eccrine glands, although not in the H&E- or MT-stained samples. The bright fluorescence in the glands indicates that they have large quantities of proteins with N-terminal Ser or Cys, and the dot-like structure may be a characteristic feature of the gland. Notably, tumour cells were strongly stained by the DNFC method (bottom panel). The array of tumour cells and unstained stroma are characteristic histomorphological features of BCC, which was also verified by the H&E- and MT-stained images.
In another skin/connective tissue sample (Fig. 3d and Fig. S21b, ESI†), an arteriole with a thicker wall and a narrower lumen than capillaries (top panel) and fat necrosis with a structure of unstained fat enclosed by histiocytes and multinucleated giant cells (bottom panel) were distinguished. We believe that the DNFC-based analysis could be a strong alternative diagnosis method for supporting conventional histology by providing additional information concerning the protein distribution.
In summary, we report that strong blue and green fluorophores are de novo generated on peptides and protein N-termini from non-fluorogenic Cit and amino acids under mild conditions. Moreover, intracellular or extracellular peptides and proteins with N-terminal Cys or Ser are fluorescently labelled in a spatially-specific manner by the DNFC method. The DNFC method, which exhibits characteristic distributions of fluorescently labelled proteins in biosamples, is expected to contribute to bioimaging and diagnosis. The DNFC-staining characteristics of cells and tissues in this study are summarized in Table S1, ESI† for such future applications. Of course, fluorophore formation from non-fluorogenic biomolecules may aid discovery of new chemical or biological fluorophores.
This work was supported by a National Research Foundation of Korea grant funded by the Korean Government (NRF-2017M3A9E4077448) and by the Korea Health Technology R&D project funded by the Ministry of Health & Welfare, Korea (HI15C2878).
Conflicts of interest
There are no conflicts to declare.Notes and references
- M. Fernandez-Suarez and A. Y. Ting, Nat. Rev. Mol. Cell Biol., 2008, 9, 929–943 CrossRef CAS.
- Q. Zheng, M. F. Juette, S. Jockusch, M. R. Wasserman, Z. Zhou, R. B. Altman and S. C. Blanchard, Chem. Soc. Rev., 2014, 43, 1044–1056 RSC.
- R. N. Day and M. W. Davidson, Chem. Soc. Rev., 2009, 38, 2887–2921 RSC.
- J. Yang, Y. Zhang, S. Gautam, L. Liu, J. Dey, W. Chen, R. P. Mason, C. A. Serrano, K. A. Schug and L. Tang, Proc. Natl. Acad. Sci. U. S. A., 2009, 106, 10086–10091 CrossRef CAS.
- W. Kasprzyk, S. Bednarz and D. Bogdal, Chem. Commun., 2013, 49, 6445–6447 RSC.
- W. Kasprzyk, S. Bednarz, P. Żmudzki, M. Galica and D. Bogdał, RSC Adv., 2015, 5, 34795–34799 RSC.
- Y. Song, S. Zhu, S. Zhang, Y. Fu, L. Wang, X. Zhao and B. Yang, J. Mater. Chem. C, 2015, 3, 5976–5984 RSC.
- A. de la Hoz, A. Diaz-Ortiz and A. Moreno, Chem. Soc. Rev., 2005, 34, 164–178 RSC.
- X. Yang, R. Lu, H. Zhou, P. Xue, F. Wang, P. Chen and Y. Zhao, J. Colloid Interface Sci., 2009, 339, 527–532 CrossRef CAS.
- F. Milletti, Drug Discovery Today, 2012, 17, 850–860 CrossRef CAS.
- S. Jang, S. Hyun, S. Kim, S. Lee, I. S. Lee, M. Baba, Y. Lee and J. Yu, Angew. Chem., Int. Ed., 2014, 53, 10086–10089 CrossRef CAS PubMed; L. Pan, Q. He, J. Liu, Y. Chen, M. Ma, L. Zhang and J. Shi, J. Am. Chem. Soc., 2012, 134, 5722–5725 CrossRef.
- S. F. Nothwehr and J. I. Gordon, BioEssays, 1990, 12, 479–484 CrossRef CAS; R. J. Folz, S. F. Nothwehr and J. I. Gordon, J. Biol. Chem., 1988, 263, 2070–2078 Search PubMed; L. Ellgaard and A. Helenius, Nat. Rev. Mol. Cell Biol., 2003, 4, 181–191 CrossRef PubMed.
- A. Martinez, J. A. Traverso, B. Valot, M. Ferro, C. Espagne, G. Ephritikhine, M. Zivy, C. Giglione and T. Meinnel, Proteomics, 2008, 8, 2809–2831 CrossRef CAS; D. Gilis, S. Massar, N. J. Cerf and M. Rooman, Genome Biol., 2001, 2, 1–12 CrossRef; M. N. Fodje and S. Al-Karadaghi, Protein Eng., 2002, 15, 353–358 CrossRef.
Footnote |
| † Electronic supplementary information (ESI) available: The compounds preparation details, 1H NMR data, MS data, PL spectra and CLSM data. See DOI: 10.1039/c9cc08494k |
| This journal is © The Royal Society of Chemistry 2020 |


![[thin space (1/6-em)]](https://www.rsc.org/images/entities/char_2009.gif) 000 fluorescent pixels in a CLSM image at each time point. Each bar represents average ± S.D. of four images (
000 fluorescent pixels in a CLSM image at each time point. Each bar represents average ± S.D. of four images (