Nano Au/Pd-catalysed ‘on-water’ synthesis of C3–C3′ diaryl-oxindole scaffolds via N2-selective dearomatization of indole†
Shivanee Borpatra
Gohain
a,
Monika
Basumatary
b,
Purna K.
Boruah
cd,
Manash R.
Das
 cd and
Ashim Jyoti
Thakur
 *a
*a
aDepartment of Chemical Sciences, Tezpur University, Napaam 784028, Assam, India. E-mail: ashim@tezu.ernet.in
bPhytochemistry Division, Defence Research Laboratory, Solmara, Tezpur 784001, India
cAdvance Materials Group, Materials Sciences and Technology Division, CSIR-North East Institute of Sciences and Technology, Jorhat, Assam, India
dAcademy of Scientific and Innovative Research, CSIR-NEIST Campus, India
First published on 22nd November 2019
Abstract
‘On-water’ synthesis of 2,2-bis(indoly-3-yl)indoline-3-ones via N2-selective dearomatization of ‘(N–H) protection-free’ indole derivatives is described. An oxidative homo trimerization of indole via nano Au/Pd catalysis with oxone as additive was successfully demonstrated for the first time. In situ generation of isatin at room temperature and with water as solvent are key features.
Introduction
Nanoparticle (NP)-assisted synthesis of complex organic/chiral molecules is a major domain for reactions.1a NP-derived homogeneous catalysts are highly effective resources; whereas heterogeneous NP catalysis highlights routes for catalyst recyclability, continuous processing and ease of separation, thereby introducing green and cost-effective alternatives.1b–h Despite several promising attributes, ‘on-water’ NP-catalysed methodologies have not yet found broad applications in chiral molecule synthesis.2Water, as a naturally abundant, non-toxic, cost-effective, environmentally benign and non-flammable reaction medium, has an unassailable position in the area of green solvents.3 With developments in ‘on-water’ reactions, studies lead to the discovery of the importance of the hydrogen bond (H-bond) in catalysing reactions. Mechanistically, transition states having stronger H-bonds than the reactants play a key role in such reactions.4,5 ‘On-water’ catalysis is of significant interest in relation to mild reaction conditions, lower costs and elimination of toxic solvents, but is limited to few examples.6
From the vast range of pharmaceutical compounds, N-bonded heterocycles are privileged moieties that form the integral unit in the molecular skeleton of various natural products and pharmaceuticals.7,8 3,3-Diaryloxindoles, a subset of N-bonded heterocycles, are comprised of a quaternary sp3-carbon with a three-dimensional acyclic molecular framework (Fig. 1). Interestingly, synthetic derivatives of this promising motif have accounted for various biological activities and are widely used as chiral synthons or auxiliaries.9,10
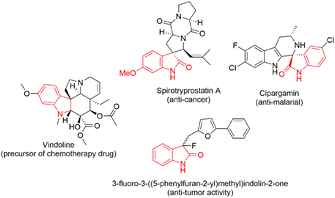 | ||
| Fig. 1 Representative examples of bioactive synthetic derivatives of 3,3-disubstituted oxindole motifs. | ||
To the best of our knowledge, there is only limited precedent for the synthesis of 3,3-diaryloxindoles from free (NH)-indoles, with no reported study for NP-catalysed methodologies. One relevant piece of work is by Guchhait et al. (Scheme 1), who described the PdCl2/TBHP/MnO2 reagent system to convert free indoles to the corresponding C2-quaternary indolinone derivatives.11
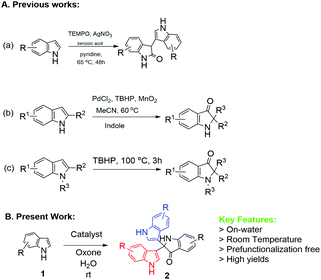 | ||
| Scheme 1 Previous and present approaches for the synthesis of diaryoxindole (R = alkyl or halide group). | ||
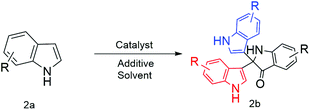
Another piece of related work is that by Liu et al. using Ag-catalysed TEMPO-mediated synthesis12 (Scheme 1). However, two recent methodologies have been reported using the TBHP-mediated route13 at 100 °C (Scheme 1) and I2/cyclohexanone.14 Therefore, development of methods to meet the challenges of optimum reaction conditions would significantly enhance the utility of 3,3-diaryloxindoles. Herein, we describe successful implementation of the strategy shown in Scheme 2, which affords 2,2-bis(indoly-3-yl)indoline-3-ones from free (NH)-indoles through ‘on-water’ catalysis. Notably, this process utilizes synthesized NPs as catalyst to investigate the optimum reaction conditions.
Results and discussion
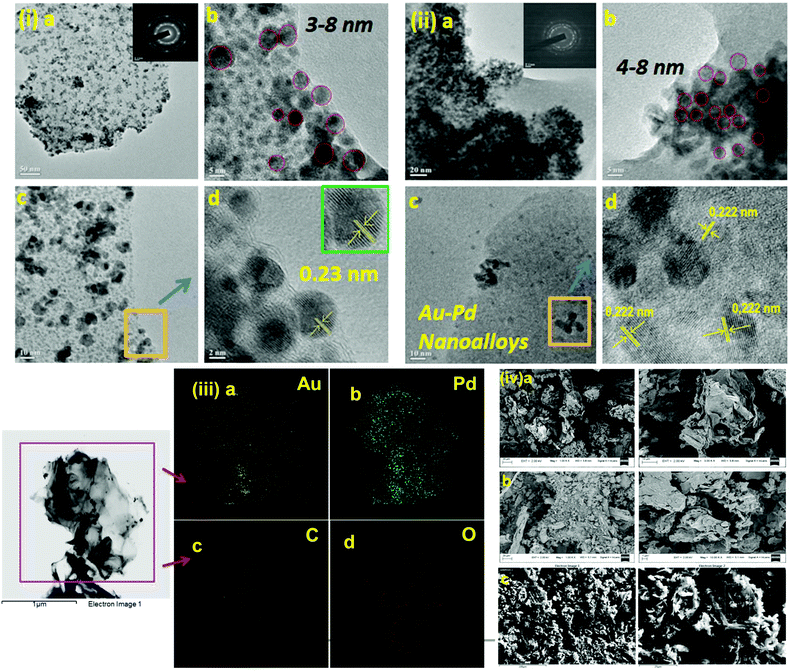
We initiated a comparison-based study of ‘on-water’ catalysis by Au NPs, Pd-rGO (reduced graphene oxide) nanocomposite, Au/Pd-rGO nanocomposite and Au–Pd-rGO nanocomposite (Scheme 2), respectively. The synthesized catalysts were characterized by various analytical techniques prior to investigation in catalytic applications.The transmission electron microscopy (TEM) images of Au NPs, GO, Pd-rGO nanocomposite and Au–Pd-rGO nanocomposite are shown in Fig. 2(i and ii) and Fig. 3(i and ii), respectively. Fig. 2(i) shows well-dispersed spherical Au NPs of size 10–30 nm.15 The polycrystalline nature of the Au NPs was observed from the selected-area electron diffraction (SAED) pattern (inset of Fig. 2(i, a); Fig. S1, ESI†), and was similar to the results reported by Zheng et al.16 The formation of well exfoliated and dispersed sheet-like layers of GO is evident (Fig. 2(ii); Fig. S2, ESI†), with partial folding showing minimal wrinkles.17 The synthesized Pd NPs, of size 3–8 nm, are uniformly immobilized on in situ synthesized rGO sheets (Fig. 3(i); Fig. S3, ESI†). The high-resolution TEM (HRTEM) image (inset of Fig. 3(i, a)) shows the high polycrystalline nature of the Pd-rGO nanocomposite.18–20 The TEM image (Fig. 3(ii, b); Fig. S4(c), ESI†) of the bimetallic Au–Pd NPs reveals Au–Pd nanoalloys with particle sizes in the range 4–8 nm, i.e. <10 nm, with increased uniform distribution on rGO compared with that of the Pd-rGO nanocomposite. This could be attributed to the presence of strong NP–NP interactions between Au NPs and Pd NPs in the Au–Pd-rGO nanocomposite, while only Pd–Pd NP interactions occur in the Pd-rGO nanocomposite.21–24 This interaction agrees with similar strong NP–NP synergistic effects reported by Meijboom and co-workers, and thus rGO favours a good template for decoration of highly dispersed nanoalloys of smaller dimension.25
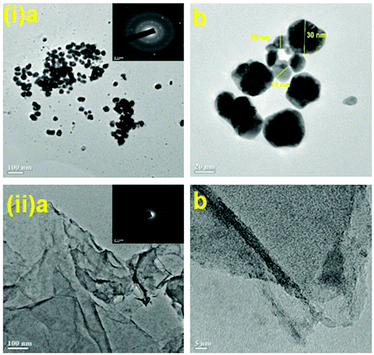 | ||
| Fig. 2 (i) TEM images of Au NPs (inset in (a) shows SAED pattern of Au NPs) and (ii) TEM images of GO (inset in (a) shows SAED pattern of GO). | ||
To determine the distribution of elements (Au and Pd) in the alloy nanostructure of Au–Pd-rGO the nanocomposite, corresponding elemental mapping analysis was carried out. Fig. 3(iii, a and b) clearly shows homogeneous distribution of Au and Pd NPs and their distributions almost overlap with each other, indicating the formation of an Au–Pd alloy nanostructure rather than individual Au and Pd NPs.26a Similarly, Fig. 3(iii, c and d) shows the elemental mapping of C and O with a homogeneous elemental dot structure of C and O, respectively, due the presence of rGO sheets.
Fig. S5† shows the TEM images of core–shell Au–Pd NPs. The average diameter of the core–shell Au–Pd NPs was found to be around 40 nm. The core–shell nanostructure is clearly visible in the TEM images, where the core is darker.26b The core of the nanostructure was identified as Au NPs and the shell is considered to be Pd, which correlates with the literature reports.
The surface morphology and elemental composition were studied by field emission scanning electron microscopy-energy-dispersive X-ray spectroscopy (FESEM-EDS) analysis. The in situ synthesized rGO was accompanied by reduction of the oxygen-containing functional groups in GO, finally indicating destruction of the sheet-like morphology of GO (Fig. S6, ESI†) and immobilization of NPs. Comparing the FESEM images, it is observed that the lamellar morphology of the GO sheets was destroyed in the Pd-rGO nanocomposite (Fig. S7, ESI†) and the Au–Pd-rGO nanocomposite, which reveals the conversion of GO to rGO in the Pd-rGO (Fig. S8, ESI†) and Au–Pd-rGO nanocomposites (Fig. 3(iv)).27–29
Brunauer–Emmett–Teller (BET) surface analysis also showed decrease in surface area of the Pd-rGO nanocomposite (77.120 m2 g−1) compared with unsupported rGO (361 m2 g−1) (Fig. S9, ESI†). The N2 adsorption/desorption isotherm analyses resulted in a type 4 isotherm, suggesting the presence of micro- and mesopores and a decrease in the surface area reveals partial restacking of rGO layers and blocked pores due to NP interactions.30,31 It was interesting to note that the morphology of the Au–Pd-rGO nanocomposite was more globular-like compared with the Pd-rGO nanocomposite, which may be due to evenly distributed Au–Pd nanoalloys on rGO. Previously, such similar structures were also observed by Berry et al. and attributed to microwave (MW)-assisted in situ synthesized bare surfaced Au NPs on GO.32 The presence of Au, Pd, C and O was further confirmed by EDS analyses (Table 1), i.e. only Pd present in the Pd-rGO nanocomposite, whereas both Pd and Au were present in the Au–Pd-rGO nanocomposite (Fig. S10, ESI†).33
| Materials | C | O | Au | Pd |
|---|---|---|---|---|
| Pd-rGO nanocomposite | 52.5 | 31.3 | — | 16.2 |
| Au–Pd-rGO nanocomposite | 45.43 | 33.4 | 0.34 | 20.82 |
Wide-angle powder X-ray diffraction (PXRD) measurements were performed to further compare the bimetallic Au–Pd NPs with the XRD patterns of the individual GO, Au NPs and Pd-rGO nanocomposite materials. The characteristic peak of GO at 12.4°, a shift from that of graphite at 26.4°, and small peaks at 2θ = 18.4°, 26.07° and 42.39° indicate intercalating oxygen-containing functional groups within the carbon nanosheets (Fig. 4).34 The Pd-rGO nanocomposite shows a peak at 25.4°, corresponding to the (002) reflection of rGO, and a new peak at 40.05°, which corresponds to the (111) plane of Pd NPs with face-centred cubic structure (JCPDS No. 05-0681) (Fig. 4(b)).18,35,36 For Au–Pd-rGO, both crystalline phases of monometallic Au NPs and Pd NPs were visible at 2θ of 38.39°, 40.05°, 44.2°, 64.64° and 77.76°. It can be seen that each diffraction peak of the Au–Pd-rGO nanocomposite material was located between those of Au NPs and the Pd-rGO nanocomposite. In addition, the diffraction peaks of the Au–Pd NPs are shifted slightly to higher angles, when compared with the standard diffraction pattern of Au, due to the incorporation of Pd NPs (Fig. 4(c); Fig. S11, ESI†). In the XRD diffraction pattern of Au NPs, intense diffraction peaks are observed at 2θ values of 37.98°, 44.14°, 64.65° and 77.35°, which were indexed to the (111), (200), (220) and (311) reflections of crystalline metallic Au, respectively (JCPDS no. 04-0784) (Fig. 4(d)).29
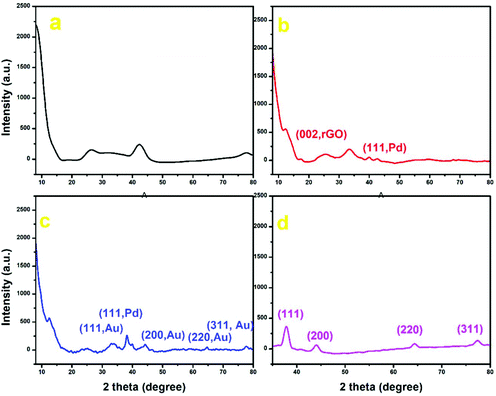 | ||
| Fig. 4 PXRD plot of (a) GO (black), (b) Pd-rGO nanocomposite (red), (c) Au–Pd-rGO nanocomposite (blue) and (d) Au NPs (pink). | ||
X-ray photoelectron spectroscopy (XPS) analyses were carried out to understand the surface properties and oxidation state of the metal (Pd and Au) content in Pd-rGO and Au–Pd-rGO nanocomposites (Fig. 5 and 6). The survey scan XPS spectrum of Pd confirmed the existence of Pd, C and O in Pd-rGO (Fig. 5(a)). Fig. 5(b) shows a typical Pd 3d XPS spectrum of Pd-rGO was obtained, with two prominent peaks at binding energies of 335.5 and 340.8 eV assigned as Pd 3d5/2 and Pd 3d3/2, respectively, which are coincident with the reported values for the Pd0 state.37a The high-resolution C 1s spectrum fitted with three different peaks at binding energies of 284.8, 286.7 and 288.4 eV corresponding to the C![[double bond, length as m-dash]](https://www.rsc.org/images/entities/char_e001.gif) C/C–C, C–O and C
C/C–C, C–O and C![[double bond, length as m-dash]](https://www.rsc.org/images/entities/char_e001.gif) O of rGO in Pd-rGO, respectively (Fig. 5(c)). Similarly, the high-resolution O 1s spectrum fitted with two binding-energy peaks at 529.9 and 533.3 eV belonging to the C
O of rGO in Pd-rGO, respectively (Fig. 5(c)). Similarly, the high-resolution O 1s spectrum fitted with two binding-energy peaks at 529.9 and 533.3 eV belonging to the C![[double bond, length as m-dash]](https://www.rsc.org/images/entities/char_e001.gif) O and C–OH bonds of rGO (Fig. 5(d)).
O and C–OH bonds of rGO (Fig. 5(d)).
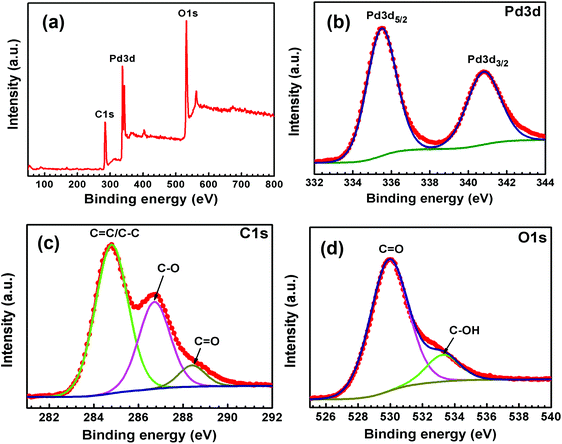 | ||
| Fig. 5 XPS (a) survey spectrum and high-resolution spectra of (b) Pd 3d, (c) C 1s and (d) O 1s of Pd-rGO. | ||
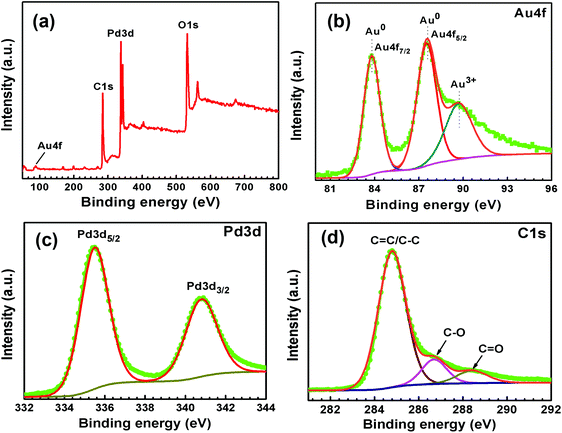 | ||
| Fig. 6 XPS (a) survey spectrum and high-resolution spectra of (b) Au 4f, (c) Pd 3d, and (d) C 1s of Au–Pd-rGO. | ||
The survey scan XPS spectrum of Au–Pd-rGO is shown in Fig. 6(a), which exhibited four different binding-energy peaks belong to Au, Pd, C and O. The high-resolution XPS spectrum of Au 4f of Au–Pd-rGO was obtained, with three binding-energy peaks at 83.8, 87.5 and 89.7 eV. The major peaks at 83.8 and 87.5 eV are assigned to the spin–orbit splitting of Au 4f7/2 and Au 4f5/2 of the Au0 state (Fig. 6(b)). Otherwise, the less intense peak at 89.7 eV was obtained for the Au3+ state, which may be caused by the existence of a small amount of unreduced HAuCl4 salt during the synthesis process.37b The high-resolution Pd 3d peaks of Au–Pd-rGO, similar to the Pd-rGO nanocomposite, are shown in Fig. 6(c). The existence of Au0 and Pd0 demonstrates the successful formation of Au–Pd NPs on the rGO support.37c The high-resolution C 1s XPS spectrum was fitted with three peaks at binding energies of 284.8, 286.7 and 288.4 eV, corresponding to the C–C/C![[double bond, length as m-dash]](https://www.rsc.org/images/entities/char_e001.gif) C, C–O and C
C, C–O and C![[double bond, length as m-dash]](https://www.rsc.org/images/entities/char_e001.gif) O bonds of rGO (Fig. 6(d)). The peak intensities corresponding to C–O and C
O bonds of rGO (Fig. 6(d)). The peak intensities corresponding to C–O and C![[double bond, length as m-dash]](https://www.rsc.org/images/entities/char_e001.gif) O bonds decreased in Au–Pd-rGO compared with those in the Pd-rGO, which indicated further reduction of the rGO sheets during the synthesis of Au–Pd-rGO.37d The high-resolution O 1s spectrum of Au–Pd-rGO was fitted with two peaks at binding energies of 530.2 and 533.1 eV, assigned as C
O bonds decreased in Au–Pd-rGO compared with those in the Pd-rGO, which indicated further reduction of the rGO sheets during the synthesis of Au–Pd-rGO.37d The high-resolution O 1s spectrum of Au–Pd-rGO was fitted with two peaks at binding energies of 530.2 and 533.1 eV, assigned as C![[double bond, length as m-dash]](https://www.rsc.org/images/entities/char_e001.gif) O and C–OH bonds, respectively (Fig. S12, ESI†).
O and C–OH bonds, respectively (Fig. S12, ESI†).
The high-resolution XPS spectra of Au 4f and Pd 3d for core–shell Au–Pd NPs are shown in Fig. S13(a and b).† The deconvoluted XPS results and peak position of core–shell Au–Pd NPs almost remain the same in the Au–Pd-rGO nanocomposite. The high-resolution XPS spectrum of Au 4f was obtained with two major peaks at binding energies of 83.7 and 87.3 eV, belonging to the spin–orbit splitting of Au 4f7/2 and Au 4f5/2 of the Au0 state (Fig. S13a†). The Pd0 state peaks were also observed in the high-resolution Pd 3d XPS spectrum, located at 335.5 eV and 340.8 eV, and assigned as Pd 3d5/2 and Pd 3d3/2, respectively (Fig. S13b†).
The higher thermal stability of nano Pd-rGO was confirmed by both thermogravimetric analysis and differential scanning calorimetry (DSC). The weight loss of the Pd-rGO nanocomposite was 15.56% at 208 °C and 3.8% at 361 °C, much lower than that of GO, i.e. about 79.423% at 182.57 °C due to labile oxygen-containing organic functional groups in GO (Fig. S14, ESI†).27 Furthermore, these results are in agreement with the DSC results in the form of the exothermic reduction temperature noticed in the synthesized the Pd-rGO nanocomposite catalyst at 208 °C (Fig. S15, ESI†). Analogously, incorporation of Pd NPs within rGO leads to a substantial increase in the stability of the functional groups of the Pd-rGO nanocomposite.38,39
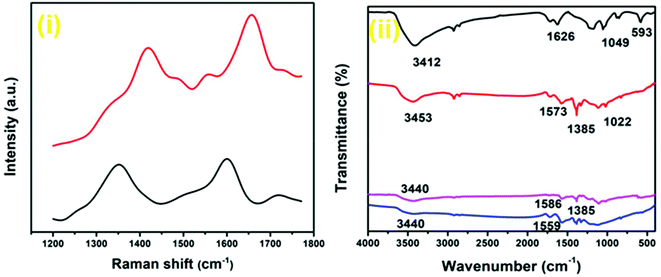
Raman spectroscopy, one of the most important techniques to investigate carbon-based materials, was utilized to further characterize the composition of the synthesized nanocomposites (Fig. 7(i); Fig. S16, ESI†). In the Raman spectrum of the Au–Pd-rGO nanocomposite, a sharp ‘G band’ is observed at 1656 cm−1. A weak band at 1554 cm−1 can be ascribed to the lattice vibrations due to motion of the NPs, and a similar result was also reported by Zhao et al.40 The peak at 1419 cm−1 referred to as the ‘D band’ represents the surface disorder and defects in the structure. The ‘D band’ at 1349 cm−1 in the Pd-rGO nanocomposite is associated with the breathing mode, while the ‘G band’ at 1600 cm−1 is the result of carbon bonds with different bond energies. In the Au–Pd-rGO nanocomposite, the ‘G band’ is more intense and blue-shifted to higher wave number compared with the Pd-rGO nanocomposite. On the other hand, the ‘D band’ broadens and exhibits less intensity, evidence of a decrease in disorder and an increase in stability.41–43
The MW-assisted in situ synthesized Pd-rGO nanocomposite (Fig. 7(ii); Fig. S17, ESI†) revealed an extra peak at 1385 cm−1 in the Fourier-transform infrared (FT-IR) spectroscopic analysis, which is ascribed to the C–O stretching band of carbonyl species adsorbed on Pd NPs. An instance of such a variation in FT-IR spectrum was reported by Freund et al. for the surface reactivity of Pd NPs.44 The presence of –OH (3453 cm−1), C![[double bond, length as m-dash]](https://www.rsc.org/images/entities/char_e001.gif) O (1573 cm−1) and C–O (1022 cm−1) was also confirmed. However, the Pd NP-supported rGO synthesized without using MWs shows peaks for C
O (1573 cm−1) and C–O (1022 cm−1) was also confirmed. However, the Pd NP-supported rGO synthesized without using MWs shows peaks for C![[double bond, length as m-dash]](https://www.rsc.org/images/entities/char_e001.gif) O (1559 cm−1) and less prominent peaks of –OH (3440 cm−1) and C–OH (Fig. 7(ii)). The peaks of –OH (3440 cm−1), C
O (1559 cm−1) and less prominent peaks of –OH (3440 cm−1) and C–OH (Fig. 7(ii)). The peaks of –OH (3440 cm−1), C![[double bond, length as m-dash]](https://www.rsc.org/images/entities/char_e001.gif) O (1586 cm−1) and C–O (1385 cm−1) were also observed for the Au–Pd-rGO nanocomposite. The FT-IR spectrum of GO displayed the characteristic stretching peaks, namely, –OH (3412 cm−1), C
O (1586 cm−1) and C–O (1385 cm−1) were also observed for the Au–Pd-rGO nanocomposite. The FT-IR spectrum of GO displayed the characteristic stretching peaks, namely, –OH (3412 cm−1), C![[double bond, length as m-dash]](https://www.rsc.org/images/entities/char_e001.gif) O (1626 cm−1), C–OH (1049 cm−1) and C–H (593 cm−1) (Fig. S17, ESI†).27
O (1626 cm−1), C–OH (1049 cm−1) and C–H (593 cm−1) (Fig. S17, ESI†).27
The UV–vis spectrum of the Pd-rGO nanocomposite catalyst showed a peak at ∼400 nm, indicating the formation of Pd NPs with reference to the characteristic peak at 281 nm of Pd(OAc)2. Furthermore, a peak at ∼250 nm may be attributable to the support, i.e. rGO, while Au NPs showed a characteristic broad absorption peak at ∼530 nm (ref. 45 and 46) (Fig. S18, ESI†).
After the characterization of the nanocatalysts, in order to have better conversion, we optimized the reaction conditions and the results are summarised in Table S1.† A control experiment was carried out by taking indole (0.0586 g, 0.5 mmol) and phenylacetylene (0.0258 g, 0.25 mol) as model substrates with stirring at room temperature and without using any catalyst and solvent (Scheme 3).47 Under these conditions, the reaction did not proceed and the starting materials remained intact. Then, we added toluene (2 ml) and oxone (0.031 g, 0.25 mmol) and Pd-rGO nanocomposite (0.5 mol%), followed by continued stirring for 16 h at 90 °C, and isolated the product 3c, 1H,1′′H-[3,2′:2′,3′′-terindol]-3′(1′H)-one instead of 3b, 3,3′-(2-phenylethane-1,1-diyl)bis(1H-indole), in 15% yield (Scheme 3). Then, we modified the control experiment by taking indole (0.0586 g, 0.5 mmol) as a model substrate without using any catalyst and solvent (Table 2, entry 1). Under these conditions, the product 1H,1′′H-[3,2′:2′,3′′-terindol]-3′(1′H)-one was not formed. In order to improve the yield, we searched for the best experimental conditions at 90 °C. By keeping this in mind, we performed the reaction in toluene and without catalyst or additive [Table 2, entry 2]. Unsatisfied with these results, we felt it was necessary to use a catalyst to increase the yield. Therefore, we conducted the reaction with bulk Pd(OAc)2, bulk HAuCl4 and additives K2CO3, Na2CO3 and Cs2CO3, respectively, but no product was formed (Table S1,† entries 3–7 and 9–11). However, the product was formed in trace amount when the reaction was conducted with oxone (Table S1,† entries 7, 12, 18, 21 and 25). We also attempted to compare the catalytic action of Pd-rGO nanocomposite, Au NPs and Au–Pd-rGO nanocomposite with oxone and got better results (Table S1,† entries 18, 21 and 25). These comparative studies led us to undertake the reaction with oxone as a model additive for optimizing the best experimental conditions for the reaction.
| Entry | Substrate | Time (h) (nano Au/Pd-rGO, nano Au–Pd-rGO) | Yieldb (%) | |
|---|---|---|---|---|
| Nano Au/Pd-rGO | Nano Au–Pd-rGO | |||
| a Reaction conditions: Indole (0.5 mmol), H2O (2 ml), room temperature. b Isolated yields. | ||||
| 1 | X = H, Y = H, Z = H, R = H | 3, 6 | 85 | 90 |
| 2 | X = OMe, Y = H, Z = H, R = H | 3, 5 | 89 | 91 |
| 3 | X = Br, Y = H, Z = H, R = H | 3, 7 | 78 | 79 |
| 4 | X = H, Y = H, Z = H, R = CH3 | 3, 8 | 81 | 80 |
| 5 | X = H, Y = Br, Z = H, R = H | 3, 9 | 78 | 81 |
| 6 | X = F, Y = H, Z = H, R = H | 4, 9 | 76 | 79 |
| 7 | X = Cl, Y = H, Z = H, R = H | 3, 6 | 70 | 75 |
| 8 | X = H, Y = H, Z = Br, R = H | 3, 7 | 75 | 79 |
| 9 | X = NO2, Y = H, Z = H, R = H | 5, 12 | 68 | 71 |
We proceeded to repeat the model reaction with different solvents and temperature. As indicated in Table S2 (ESI†), the Pd-rGO nanocomposite afforded 75% yield in water as solvent at 90 °C and 8 h (Table S2,† entry 8). With nano Au, a 71% yield of the product was isolated when the reaction was conducted at 60 °C, but with a longer reaction time of 12 h (Table S2,† entry 15). Interestingly, when both Pd-rGO nanocomposite and Au NPs were used as catalysts at room temperature with water as solvent, the reaction completed within a shorter time of 3 h and afforded 82% isolated yield (Table S2,† entry 18). However, reaction with the Au–Pd-rGO nanocomposite at room temperature yielded 90% product (Table S2,† entry 23).
Next, we proceeded to repeat the model reaction with different quantities of the catalyst and oxone. As mentioned in Table S3,† by decreasing the quantity of catalyst 1, i.e. Pd-rGO nanocomposite, from 0.5 mol% to 0.3 mol% and keeping the quantity of catalyst 2 at 2.5 μmol%, the yield clearly improved, along with reduction of the reaction time (Table S3,† entry 7). Furthermore, increasing the quantity of the catalysts and decreasing the quantity of oxone to 0.1 mol% led to lower yields.
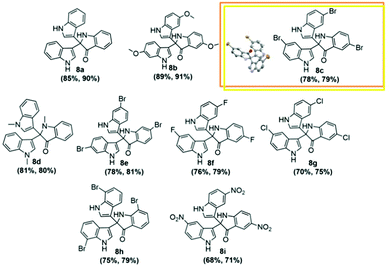
With the optimized reaction conditions to hand (Table 2, entry 1), we tested the substrate diversity for the formation of 2b (Scheme 2) in both Au/Pd-rGO nanocomposite and Au–Pd-rGO nanocomposite catalyst systems. When we altered 2a with substituted indoles, the corresponding products (Fig. 8a–i) were obtained in yields between 68% and 91% (Table 2). Here, it is noteworthy that indoles with an electron-withdrawing group attached to the 5-position benefited the reaction and provided satisfactory yields (Table 2, entries 2, 3, 6 and 7). As a comparison, reaction with N-methylindole proceeded with a faster rate, producing the corresponding 8d in 81% and 80% yields in both the catalyst systems, respectively (Table 2, entry 4). However, when 5-fuoroindole reacted, it proceeded at a slower rate, and afforded a yield of 76% and 79% in the respective systems (Table 2, entry 6). Substitution of indole at the 6- and 7-positions afforded the corresponding products 8e and 8h (Table 2, entries 5 and 8) with moderate yields.
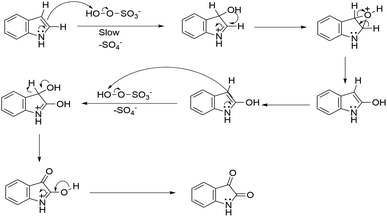
Based on investigation of the reactions (Table S4, ESI†) and substrate diversity, a plausible mechanism for the transformation (Scheme 4) is proposed via oxone with potassium peroxymonosulfate existing as an HSO5− ion, a weak nucleophile in solution. The attack of the OH+ ion of oxone onto the nucleophilic centre C-3 of indole (3) generates isatin (1) in situ through the various intermediate compounds (Scheme 5).48 As depicted in Scheme 6, isatin (1) becomes more electrophilic at the catalyst surface and easily facilitates nucleophilic attack by the indole molecule (3) to form a hydroxyl intermediate (4). Subsequently, the intermediate 4 reacts with another indole (5) to form the final product (7), [3,3′:3′,3′′-terindolin]-2′-one, after removal of a water molecule.49 By postulating the possible mechanism for the formation of 8a, we found that the in situ generation of isatin did occur at the beginning and a key intermediate, 4, was formed.
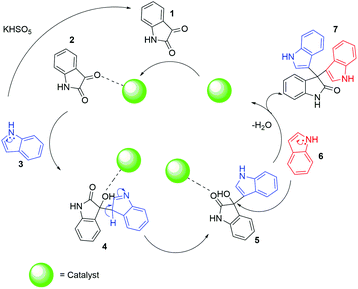 | ||
| Scheme 6 Proposed mechanism of catalytic activity in the synthesis of 2,2-bis(indol-3-yl)indoline-3-ones, 7. | ||
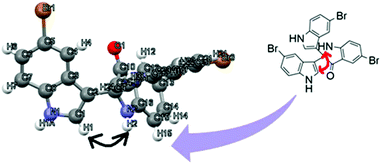
To identify the absolute configuration of the 2,2-bis(indol-3-yl)indolin-3-one derivatives, nuclear Overhauser effect (NOE)-NMR spectroscopy was chosen as a convenient tool. A one-dimensional (1D) NOE between the N–H (free N–H, indole) and the H (C1) of the adjacent aromatic indolyl moiety [Fig. 9] was observed in 8c. The relative stereochemistry of the 2,2-bis(indol-3-yl)indolin-3-one derivatives was assigned by X-ray crystallography for 8c (CCDC: 1920668†) recrystallized from mixtures to provide crystalline material as a single chiral enantiomer (Table S5, ESI†). Based on the NOE-NMR and single-crystal analyses, the structure of 2,2-bis(indol-3-yl)indolin-3-one was confirmed.
Further, inductively coupled plasma-optical emission spectrometry (ICP-OES) analyses of the Pd-rGO and Au–Pd-rGO nanocomposite were carried out with respect to the reaction leading to the formation of product 8a. The result reflected a trace amount of leaching of Pd and Au even after the third cycle, an encouraging result.
Conclusion
We have developed a greener methodology for the synthesis of 3C-functionalized oxindoles and compared the catalytic activity of both Au/Pd-rGO and Au–Pd-rGO nanocomposites. The catalytic performance of the Au–Pd-rGO nanocomposite showed high yields of products using water, the green solvent. The reaction is applicable to a wide range of indole substrates. In addition, the reaction at room temperature is a sustainable approach towards rapid synthesis of several bioactive indole derivatives.Conflicts of interest
There are no conflicts to declare.Acknowledgements
The authors are thankful to the Council of Scientific and Industrial Research (CSIR), India for financial support (02(0281)/1 6/EMR-ll dated 06-12-2016) and Tezpur University for providing the infrastructure facilities required for this research work. The authors would also like to acknowledge Mr Biraj Jyoti Borah (Tezpur University) for carrying out single-crystal X-ray studies, Dr Bipul Sarma (Tezpur University) for solving the X-ray structure, North-Eastern Hill University, Shillong, India for TEM analysis and the Council of Scientific and Industrial Research–North East Institute of Science and Technology (CSIR-NEIST), Jorhat, India for XPS and TEM analyses.Notes and references
- (a) H. Cong and J. A. Porco Jr., ACS Catal., 2012, 2, 65–70 CrossRef CAS; (b) S. Seraj, P. Kunal, H. Li, G. Henkelman, S. M. Humphrey and C. J. Werth, ACS Catal., 2017, 7, 3268–3276 CrossRef CAS; (c) T. Asset, R. Chattot, M. Fontana, B. Mercier-Guyon, N. Job, L. Dubau and F. Maillard, ChemPhysChem, 2018, 19, 1552–1567 CrossRef CAS; (d) Y. Li, X. M. Hong, D. M. Collard and M. A. El-Sayed, Org. Lett., 2000, 2, 2385–2388 CrossRef CAS; (e) M. Pérez-Lorenzo, J. Phys. Chem. Lett., 2012, 3, 167–174 CrossRef; (f) N. A. Galiote, U. Ulissi, S. Passerini and F. Huguenin, J. Phys. Chem. C, 2018, 122, 15826–15834 CrossRef CAS; (g) H. Duan, D. Wang and Y. Li, Chem. Soc. Rev., 2015, 44, 5778–5792 RSC; (h) B. S. Takale, M. Bao and Y. Yamamoto, Org. Biomol. Chem., 2014, 12, 2005–2027 RSC.
- T. Kitanosono, K. Masuda, P. Xu and S. Kobayashi, Chem. Rev., 2018, 118, 679–746 CrossRef CAS.
- M. Álvarez, R. Gava, M. R. Rodríguez, S. G. Rull and P. J. Pérez, ACS Catal., 2017, 7, 3707–3711 CrossRef.
- Y. Jung and R. A. Marcus, J. Am. Chem. Soc., 2007, 129, 5492–5502 CrossRef CAS.
- R. N. Butler and A. G. Coyne, J. Org. Chem., 2015, 80, 1809–1817 CrossRef CAS.
- A. Chanda and V. V. Fokin, Chem. Rev., 2009, 109, 725–748 CrossRef CAS.
- E. Vitaku, D. T. Smith and J. T. Njardarson, J. Med. Chem., 2014, 57, 10257–10274 CrossRef CAS.
- R. D. Taylor, M. MacCoss and A. D. G. Lawson, J. Med. Chem., 2014, 57, 5845–5859 CrossRef CAS.
- A. Bort, S. Quesada, Á. Ramos-Torres, M. Gargantilla, E. M. Priego, S. Raynal, F. Lepifre, J. M. Gasalla, N. Rodriguez-Henche, A. Castro and I. Díaz-Laviada, Sci. Rep., 2018, 8, 4370 CrossRef.
- S. Edmondson, S. J. Danishefsky, L. Sepp-Lorenzino and N. Rosen, J. Am. Chem. Soc., 1999, 121, 2147–2155 CrossRef CAS.
- S. K. Guchhait, V. Chaudhary, V. A. Rana, G. Priyadarshani, S. Kandekar and M. Kashyap, Org. Lett., 2016, 18, 1534–1537 CrossRef CAS.
- F. Lin, Y. Chen, B. Wang, W. Qin and L. Liu, RSC Adv., 2015, 5, 37018–37022 RSC.
- J. Kothandapani, S. M. K. Reddy, S. Thamotharan, S. M. Kumar, K. Byrappa and S. S. Ganesan, Eur. J. Org. Chem., 2018, 2762–2767 CrossRef CAS.
- B. Deka, M. L. Deb, R. Thakuria and P. K. Baruah, Catal. Commun., 2018, 106, 68–72 CrossRef CAS.
- S. Guo, L. Wang, S. Dong and E. Wang, J. Phys. Chem. C, 2008, 112, 13510–13515 CrossRef CAS.
- C. Zhou, J. Yu, Y. Qin and J. Zheng, Nanoscale, 2012, 4, 4228–4233 RSC.
- J. Shen, Y. Hu, M. Shi, X. Lu, C. Qin, C. Li and M. Ye, Chem. Mater., 2009, 21, 3514–3520 CrossRef CAS.
- (a) Y. Huang, J. Xie, X. Zhang, L. Xiong and H. Yu, ACS Appl. Mater. Interfaces, 2014, 6, 15795–15801 CrossRef CAS; (b) F. Costantino, M. Nocchetti, M. Bastianini, A. Lavacchi, M. Caporali and F. Liguori, ACS Appl. Nano Mater., 2018, 1, 1750–1757 CrossRef CAS.
- S. Moussa, A. R. Siamaki, B. F. Gupton and M. S. El-Shall, ACS Catal., 2012, 2, 145–154 CrossRef CAS.
- X. Chen, G. Wu, J. Chen, X. Chen, Z. Xie and X. Wang, J. Am. Chem. Soc., 2011, 133, 3693–3695 CrossRef CAS PubMed.
- J. Kim, W. W. Bryan, H. Chung, C. Y. Park, A. J. Jacobson and T. R. Lee, ACS Appl. Mater. Interfaces, 2009, 1, 1063–1069 CrossRef CAS PubMed.
- Y. Mizukoshi, K. Okitsu, Y. Maeda, T. A. Yamamoto, R. Oshima and Y. Nagata, J. Phys. Chem. B, 1997, 101, 7033–7037 CrossRef CAS.
- Y. Mizukoshi, T. Fujimoto, Y. Nagata, R. Oshima and Y. Maeda, J. Phys. Chem. B, 2000, 104, 6028–6032 CrossRef CAS.
- S. Guo, S. Zhang, Q. Fang, H. Abroshan, H. J. Kim, M. Haruta and G. Li, ACS Appl. Mater. Interfaces, 2018, 10, 40599–40607 CrossRef CAS PubMed.
- N. Bingwa, R. Patala, J. Noh, M. J. Ndolomingo, S. Tetyana, S. Bewana and R. Meijboom, Langmuir, 2017, 33, 7086–7095 CrossRef CAS PubMed.
- (a) T. Yao, Q. Zuo, H. Wang, J. Wu, X. Zhang, J. Sun and T. Cui, RSC Adv., 2015, 5, 87831–87837 RSC; (b) D. Jana, A. Dandapat and G. De, J. Phys. Chem. C, 2009, 113, 9101–9107 CrossRef CAS; (c) H. Chen, Y. Li, F. Zhang, G. Zhang and X. Fan, J. Mater. Chem., 2011, 21, 17658–17661 RSC.
- H. P. Mungse and O. P. Khatri, J. Phys. Chem. C, 2014, 118, 14394–14402 CrossRef CAS.
- M. Nasrollahzadeh, S. M. Sajadi, A. Rostami-Vartooni, M. Alizadeh and M. Bagherzadeh, J. Colloid Interface Sci., 2016, 466, 360–368 CrossRef CAS.
- S. Dutta, C. Ray, S. Mallick, S. Sarkar, A. Roy and T. Pal, RSC Adv., 2015, 5, 51690 RSC.
- H. Kim, K. Park, J. Hong and K. Kang, Sci. Rep., 2014, 4, 5278 CrossRef CAS PubMed.
- X. Yang, J. Zhu, L. Qiu and D. Li, Adv. Mater., 2011, 23, 2833–2838 CrossRef CAS.
- K. Jasuja, J. Linn, S. Melton and V. Berry, J. Phys. Chem. Lett., 2010, 1, 1853–1860 CrossRef CAS.
- J. Kim, H. Chung and T. R. Lee, Chem. Mater., 2006, 18, 4115–4120 CrossRef CAS.
- K. Zhang, Y. Zhang and S. Wang, Sci. Rep., 2013, 3, 3448 CrossRef.
- A. O. Biying, V. R. Vangala, C. S. Chen, L. P. Stubs, N. S. Hosmaneb and Z. Yinghuai, Dalton Trans., 2014, 43, 5014–5020 RSC.
- F. Li, H. Li and J. Lang, CrystEngComm, 2016, 18, 1760–1767 RSC.
- (a) S. Sá, M. B. Gawande, A. Velhinho, J. P. Veiga, N. Bundaleski, J. Trigueiro, A. Tolstogouzov, O. M. N. D. Teodoro, R. Zboril, R. S. Varma and P. S. Branco, Green Chem., 2014, 16, 3494–3500 RSC; (b) Y. Tao, A. Dandapat, L. Chen, Y. Huang, Y. Sasson, Z. Lin, J. Zhang, L. Guo and T. Chen, Langmuir, 2016, 32, 8557–8564 CrossRef CAS; (c) P. Fageria, S. Uppala, R. Nazir, S. Gangopadhyay, C. Chang, M. Basu and S. Pande, Langmuir, 2016, 32, 10054–10064 CrossRef CAS; (d) Q. Huang, X. Lin, C. Lin, Y. Zhang, H. Zhang, S. Hu, C. Weic and Q. Tong, Anal. Methods, 2016, 8, 6347–6352 RSC.
- S. Bhuvaneswari, P. M. Pratheeksha, S. Anandan, D. Rangappa, R. Gopalan and T. N. Rao, Phys. Chem. Chem. Phys., 2014, 16, 5284–5294 RSC.
- V. Patil, R. V. Dennis, T. K. Rout, S. Banerjee and G. D. Yadav, RSC Adv., 2014, 4, 49264–49272 RSC.
- W. Zhang, C. Li, K. Gao, F. Lu, M. Liu, X. Li, L. Zhang, D. Mao, F. Gao, L. Huang, T. Mei and J. Zhao, Nanotechnology, 2018, 29, 205301 CrossRef.
- K. N. Kudin, B. Ozbas, H. C. Schniepp, R. K. Prud'homme, I. A. Aksay and R. Car, Nano Lett., 2008, 8, 36–41 CrossRef CAS.
- M. T. H. Aunkor, I. M. Mahbubul, R. Saidur and H. S. C. Metselaar, RSC Adv., 2016, 6, 27807–27828 RSC.
- B. Das, M. Sharma, B. K. Deka, A. Hazarika, Y. Park, A. Hazarika, S. K. Bhargava and K. K. Bania, J. Environ. Chem., 2018, 6, 3167–3176 CrossRef CAS.
- S. Bertarione, D. Scarano, A. Zecchina, V. Johánek, J. Hoffmann, S. Schauermann, J. Libuda, G. Rupprechter and H. Freund, J. Catal., 2004, 223, 64–73 CrossRef CAS.
- M. Nasrollahzadeh, S. M. Sajadi, E. Honarmanda and M. Maham, New J. Chem., 2015, 39, 4745–4752 RSC.
- S. Qin, L. Dong, Z. Chen, S. Zhang and G. Yin, Dalton Trans., 2015, 44, 17508–17515 RSC.
- A. Srivastava, S. S. Patel, N. Chandna and N. Jain, J. Org. Chem., 2016, 81, 11664–11670 CrossRef CAS.
- (a) K. Muniyappan, G. Chandramohan, J. Stephen and A. Periyasami, Res. J. Chem. Sci., 2014, 4, 7–11 CAS; (b) S. Meenakshisundaram and N. Sarathi, Int. J. Chem. Kinet., 2007, 39, 46–51 CrossRef CAS.
- A. Bahuguna, A. Kumar, S. Kumar, T. Chhabra and V. Krishnan, ChemCatChem, 2018, 10, 3121–3132 CrossRef CAS.
Footnote |
| † Electronic supplementary information (ESI) available: General experimental methods, preparation and characterization of the catalysts, general synthetic procedures, recycling potential of nanocatalysts, physical and spectroscopic data of compounds, 1H NMR and 13C NMR spectra of compounds, crystallographic data of compound 8c and NOE NMR of compound 8c. CCDC 1920668. For ESI and crystallographic data in CIF or other electronic format see DOI: 10.1039/c9gc02370d |
| This journal is © The Royal Society of Chemistry 2020 |

