Fermentation of pigment-extracted microalgal residue using yeast cell-surface display: direct high-density ethanol production with competitive life cycle impacts†
Xiaochen
Huang
a,
Shunwen
Bai
 a,
Zhuo
Liu
b,
Tomohisa
Hasunuma
cd,
Akihiko
Kondo
bcd and
Shih-Hsin
Ho
 *a
*a
aState Key Laboratory of Urban Water Resource and Environment, School of Environment, Harbin Institute of Technology, Harbin 150090, PR China. E-mail: stephen6949@hit.edu.cn
bDepartment of Chemical Science and Engineering, Graduate School of Engineering, Kobe University, 1-1 Rokkodai, Nada-ku, Kobe 657-8501, Japan
cEngineering Biology Research Center, Kobe University, 1-1 Rokkodai, Nada-ku, Kobe 657-8501, Japan
dGraduate School of Science, Technology and Innovation, Kobe University, 1-1 Rokkodai, Nada-ku, Kobe 657-8501, Japan
First published on 4th November 2019
Abstract
Microalgae have attracted increasing attention as a potential feedstock for biofuel production. However, direct high-density ethanol production from microalgae is not commercially feasible due to the requirement for complex pre-treatments and insufficient enzymatic hydrolysis. In this study, we successfully developed a consolidated bioprocessing (CBP) system using recombinant Saccharomyces cerevisiae displaying synergistic cellulases/amylases on cell surfaces to overcome energy-conversion limitations. As Chlamydomonas sp. JSC4 can accumulate considerable amounts of carbohydrates and pigments (i.e., lutein), performing four rounds of pigment extraction from wet microalgal biomass using acetone was found to significantly eliminate the need for biomass pre-treatment and increase commercial viability. The pigment-extracted JSC4 residues increased ethanol production by 10.7% and 31.6% compared to raw starch and whole JSC4 cells, respectively. The theoretical ethanol production mass and yield from 300 g L−1 of JSC4 material were 73 g L−1 and 64%, respectively, after fermentation for 72 h in the presence of amylase- and cellulase-displaying yeasts, which are dramatically higher than those reported previously. Life cycle assessment (LCA) further revealed that this CBP system has 2.7- to 10.7-fold lower total environmental impact compared to alternative ethanol production methods using microalgal biomass. 2.43 kg ethanol and additional products of 5 g lutein from 1 kg microalgal biomass significantly increased the total economic output to $60.875. Overall, this study successfully demonstrates a feasible cell-surface display fermentation system for use in direct high-density ethanol production from pigment-extracted microalgal material.
1. Introduction
With increasing global energy consumption and limited supply of fossil fuels, the focus on future energy is steadily shifting to renewable sources, such as ethanol and other biofuels produced from biomass fermentation.1,2 However, the use of food crops as feedstock for first-generation biofuels resulted in increased food prices and socio-ethical issues, while second-generation feedstocks, such as lignocellulosic biomass or agricultural waste, are uneconomical due to the requirement for intensive pre-treatments.3 Microalgae have been developed as a third-generation feedstock, which can effectively accumulate carbohydrates or fatty acids for use in biofuel production, while also performing carbon dioxide (CO2) fixation.4,5 The major microalgal carbohydrates are starch and cellulose, making the conversion of microalgal biomass into monosaccharides for ethanol fermentation highly feasible.5,6 For example, Chlamydomonas can accumulate a large amount of carbohydrates, predominantly in the form of starch, which is highly suitable for ethanol production.7Conventional methods for microalgal ethanol production require disruption of the microalgal cells, as starch and cellulose are mainly located in the chloroplasts and cell walls, respectively.8 Therefore, prior to fermentation these substrates should be hydrolysed either chemically (acid and alkaline treatment) or enzymatically into fermentable sugars such as glucose.9 However, chemical hydrolysis is associated with various environmental concerns, which can hinder downstream processes. For example, acid hydrolysis produces high volumes of acidic waste and cause decomposition of the hydrolyzed sugars into toxic compounds.10 In contrast, enzymatic hydrolysis is an environmentally-friendly process generating a high glucose yield. However, it has a relatively low reaction rate and high operational costs.11 Therefore, to accelerate the process of hydrolysis, biomass is commonly subjected to additional high-cost or energy-consuming pre-treatments.
Some yeast species such as Saccharomyces cerevisiae are able to efficiently convert glucose into ethanol, while having high resistance to the ethanol produced,12 although they still require starch and cellulose hydrolysis prior to fermentation. To overcome this limitation, a consolidated bioprocessing (CBP) system was constructed for simultaneous hydrolytic enzyme production, enzymatic saccharification, and fermentation of the resulting sugars to ethanol.13,14 Cell-surface display techniques involve the use of auto-immobilize enzymes or peptides on the cell surface of microorganisms using microbial functional components.15 Recombinant S. cerevisiae displaying amylolytic or cellulolytic enzymes can result in relatively high ethanol yields from first- or second-generation biomass.16,17 However, no studies have previously reported the use of pigment-extracted microalgal residues as feedstock to directly produce ethanol using this novel recombinant yeast. The difficulty in achieving direct high-density ethanol fermentation has limited the economic feasibility of biofuel production using microalgae biomass.18 To the best of our knowledge, no studies have achieved >50 g L−1 ethanol in one batch, via recombinant yeast systems. Therefore, to accomplish high-density ethanol fermentation from the microalgal residue material, the development of engineered yeast that can produce sufficient quantities of both amylases and cellulases is essential to ensure complete conversion of microalgal residues to ethanol.
Microalgae contain pigments such as β-carotene and lutein that are used as food-additives and pharmaceutical supplements. To further increase the economic feasibility of microalgal ethanol production, novel techniques are required to simultaneously extract value-added pigments, along with the starch present in microalgae. In this study, a high-density ethanol CBP fermentation system was developed using different recombinant S. cerevisiae strains displaying amylases (α-amylase and glucoamylase) and cellulases (BGL, EG, CBHI, and CBHII), for the efficient bioconversion of sugar-rich Chlamydomonas sp. JSC4 biomass to ethanol. Based on previously reported findings,19,20 microalgae were first cultured under suitable conditions to optimize cell growth and the carbohydrate and lutein contents. Then, to decrease operational costs, wet biomass of strain JSC4 was used for the extraction of pigments (e.g., lutein). Following this, biomass with an extremely high carbohydrate content (mainly starch and cellulose) was used for direct ethanol production using the engineered yeast BY4741. In addition, a life cycle assessment (LCA) used to reveal the potential trade-offs between environmental benefits and hindrances has been applied in several studies with regard to biofuel production from microalgae.21,22 Here, LCA was performed to comprehensively evaluate the environmental impacts of this method compared to other several microalgal-based ethanol production methods. These findings provide novel insights into the optimization of direct high-density ethanol yields from pigment-extracted microalgal biomass via cell-surface display engineering. This cost-effective and feasible microalgal-ethanol production strategy may help in overcoming the limitations in the use of microalgal biomass to produce ethanol.
2. Methods and materials
2.1 Microalgal strain and growth conditions
The Chlamydomonas sp. JSC4 strain used in this study was isolated from the coastal area of southern Taiwan. The 18S rDNA sequence for this strain has been deposited in the National Centre for Biotechnology Information GenBank Database (accession no. KF 383270).19 The strain JSC4 was pre-cultured in MB6N medium (initial pH = 6.8) with an agitation rate of 400 rpm, consisting of 8.8 mM NaNO3, 0.22 mM K2HPO4, 0.3 mM MgSO4·7H2O, 0.17 mM CaCl2·2H2O, 0.43 mM KH2PO4, 0.43 mM NaCl and essential trace elements, for 3–4 days. Inoculation of 80 mg L−1 JSC4 cells was performed in a 10 L photobioreactor (PBR) containing the same medium with the pre-culture, culturing at 30 °C with a continuous supply of 2% CO2 at an aeration rate of 0.05 vvm. NaNO3 serving as the nitrogen source was initially added in a concentration of 8.8 mM. The light intensity was maintained at ∼400 μmol m−2 s−1.2.2 Determination of biomass concentration, nitrate concentration, and CO2 fixation rate
The microalgal biomass and nitrate concentrations were determined by measuring the optical density at OD685 and OD220 using a UV/Vis spectrophotometer (model U-2001, Hitachi; Tokyo, Japan), respectively. The detailed information for the determination of biomass concentration and nitrate concentration is described in the ESI.† The CO2 fixation rate (FCO2) was calculated based on the typical molecular formula of microalgal biomass (CO0.48H1.83N0.11P0.01),23 as described in the ESI.†2.3 Determination of lipid and carbohydrate contents
Microalgal cells were harvested, washed and lyophilized as described above. The dried cells were dissolved in 1 mL of 60% (w/w) KOH solution and disrupted with 0.5 mm glass beads using a multi-bead shocker (Yasui Kikai, Osaka, Japan), at 4 °C for 25 min. The total lipid content was extracted and then esterified to fatty acid methyl esters (FAMEs), using a fatty acid methylation kit (Nacalai Tesque, Kyoto, Japan). The FAMEs were identified and quantified by gas chromatography-mass spectrometry (GC/MS) using a GCMS-QP2010 Plus (Shimadzu; Kyoto, Japan) as described previously.24 The lipid content (CLipid) and productivity (PLipid) were calculated using the formulas described in eqn (1) and (2): | (1) |
 | (2) |
The total carbohydrate concentration and composition in strain JSC4 were determined using the modified quantitative saccharification (QS) method, according to the National Renewable Energy Laboratory (NREL). Briefly, the lyophilized microalgal cell powder was dissolved in 3 mL of 72% (w/w) sulfuric acid and incubated at 30 °C for 20 min. The obtained primary hydrolysate was diluted in 4% (w/w) sulfuric acid and incubated at 121 °C for 20 min. The supernatant was centrifuged, neutralized and analyzed by high-performance liquid chromatography (HPLC, Hitachi L-2490) using an ICSep ICE-COREGEL 87H3 column for sugar determination. The carbohydrate content (CC) and productivity (PC) were calculated according to eqn (3) and (4) as follows:
 | (3) |
 | (4) |
2.4 Determination of lutein and β-carotene contents
Lutein and β-carotene were extracted according to the modified versions of previously reported protocols.25 Lyophilized cells were dissolved in KOH to disrupt cells and hydrolyze lipids. After incubating this reaction mixture in a water bath at 40 °C for 40 min, 20 mL diethyl ether was added to extract lutein and β-carotene. The extracts were purged under a continuous N2 flow and the resulting precipitate was dissolved in acetone and analysed by HPLC26 equipped with a YMC Carotenoid RP-30 column (particle size 5 μm, 4.6 × 250 nm; YMC Europe, Schermbeck, Germany). The binary mobile phase consisted of solvent A (3% deionized H2O in methanol containing 0.05 M ammonium acetate) and solvent B (100% tert-butyl methyl ether). Both mobile phases also contained 0.05% triethylamine (TEA) and 0.01% (w/v) butylated hydroxytoluene (BHT). The extracts were eluted at a flow rate of 1 mL min−1 and the absorbance was measured at 450 nm. The contents of lutein (CLutein, mg g−1) and β-carotene (Cβ-carotene, mg g−1) were calculated using their respective quantification standards (Sigma Chemical Co., St Louis, MO, USA) and their productivity (PLutein and Pβ-carotene) was determined according to eqn (5) and (6) as follows: | (5) |
 | (6) |
2.5 Biochemical composition and microscopic analysis of JSC4 biomass
Microalgal pigments were extracted in 100% acetone (1 g per 30 mL) via sonication treatment (100 W, 40 kHz) for 2–4 runs (30 min per run). The moisture content of JSC4 biomass after harvesting was around 80%–85% (wt, after centrifugation). After extraction, the concentrations of starch and cellulose were determined by their hydrolysis to glucose via amylolytic and cellulolytic enzymes, respectively, as described previously.27Additionally, the cellular morphology of the harvested samples was observed by optical microscopy. For scanning electronic microscopy, the cells were fixed with 2.5% glutaraldehyde at 4 °C for at least 4 h, then rinsed three times with distilled water for 5 min and dehydrated via an ethanol gradient (25%, 50%, 75%, 95%, and 100%) for 5 min. The samples were dried using liquid CO2 in a critical point dryer and then coated with gold via sputter coating.
2.6 Yeast strains and plasmid construction
S. cerevisiae BY4741 was pre-cultivated in synthetic dextrose (SD) medium consisting of 6.7 g L−1 yeast nitrogen base with amino acids (Difco Laboratories, Detroit, MI, USA) and 20 g L−1 glucose, at 30 °C with continuous agitation at 150 rpm. The pre-cultured inoculum was seeded in yeast extract-peptone-dextrose (YPD) medium consisting of 10 g L−1 yeast extract, 20 g L−1 peptone and 20 g L−1 glucose, with seed-cultures maintained aerobically. The characteristics of the yeast strains used in this study are provided in ESI Table S1.†The plasmids displaying cellulase and amylase were constructed as described by Liu et al.28 and Inokuma et al.,14 respectively (Table S2†). To construct plasmid pRDH227, a 1468 bp fragment of the Chrysosporium lucknowense open reading frame (ORF) was removed from plasmid pMU78429 by PacI/AscI and cloned into the pBHD1 plasmid.30 Other plasmids were constructed using the thermal assembly method.31S. cerevisiae BY4741 was transformed with the recombinant plasmids via the lithium acetate method, as described by Chen et al.,32 which was then integrated into the yeast chromosome by homologous recombination. The primers used in this study are listed in ESI Tables S3 and S4.†
2.7 Ethanol fermentation
The engineered cellulase/amylase-displayed S. cerevisiae BY4741 strains were pre-cultivated in SD medium for 24 h and then inoculated into the YPD medium and cultivated at 30 °C for 72 h, under aerobic conditions. Engineered yeast cells were harvested by centrifugation at around 5200 rpm for 10 min at 4 °C and washed twice with sterile distilled water, and the wet cell pellets were weighed. To ensure the superiority of pigment-extracted microalgal residues as feedstock for ethanol production, 30 g L−1 starch from raw corn starch (Wako Pure Chemical Industries Ltd, Osaka, Japan), raw JSC4 cells, and JSC4 residue were selected for fermentation. Subsequently, ethanol fermentation was initiated by adding the recombinant yeast strains (50 g L−1 amylase producing yeast with 0, 25 or 50 g L−1 cellulase producing yeast) to 20 mL of fermentation media containing 300 g L−1 JSC4 residue (composed of 65%–67% starch of total dry weight) in 100 mL closed flasks, equipped with a bubbling CO2 outlet under oxygen-limited conditions. Fermentation was carried out for 96 h at 37 °C, with continuous agitation at 400 rpm. The reaction system schematics are illustrated in Fig. 1. The concentration of ethanol in the fermentation medium was determined by gas chromatography (model GC-2010, Shimadzu, Kyoto, Japan) as described previously.33,34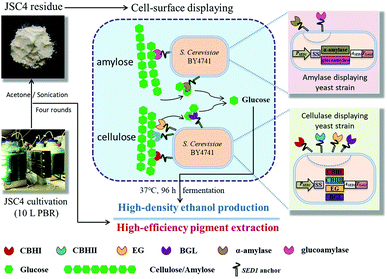 | ||
| Fig. 1 Schematic flow of the novel strategy for ethanol production from microalgal biomass using cell-surface display engineering. | ||
2.8 Statistical analysis
All data are presented as mean ± standard deviation of three replicates. Matlab 8.0 software was used for all statistical analysis.2.9 Life cycle assessment
LCA was conducted following a standardized four-step framework.35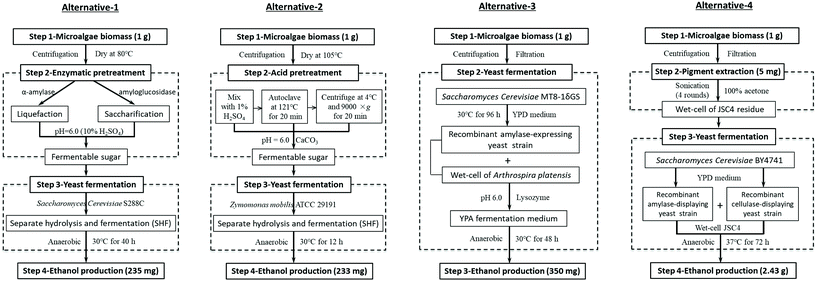 | ||
| Fig. 2 The diagrams of the four alternative processes used for LCA. Alternatives 1–3 represent the utilization of three conventional methods for ethanol production from microalgal biomass: enzymatic hydrolysis (alternative-1),36 acid hydrolysis (alternative-2),27 and CBP (alternative-3),37 respectively. Alternative-4 represents our current work. | ||
3. Results and discussion
3.1 Evaluation of cell growth, nitrogen consumption, and CO2 fixation by microalgae
Chlamydomonas sp. JSC4 was cultivated in a 10-L PBR under optimal conditions to maximize biomass, as reported in previous studies19,38 (Fig. S1a and b†). However, large-scale cultivation often inhibits cell growth due to the shading effect of the surrounding microalgal cells.39 Nitrogen consumption and CO2 fixation rate were also monitored in the JSC4 cells. As shown in Fig. S1c,† all parameters varied significantly in a time-dependent manner. The JSC4 strain achieved a maximum biomass concentration (3.5 g L−1) on day 5, which was significantly higher than those reported in most previous studies (Table S6†).Since nitrogen influences cell growth, propagation, division, and apoptosis, it is a limiting factor for microalgal propagation.40 Therefore, the decrease in JSC4 biomass concentrations after 5 days can be attributed to nitrogen deficiency (Fig. S1c†). Microalgae utilize CO2 for photosynthesis, causing the steady depletion of CO2 during cultivation. Therefore, the CO2 fixation rate was also determined as a function of culture time and was found to increase from day 1 to day 3 (Fig. S1c†). At day 3, a maximum CO2 fixation rate of 1300 mg d−1 L−1 was obtained in the presence of 2% CO2 with a flow rate of 0.05 vvm, which is significantly higher than those previously reported for many microalgae,41 indicating an improved potential for CO2 removal.
3.2 Evaluation of microalgal carbohydrate and lipid productivity
High lipid and carbohydrate yields are vital for microalgal biofuel production. Nitrogen deficiency can induce the accumulation of carbohydrates and lipids in microalgae.42 As shown in Fig. 3a, both the carbohydrate and lipid content of JSC4 significantly increased with time, to the maximum levels of 64.7% and 21.8%, respectively, after 7 days (including 4-days of nitrogen deficiency). However, the protein content decreased with time due to the nitrogen depletion (Table S7†).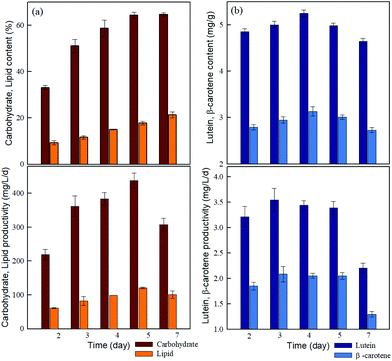 | ||
| Fig. 3 Time-course profiles of the (a) content and productivity of lipids and carbohydrates and (b) content and productivity of lutein and β-carotene during the growth of Chlamydomonas sp. JSC4. | ||
Furthermore, the highest carbohydrate and lipid productivity were 438 mg L−1 d−1 and 121 mg L−1 d−1 on day 5, respectively. Therefore, JSC4 cells accumulated more carbohydrates than lipids, due to the preferential carbon flow towards energy-rich compounds under environmental stress such as nitrogen deficiency, which leads to a competition between lipid and starch biosynthesis in microalgae.42 The carbohydrate content and productivity of strain JSC4 are higher than those reported in most of the relevant studies (Table S6†). Therefore, the high level of carbohydrate accumulation in strain JSC4 makes it a suitable candidate for further application in biofuel production.
3.3 Evaluation of pigment productivity of microalgae
The highest lutein (5.3 mg g−1) and β-carotene (3.1 mg g−1) concentrations were obtained at the start of nitrogen starvation (day 4), whereas maximum productivities were achieved after 3 days of cultivation at 3.5 mg L−1 d−1 and 2.1 mg L−1 d−1, respectively (Fig. 3b). Since carotenoid productivity is affected by both yield and biomass productivity, it is highly sensitive to nitrogen availability. After 5-day cultivation periods (the optimal duration for carbohydrate productivity), lutein and β-carotene productivities of strain JSC4 reached 3.5 mg L−1 d−1 and 2.1 mg L−1 d−1, respectively, which were higher than those reported in most comparative studies.43,44 Therefore, strain JSC4 appears to be a superior candidate for both carbohydrate (64.3%, 438 mg L−1 d−1 at day 5) and lutein production (5 mg g−1, 3.5 mg L−1 d−1), improving the commercial viability of using carotenoid-extracted residues from lutein/carbohydrate-rich microalgae strains for ethanol production.3.4 Direct pigment extraction from wet microalgal biomass
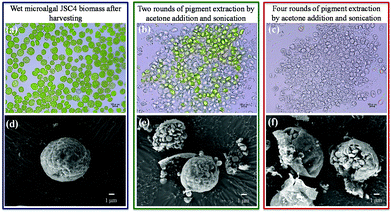
Studies show that chemical and mechanical disruption can significantly enhance pigment extraction efficiency.45,46 Furthermore, optimum levels of cell disruption have been found to be essential for enhanced microalgal ethanol production.27Therefore, extracting microalgal value-added pigments before ethanol fermentation can enhance the ethanol yield and reduce production costs to meet practical requirements. However, most extraction methods require dried biomass, which significantly hinders the commercial applicability. Therefore, to increase the economic feasibility of this proposed strategy, repeated extractions were performed from wet microalgal biomass using acetone, to increase enzyme access to microalgal sugars. As shown in Fig. 4a and d, intact microalgae were observed after harvesting prior to extraction. After two rounds of extraction, >70% of the pigments were released (which is sufficient for most applications) and most cells exhibited signs of disruption, with exposure of starch granules (Fig. 4b and e). Four rounds of extraction not only increased the pigment extraction efficiency to >95% (Fig. 4c), but also dispersed the microalgal cell debris (Fig. 4f). After extraction, the strain JSC4 residue consisted of about 75% carbohydrates, consisting of approximately 65%–67% starch and 8%–10% cellulose (sonication with acetone would remove most of the hydrophobic molecules existing in cells such as pigments and lipids), which is more suitable than microalgal biomass (consisting of approximately 58%–60% starch and 5%–6% cellulose) for ethanol production.
3.5 Optimization of ethanol production of microalgal JSC4 residue
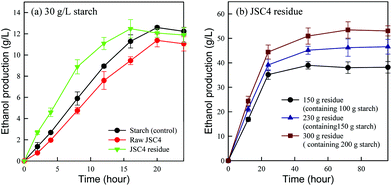
To evaluate the ethanol producing ability of JSC4 residue, ethanol production by fermentation using amylase-displayed S. cerevisiae BY4741 was compared in raw starch, raw JSC4 cells and JSC4 residue, with each containing 30 g L−1 starch (the dominant carbohydrate in JSC4 residue). As shown in Fig. 5a, the ethanol concentration increased with time with both JSC4 residue and raw JSC4 substrates producing the highest amounts of 12.5 g L−1 and 11.4 g L−1, after 16 h and 20 h of fermentation, respectively, accounting for 73% and 67% of the theoretical ethanol yield. The lower ethanol yield from raw JSC4 is likely due to insufficient hydrolysis of the entrapped starch, as shown in Fig. 4d. The ethanol yield from the JSC4 residue material reached the maximum level after 16 h of fermentation (12.5 g L−1), showing an improvement of 31.6% compared to raw JSC4. In addition, JSC4 residue exhibited a faster ethanol production rate compared with the other raw materials. The slight reduction in ethanol production by all three samples was probably due to insufficient starch during the later period of fermentation (16–24 h).To determine the optimal high-density ethanol production conditions, 150 g, 230 g and 300 g JSC4 residues containing around 100 g, 150 g and 200 g starch, respectively, were fermented by amylase-displayed S. cerevisiae BY4741. As shown in Fig. 5b, ethanol concentrations increased with increasing concentrations of JSC4 residue. Maximum ethanol concentrations of 39 g L−1, 47 g L−1 and 53 g L−1 were generated, respectively, from 150 g L−1, 230 g L−1 and 300 g L−1 JSC4 residues, which were approximately 69%, 67% and 47% of the theoretical ethanol yields, respectively. Therefore, the proportional concentration-dependent increase in ethanol was lower than what was expected, which may result from insufficient yeast cell availability and limited mass transfer efficiency in high density cultivation systems. In addition, a lack of cellulase-displaying yeast cells that can break down algal cellulose and contribute to lower ethanol yields may reduce the economic feasibility of using microalgal biomass.27 Therefore, with further optimization to enhance ethanol yields, JSC4 residue can be considered an economically alternative feedstock.
3.6 Integration of two cell-surface displayed yeast cells to optimize direct ethanol production
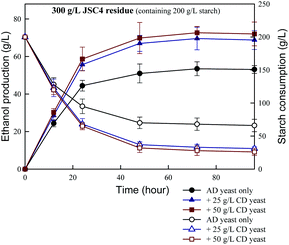
In the present study, the effects of combining amylase- and cellulase-displaying yeasts on ethanol production were assessed. As shown in Fig. 6, the combined engineered yeast system synergistically increased ethanol production and starch consumption. This finding is consistent with the results reported by Matano et al.47 who found that the ethanol yield of a recombinant S. cerevisiae strain co-displaying BGL, EG and CBHII was 89% of the theoretical yield. The maximum ethanol concentration of 73 g L−1 was achieved from 300 g L−1 JSC4 residue after 72 h of fermentation in the presence of 50 g L−1 amylase- and cellulase-displayed yeasts. This corresponded to the conversion of nearly 85% of starch and a 64% theoretical ethanol yield, which is significantly higher than those obtained in the absence of cellulase-displaying yeasts. However, the ethanol yield did not increase significantly with increasing concentrations of cellulase-displaying yeasts, which may be due to the extremely low proportion of cellulose in pigment-extracted JSC4 residue (<10% of total biomass). In addition, the viscosity of the fermentation broth increased dramatically with the addition of more yeast inoculum, which decreased the mass transfer efficiency between substrates and yeast cells and reduced ethanol conversion. Therefore, the main advantage of adding cellulase-displaying yeast cells for ethanol fermentation is to hydrolyze the starch-entrapped cellulose. With partial cellulose hydrolysis, more opportunities are provided for exposure of starch in the JSC4 residue for direct conversion, efficiently improving the process of starch conversion to ethanol. A previous study indicated that enhanced ethanol fermentation by cell-surface displayed enzymes was due to the greater surface area of the engineered cells, with increased availability to substrates, facilitating their adhesion.28Overall, the JSC4 residue is a superior substrate for ethanol production compared to many sugar-rich microalgae, as it co-produces value-added carotenoids and minimizes the need for high-cost pre-treatments. These findings provide new insights into the development of a cost-effective, direct high-density ethanol production process from carbohydrate-rich microalgal residues.
3.7 Quantification of environmental impacts by LCA
To evaluate the application potential of direct microalgal biomass fermentation to ethanol, LCA was applied to determine the level of environmental impact.According to the public data of the United States Department of Agriculture (USDA) in Mar–May 2019, the price of ethanol was $1.09 per gal.48 The price of lutein ranged from $910 to 15![[thin space (1/6-em)]](https://www.rsc.org/images/entities/char_2009.gif) 000 kg−1,49 and here we chose the mean price ($12
000 kg−1,49 and here we chose the mean price ($12![[thin space (1/6-em)]](https://www.rsc.org/images/entities/char_2009.gif) 000 kg−1) for further calculation. Therefore, the economic output of fermenting 1 kg microalgal biomass from these alternatives was $0.085 in alternative-1, $0.084 in alternative-2, $0.126 in alternative-3, and $60.875 in alternative-4 (present work). The significant increase in the economic output of alternative-4 was attributed to lutein extraction, suggesting that our modified CBP system was indeed more competitive for further industrial scale application.
000 kg−1) for further calculation. Therefore, the economic output of fermenting 1 kg microalgal biomass from these alternatives was $0.085 in alternative-1, $0.084 in alternative-2, $0.126 in alternative-3, and $60.875 in alternative-4 (present work). The significant increase in the economic output of alternative-4 was attributed to lutein extraction, suggesting that our modified CBP system was indeed more competitive for further industrial scale application.
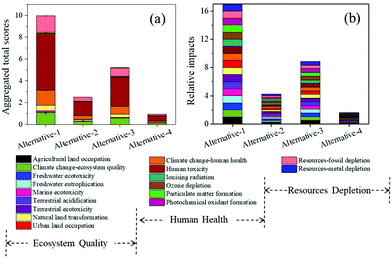 | ||
| Fig. 7 Total environmental impact scores (a) and relative impacts (b) of different methods for ethanol production. Alternatives 1–3 represent the utilization of three traditional methods for ethanol production from microalgal biomass: enzymatic hydrolysis (alternative-1),36 acid hydrolysis (alternative-2),27 and CBP (alternative-3),37 respectively. Alternative-4 represents our current work. | ||
![[thin space (1/6-em)]](https://www.rsc.org/images/entities/char_2009.gif) :
:![[thin space (1/6-em)]](https://www.rsc.org/images/entities/char_2009.gif) 30 to 1
30 to 1![[thin space (1/6-em)]](https://www.rsc.org/images/entities/char_2009.gif) :
:![[thin space (1/6-em)]](https://www.rsc.org/images/entities/char_2009.gif) 8
8![[thin space (1/6-em)]](https://www.rsc.org/images/entities/char_2009.gif) 53 or even 1
53 or even 1![[thin space (1/6-em)]](https://www.rsc.org/images/entities/char_2009.gif) :
:![[thin space (1/6-em)]](https://www.rsc.org/images/entities/char_2009.gif) 5,54 the negative effects of acetone on human health would be reduced accordingly.
5,54 the negative effects of acetone on human health would be reduced accordingly.
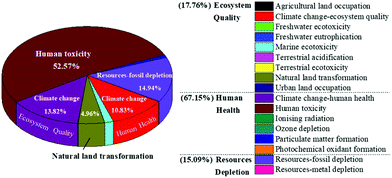
In spite of the environmental merits when comparing with other alternatives, there is still room for improving the environmental performances for the current process to produce ethanol. An investigation of the percentage impact of all environmental indicators for the present method would help identify the areas where improvement is needed. As depicted in Fig. 8, among the 17 assessed impact categories, the notable contributing categories included human toxicity (52.57%), fossil depletion (14.94%), climate change ecosystem effects (13.82%), climate change human health effects (10.83%), and natural land transformation (4.96%). The negative contribution of this fermentation process to human health accounted for 67.15%, which was probably due to the addition of acetone for pigment extraction. On account of this, optimizing the acetone usage or selecting more sustainable substitution to further reduce the environmental implications should be further considered.
4. Conclusions
This study demonstrates the feasibility of direct high-density ethanol production from pigment-extracted microalgal residues using amylase- and cellulase-displaying yeast cells, without the use of pre-treatments. The highest ethanol concentration obtained using this novel approach was 73 g L−1. Notably, LCA revealed that this method could significantly attenuate the effects of 17 environmental impact categories, especially in terms of human toxicity. To the best of our knowledge, this is the first study to accomplish cost-effective and direct high-density ethanol production from microalgae, which seems to be feasible for commercial-scale microalgal ethanol production and value-added product extraction (e.g., lutein).Conflicts of interest
There are no conflicts to declare.Acknowledgements
This work was supported by the State Key Laboratory of Urban Water Resource and Environment (Harbin Institute of Technology, No. 2019DX09). This work was also supported by the Project of Thousand Youth Talents (No. AUGA2160100917).References
- S. Zhu, F. Luo, W. Huang, W. Huang and Y. Wu, Appl. Energy, 2017, 197, 124–131 CrossRef CAS.
- P. Majidian, M. Tabatabaei, M. Zeinolabedini, M. P. Naghshbandi and Y. Chisti, Renewable Sustainable Energy Rev., 2018, 82, 3863–3885 CrossRef CAS.
- Y. Xu and D. Wang, Appl. Energy, 2017, 195, 196–203 CrossRef CAS.
- D. Chiaramonti, M. Prussi, M. Buffi, A. M. Rizzo and L. Pari, Appl. Energy, 2017, 185, 963–972 CrossRef CAS.
- M. C. Ravanal, R. Pezoa-Conte, S. von Schoultz, J. Hemming, O. Salazar, I. Anugwom, O. Jogunola, P. Mäki-Arvela, S. Willför, J.-P. Mikkola and M. E. Lienqueo, Algal Res., 2016, 13, 141–147 CrossRef.
- Y. A. Castro, J. T. Ellis, C. D. Miller and R. C. Sims, Appl. Energy, 2015, 140, 14–19 CrossRef CAS.
- Y. Li, D. Han, G. Hu, M. Sommerfeld and Q. Hu, Biotechnol. Bioeng., 2010, 107, 258–268 CrossRef CAS.
- R. Halim, R. Harun, M. K. Danquah and P. A. Webley, Appl. Energy, 2012, 91, 116–121 CrossRef CAS.
- B. Hahn-Hagerdal, K. Karhumaa, C. Fonseca, I. Spencer-Martins and M. F. Gorwa-Grauslund, Appl. Microbiol. Biotechnol., 2007, 74, 937–953 CrossRef PubMed.
- R. Harun and M. K. Danquah, Process Biochem., 2011, 46(1), 304–309 CrossRef CAS.
- I. S. Choi, Y. G. Lee, S. K. Khanal, B. J. Park and H. J. Bae, Appl. Energy, 2015, 140, 65–74 CrossRef CAS.
- J. Piškur, E. Rozpędowska, S. Polakova, A. Merico and C. Compagno, Trends Genet., 2006, 22, 183–186 CrossRef.
- D. G. Olson, J. E. McBride, J. A. Shaw and L. R. Lynd, Curr. Opin. Biotechnol., 2012, 23, 396–405 CrossRef CAS.
- K. Inokuma, T. Hasunuma and A. Kondo, Biotechnol. Biofuels, 2014, 7, 8 CrossRef.
- Z. Liu, S.-H. Ho, T. Hasunuma, J.-S. Chang, N.-Q. Ren and A. Kondo, Bioresour. Technol., 2016, 215, 324–333 CrossRef CAS.
- T. Hasunuma and A. Kondo, Biotechnol. Adv., 2012, 30, 1207–1218 CrossRef CAS.
- H. Shigechi, Y. Fujita, J. Koh, M. Ueda, H. Fukuda and A. Kondo, Biochem. Eng. J., 2004, 18, 149–153 CrossRef CAS.
- H. Zabed, J. N. Sahu, A. Suely, A. N. Boyce and G. Faruq, Renewable Sustainable Energy Rev., 2017, 71, 475–501 CrossRef CAS.
- S.-H. Ho, A. Nakanishi, X. Ye, J.-S. Chang, C.-Y. Chen, T. Hasunuma and A. Kondo, Biotechnol. Biofuels, 2015, 8, 48 CrossRef.
- A. Nakanishi, S. Aikawa, S.-H. Ho, C.-Y. Chen, J.-S. Chang, T. Hasunuma and A. Kondo, Bioresour. Technol., 2014, 152, 247–252 CrossRef CAS.
- L. Lardon, A. Hélias, B. Sialve, J. P. Steyer and O. Bernard, Environ. Sci. Technol., 2009, 43(17), 6475–6481 CrossRef CAS PubMed.
- P. Azadi, G. Brownbridge, S. Mosbach, O. Inderwildi and M. Kraft, Green Chem., 2015, 17(3), 1793–1801 RSC.
- Y. Chisti, Biodiesel from microalgae, Biotechnol. Adv., 2007, 25, 294–306 CrossRef CAS PubMed.
- S.-H. Ho, C.-Y. Chen and J.-S. Chang, Bioresour. Technol., 2012, 113, 244–252 CrossRef CAS PubMed.
- M. C. Chan, S.-H. Ho, D.-J. Lee, C.-Y. Chen, C.-C. Huang and J.-S. Chang, Biochem. Eng. J., 2013, 78, 24–31 CrossRef CAS.
- K. L. Taylor, A. E. Brackenridge, M. A. Vivier and A. Oberholster, J. Chromatogr. A, 2006, 1121, 83–91 CrossRef CAS.
- S.-H. Ho, S.-W. Huang, C.-Y. Chen, T. Hasunuma, A. Kondo and J.-S. Chang, Bioresour. Technol., 2013, 135, 191–198 CrossRef CAS PubMed.
- Z. Liu, S.-H. Ho, K. Sasaki, R. den Haan, K. Inokuma, C. Ogino, W. H. van Zyl, T. Hasunuma and A. Kondo, Sci. Rep., 2016, 6, 24550 CrossRef CAS PubMed.
- M. Ilmén, R. den Haan, E. Brevnova, J. McBride, E. Wiswall, A. Froehlich, A. Koivula, S. P. Voutilainen, M. Siika-aho, D. C. la Grange, N. Thorngren, S. Ahlgren, M. Mellon, K. Deleault, V. Rajgarhia, W. H. van Zyl and M. Penttilä, Biotechnol. Biofuels, 2011, 4, 30 CrossRef.
- H. Kroukamp, R. den Haan, N. van Wyk and W. H. van Zyl, Overexpression of native PSE1 and SOD1 in Saccharomyces cerevisiae improved heterologous cellulase secretion, Appl. Energy, 2013, 102, 150–156 CrossRef CAS.
- D. G. Gibson, L. Young, R.-Y. Chuang, J. C. Venter, C. A. Hutchison and H. O. Simth, Nat. Methods, 2009, 6, 343–345 CrossRef CAS.
- D. C. Chen, B. C. Yang and T. T. Kuo, Curr. Genet., 1992, 21, 83–84 CrossRef CAS.
- Z. Liu, K. Inokuma, S.-H. Ho, R. den Haan, T. Hasunuma, W. H. van Zyl and A. Kondo, Biotechnol. Biofuels, 2015, 8, 162 CrossRef.
- R. Yamada, Y. Nakatani, C. Ogino and A. Kondo, AMB Express, 2013, 3, 34 CrossRef PubMed.
- M. Finkbeiner, A. Inaba, R. Tan, K. Christiansen and H. J. Klüppel, Int. J. Life Cycle Assess., 2006, 11, 80–85 CrossRef.
- S. P. Choi, M. T. Nguyen and S. J. Sim, Bioresour. Technol., 2010, 101, 5330–5336 CrossRef CAS PubMed.
- S. Aikawa, A. Joseph, R. Yamada, Y. Izumi, T. Yamagishi, F. Matsuda, H. Kawai, J.-S. Chang, T. Hasunuma and A. Kondo, Energy Environ. Sci., 2013, 6, 1844–1849 RSC.
- S.-H. Ho, A. Nakanishi, Y. Kato, H. Yamasaki, J.-S. Chang, N. Misawa, Y. Hirose, J. Minagawa, T. Hasunuma and A. Kondo, Sci. Rep., 2017, 7, 45471 CrossRef CAS.
- P. Feng, Z. Deng, Z. Hu and L. Fan, Bioresour. Technol., 2011, 102, 10577–10584 CrossRef CAS.
- S. Wu, Y. Meng, X. Cao and S. Xue, Algal Res., 2016, 17, 321–329 CrossRef.
- D. Tang, W. Han, P. Li, X. Miao and J. Zhong, Bioresour. Technol., 2011, 102, 3071–3076 CrossRef CAS PubMed.
- H. Rismani-Yazdi, B. Z. Haznedaroglu, K. Bibby and J. Peccia, BMC Genomics, 2011, 12, 148 CrossRef CAS PubMed.
- Y. Xie, S.-H. Ho, C.-N. N. Chen, C.-Y. Chen, I.-S. Ng, K.-J. Jing, J.-S. Chang and Y. Lu, Bioresour. Technol., 2013, 144, 435–444 CrossRef CAS PubMed.
- B. F. Cordero, I. Obraztsova, I. Couso, R. Leon, M. A. Vargas and H. Rodriguez, Mar. Drugs, 2011, 9, 1607–1624 CrossRef CAS PubMed.
- J. A. Gerde, M. Montalbo-Lomboy, L. Yao, D. Grewell and T. Wang, Bioresour. Technol., 2012, 125, 175–181 CrossRef CAS PubMed.
- D. Singh, M. Puri, S. Wilkens, A. S. Mathur, D. K. Tuli and C. J. Barrow, Bioresour. Technol., 2013, 143, 308–314 CrossRef CAS.
- Y. Matano, T. Hasunuma and A. Kondo, Bioresour. Technol., 2012, 108, 128–133 CrossRef CAS.
- USDA-United States Department of Agriculture. Table 15. http://www.ers.usda.gov/webdocs/DataFiles/53657/table15.xls?v=4414.1.
- I.-C. Hu, Production of potential coproducts from microalgae, Biofuels from Algae, Elsevier, 2019, pp. 345–358 Search PubMed.
- K. J. Maier and A. W. Knight, Environ. Contam. Toxicol., 1994, 134, 31–48 CAS.
- U.S. Environmental, Protection Agency, EPA-440-5-87-006, Office of Water, Washington, DC, 1987.
- M. Tuzen, B. Verep, A. O. Ogretmen and M. Soylak, Environ. Monit. Assess., 2009, 151, 363–368 CrossRef CAS.
- C. T. Matos, M. Santos, B. P. Nobre and L. Gouveia, Bioresour. Technol., 2013, 134, 219–226 CrossRef CAS.
- S. M. Kim, Y. J. Jung, O.-N. Kwon, K. H. Cha, B.-H. Um, D. Chung and C.-H. Pan, Appl. Biochem. Biotechnol., 2012, 166, 1843–1855 CrossRef CAS.
Footnote |
| † Electronic supplementary information (ESI) available. See DOI: 10.1039/c9gc02634g |
| This journal is © The Royal Society of Chemistry 2020 |

