 Open Access Article
Enhanced electrochemical performance of modified thin carbon electrodes for all-vanadium redox flow batteries†
Ahmed
Sodiq
 *ab,
Fathima
Fasmin‡
b,
Lagnamayee
Mohapatra‡
b,
Sabah
Mariyam
a,
Muthumeenal
Arunachalam
b,
Hicham
Hamoudi
b,
Rachid
Zaffou
b and
Belabbes
Merzougui
*ab
aCollege of Science and Engineering, Hamad Bin Khalifa University, Doha, Qatar. E-mail: ahmsodiq@mail.hbku.edu.qa; bmerzougui@hbku.edu.qa
bQatar Environment and Energy Research Institute, Hamad Bin Khalifa University, Doha, Qatar
First published on 28th August 2020
Abstract
We report the unique electrochemical properties of nitrogen-containing carbon nanostructures (N-CP) grown on commercial carbon paper (CP), used as electrocatalysts in all-vanadium redox flow batteries (VRFBs). The focus is on the anode, where mitigation of the hydrogen evolution reaction and loss in redox kinetics due to cycling is considered as a challenge. The growth of bamboo-like carbon nanostructures is achieved through a catalytic chemical vapor deposition (CVD) process with a very small geometric loading of Fe (from FeCl3) as the catalyst. Anhydrous acetonitrile, used as a nitrogen/carbon precursor, is fed to the electrode sample at 900 °C for 3 hours in a stream of H2–Ar (carrier gas). The three-electrode-cell study shows enhanced kinetics and durability of the electrode for V3+/V2+ redox reactions; N-CP shows a significant suppression of the peak potential separation (ΔE ∼ 80 mV), indicating faster kinetics compared to conventional CP (ΔE ∼ 160 mV). In addition, the subscale cell performance shows good durability (about 5% and 15% loss in energy efficiency in N-CP and CP, respectively) after 50 charge–discharge cycles. The improved durability of the N-CP electrode is attributed to the presence of nitrogen–carbon nanostructures, increased active area, and improved sp2 carbon content. Such findings can contribute to the development of large scale high performance VRFB systems.
Introduction
The current renewed interest in redox flow batteries (RFBs) as the best choice for large-scale electrical energy storage (EES) systems is mainly due to the inherent advantages of this technology over traditional sealed batteries (such as Li-ion and lead acid).1 The scalability of a flow battery's energy capacity, which is independent of its power output, is the major advantage of RFB technology; that is, to increase the energy capacity, the active species stored in two tanks outside the battery's stack can simply be increased by increasing the stored solutions, while the power stack is kept the same. Despite this key benefit, flow batteries still suffer from two factors, a large footprint (mainly due to their size), and high system capital cost (due to low energy density), which limit their wide penetration in the market. Thus, to achieve wide commercialization of flow batteries for EES applications, the outlined challenges must be addressed.Presently, the all-vanadium redox flow battery (VRFB) is the most mature of all redox flow battery chemistries.2 However, despite the VRFB attractiveness, mostly due to a single redox chemical instead of two, which eliminates the problem of cross-contamination of active species across the membrane, the low energy density (between 25 and 40 W h L−1)3 of the reactant solutions is one of the major obstacles that still inhibits the technology from wide commercialization.4 From the time Skyllas-Kazacos group5 demonstrated the VRFB concept in the 1980s, the flow battery sub-community has carried out research activities to improve the performance of both the electrode and electrolyte. Most research efforts have been focused on improving the energy density, power density, and capacity retention. In a typical VRFB, the starting solution contains a single V salt, such as VOSO4 dissolved in H2SO4. During operation, redox couples V3+/V2+ and V5+/V4+ are generated on the anode and cathode sides, better known as the anolyte and catholyte, respectively. The potential window of a conventional VRFB is limited and does not exceed 1.4 V in an aqueous-based chemistry. As a result, carbon oxidation and/or oxygen evolution reactions are expected to occur on the cathode side. Similarly, the hydrogen evolution reaction (HER) may also occur on the anode side, especially at a low concentration of V redox species.6 These competitive reactions must be well controlled by controlling the cell voltage or by tailoring the electrode surface properties. Many research studies have been reported, emphasizing the importance of selecting suitable electrode materials for the cathode as well as the anode reactions.7–9 This electrode selection is to find a solution to either the parasitic hydrogen evolution reaction or material oxidation. Yet, capacity degradation is still being observed in VRFBs, partly due to the parasitic hydrogen evolution reaction on the negative electrode, which occupies some effective surface area, leading to low voltage and coulombic efficiencies and hence low energy efficiency.10
Conventional VRFBs use carbon materials as electrodes due to their chemical and electrochemical stability.11 The carbon materials commonly employed are: carbon felt, carbon fiber and carbon cloth. In most cases, these electrode materials show slow kinetics and poor reversibility.12 Any electrode material for VRFBs that would address parasitic reactions, e.g. the hydrogen evolution reaction, must be kinetically favorable to V redox reactions, and have sufficient oxygen functional groups,13,14 and good reversibility, among other thermodynamic requirements. Different research studies have been proposed on carbon materials as catalysts in VRFBs, such as graphene nanoplatelets,15 reduced graphene oxide,16 activated carbons,17 carbon nanotubes18 and a hybrid of graphene oxide and carbon nanotubes.19 The general understanding in the VRFB research community is that carbon electrodes must have sufficient oxygen functional groups (C![[double bond, length as m-dash]](https://www.rsc.org/images/entities/char_e001.gif) O and –OH) on the surface to be suitable for V5+/V4+ and V3+/V2+ redox reactions.20–22 In this regard, some studies have focused on modification of carbon-based materials to increase the quantity of surface oxygen functional groups. For instance, the carbonyl (C
O and –OH) on the surface to be suitable for V5+/V4+ and V3+/V2+ redox reactions.20–22 In this regard, some studies have focused on modification of carbon-based materials to increase the quantity of surface oxygen functional groups. For instance, the carbonyl (C![[double bond, length as m-dash]](https://www.rsc.org/images/entities/char_e001.gif) O) functional group on carbon electrodes’ surface improves the active sites for catalytic reactions of vanadium,23 whereas the hydroxyl (–OH) functional group increases the hydrophilic nature of the electrode and hence allows the redox solution (electrolyte and active species) to penetrate smoothly into the electrode's matrix.24
O) functional group on carbon electrodes’ surface improves the active sites for catalytic reactions of vanadium,23 whereas the hydroxyl (–OH) functional group increases the hydrophilic nature of the electrode and hence allows the redox solution (electrolyte and active species) to penetrate smoothly into the electrode's matrix.24
Nitrogen atom doping (which converts the carbon hexagonal ring structure to a differently shaped ring, such as pentagonal) on carbon surfaces is one of the carbon treatment methods. It has been reported for many applications: in lithium-ion batteries,25 methanol electro-oxidation,26 and biosensors,27 to create active sites for electrochemical reactions. CNTs and nitrogen-doped CNTs have been reported as excellent electrocatalysts for redox reactions in VRFBs.28 For example, catalyst-assisted CNTs grown on carbon felt as electrodes for VRFB applications were reported by Chang et al.,29 and the obtained high performance was attributed to the nitrogen dopants on the CNT surface. Similarly, He et al.30 attributed the improvement of graphite felt electrodes treated in an NH3 atmosphere to nitrogen doping.
Although carbon felt is the most used carbon electrode for VRFBs, the inherent problems reside in slow reaction kinetics in vanadium electrolytes and its bulkiness, with a thickness in the range of 3–5 mm, which increases the flow battery's stack size. Notwithstanding the progress made in manufacturing thin carbon felt, the slow kinetics in vanadium systems still poses challenges.
In this work, we report the possible replacement of carbon felt with thin (200 μm) carbon paper as VRFB electrodes with good kinetics and cycling stability, especially for the anode reaction involving the redox couple V2+/V3+. We also report the use of an environmentally friendly and cost effective catalyst (FeCl3) to modify commercial carbon paper with bamboo-like CNTs rich in nitrogen.
Experimental
Growth of CNTs on carbon paper
The growth of bamboo-like carbon nanotubes on carbon paper was achieved through a catalytic chemical vapor deposition (CVD) method. The as-received CP was dried at 60 °C inside a vacuum oven, and its weight and dimensions were noted. A 50 mM concentration of FeCl3 in anhydrous acetonitrile (CH3–C![[triple bond, length as m-dash]](https://www.rsc.org/images/entities/char_e002.gif) N) was prepared (Fe being the catalyst used to grow CNTs). The resulting solution was N2-sprayed onto the CP until the required Fe weight per cm2 of the carbon paper (e.g. 20, 40 and 80 μg cm−2) was achieved. The sprayed CP was returned to the vacuum oven, dried at 60 °C for two hours to remove any residual solvent and was reweighed to ascertain the required weight per cm2. The prepared CP was then placed in a tubular reactor (CVD type) for pyrolysis. Vapor of anhydrous acetonitrile (nitrogen and carbon source) was carried through the reactor tube with an Ar–H2 (97–3%) gas stream, and the temperature was ramped as described below:
N) was prepared (Fe being the catalyst used to grow CNTs). The resulting solution was N2-sprayed onto the CP until the required Fe weight per cm2 of the carbon paper (e.g. 20, 40 and 80 μg cm−2) was achieved. The sprayed CP was returned to the vacuum oven, dried at 60 °C for two hours to remove any residual solvent and was reweighed to ascertain the required weight per cm2. The prepared CP was then placed in a tubular reactor (CVD type) for pyrolysis. Vapor of anhydrous acetonitrile (nitrogen and carbon source) was carried through the reactor tube with an Ar–H2 (97–3%) gas stream, and the temperature was ramped as described below:
• From room temperature (25 °C) to 100 °C for 15 minutes.
• The temperature stayed at 100 °C for 20 minutes, and was ramped up to 500 °C for 40 minutes.
• The temperature stayed at 500 °C for 15 minutes and was then ramped up to 900 °C for 40 minutes.
• The temperature stayed at 900 °C for 180 minutes, and thereafter was allowed to cool down slowly to room temperature (25 °C) by the default setting of the tubular reactor.
The treated carbon paper (N-CP) was then taken from the reactor and washed in 2 M H2SO4 for 2 hours at 60 °C to remove any residual Fe catalyst.
Methods of characterization
The cyclic voltammetry of the carbon paper was carried out with a WaveDriver 20 Bipotential/Galvanostat (Pine Research Instrument, USA). A 10 mV s−1 scan rate was used for both single scans and for the durability test, which involved hundreds of cycles. For cell performance measurements, an SP-300 Potentiostat/Galvanostat (BioLogic Science Instruments, France) was used. The cell was run at a constant current density, chronopotentiometry, using EC-Lab (in-built software) at 40 mA cm−2.
Scanning electron microscopy (SEM)
The surface morphologies of CP and N-CP were studied using a field emission scanning electron microscope (FE-SEM, Nova Nano SEM 650) equipped with an energy dispersive X-ray spectroscopy (EDS) accessory through secondary electron images at 3 kV and different magnifications.X-ray photoelectron spectroscopy (XPS)
The chemical composition (N, C and O) of CP and N-CP was identified by X-ray photoelectron spectroscopy (XPS) (AXIX Ultra DLD, Kratos, UK) using a monochromatic X-ray source – an Al Kα source; the calibration of the binding energy was done by taking C 1s (284.3 eV) as a reference.Raman spectroscopy
The Raman spectra of the samples were measured using a DXR-Raman microscope (Thermo Fisher Scientific, USA) at 532 nm laser wavelengths, a magnification of 10× and a laser power of 10 mW.Contact angle measurements
The hydrophilic (wettability) property of CP and N-CP was measured using a contact angle goniometer (Sindatek Model 100SB). The results are added as ESI.†Subscale cell configuration
The subscale single cell battery (see Fig. 1) was built from commercial fuel cell hardware (purchased from Fuel Cell Store, TX, USA). The serpentine flow channels were fabricated in-house from graphite plates, with a 3 cm by 3 cm active area with a 1.6 mm and 1.33 mm channel depth and width, respectively. A Nafion 212 membrane (50 μm thick), sandwiched between two carbon papers (3 cm by 3 cm with a 200 μm thickness, purchased from Mitsubishi Chemical Corporation, Japan), was used to form a low ionic resistance membrane electrode assembly (MEA). On either side of the separator, a cutout, 1 mm wider than the carbon paper, was made from a non-compressible Teflon gasket (180 μm thick) to completely separate the two graphite plates (to prevent shunting). 20 μm compression was achieved on each electrode by the applied torque of 16 N m.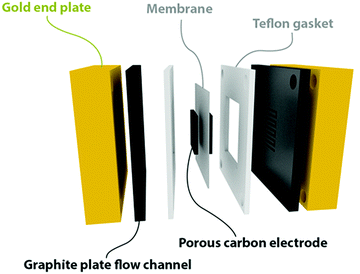 | ||
| Fig. 1 Schematic representation of the in-house made flow cell with a serpentine flow channel (1.6 mm depth by 1.33 mm width). | ||
All the redox and water-based chemicals used in this work were prepared with deionized water (18.20 MΩ cm−1). VOSO4 in reagent grade and H2SO4 with assay 99.999% were purchased from Sigma Aldrich.
For cyclic voltammetry, the concentration of the vanadium-based redox species was maintained at 0.1 M VOSO4 in 2 M H2SO4. For cell performance measurements, 1.5 M VOSO4 in 2 M H2SO4 was used in both the anolyte and catholyte. It is important to mention, however, that since the starting material was VOSO4 salt with vanadium ions having a charge state of 4+, an initial battery charge cycle was performed to balance the charge of vanadium species to generate V2+ and VO2+ on the anode and cathode sides, respectively. The subsequent charge–discharge cycles ensured the formation of couples V2+ to V3+ on the anode and VO2+ to VO2+ on the cathode and vice versa.
Results and discussion
Effect of catalyst loading on N-CNT growth
In order to determine the optimum Fe catalyst loading for CP modification, different catalyst loadings were tested and the growth of the CNT bamboo-like structure at 900 °C is shown in the scanning electron microscopy (SEM) images in Fig. 2. As shown, the CNT growth increased with increasing Fe catalyst loading; high coverage was obtained at 80 μg cm−2 of Fe (Fig. 2a). However, at 90 μg cm−2 Fe loading (Fig. 2b), there was CNT growth but not as prominent as that in Fig. 2a. At 40 μg cm−2 Fe loading (Fig. 2c), the CNT growth was scanty.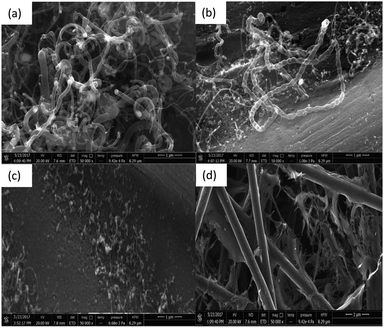 | ||
| Fig. 2 Catalyst variation (Fe loading in μg cm−2 of carbon paper at 900 °C): (a) 80 μg cm−2, (b) 90 μg cm−2, (c) 40 μg cm−2 and (d) 20 μg cm−2. | ||
At 20 μg cm−2 Fe loading (Fig. 2d), no growth was found on the carbon paper. This is an indication that the optimum Fe loading that ensured maximum bamboo-like CNT growth on the carbon paper is 80 μg cm−2.
Effect of temperature on N-CNT growth
Another important factor that directly affects the growth of CNTs on carbon paper is the temperature. In this regard, different experiments were performed at different temperatures. As seen in Fig. 3, the CNT growth for the sample obtained at 900 °C (Fig. 3b) is more pronounced as compared to other temperatures, while keeping the Fe catalyst loading constant at 80 μg cm−2. The samples treated at 950 °C and 850 °C (Fig. 3a and c, respectively) showed visible CNT growth, but not as great as that obtained at 900 °C. Surprisingly, there was no growth observed for the sample obtained at 800 °C (Fig. 3d). These results lead to the conclusion that under these specific conditions, 900 °C seems to be the optimum temperature for CP modification with better coverage of CNTs. One may argue that our results do not agree with some reported work.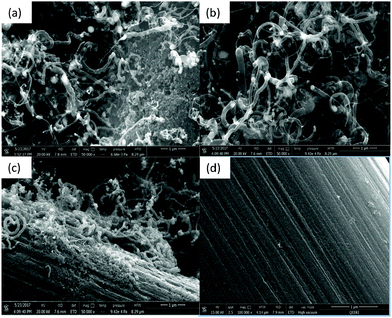 | ||
| Fig. 3 Temperature variation (same Fe loading, 80 μg cm−2): (a) 950 °C, (b) 900 °C, (c) 850 °C and (d) 800 °C. | ||
For example, Chang et al.29 reported CNT growth at 700 °C under different conditions, such as a cobalt catalyst from cobalt(III) nitrate, carbon felt as the substrate, and different carbon and nitrogen precursors (C2H2/NH3). In other work reported by Wang et al.,28 nitrogenized CNT growth was also accomplished at 800 °C on carbon felt using ferrocene as the source of the Fe catalyst, and ethylenediamine as the source of both carbon and nitrogen. Effectively, the temperature has a significant effect on the coverage of N-containing CNTs on carbon paper; the reason may be associated with the stability of nitrogen functionalities. It has been reported that the nitrogen content in N-CNTs has a volcano behavior; it increases with increasing temperature to reach a summit at 900 °C. After that, the nitrogen content decreases with increasing temperature, indicating that some decomposition may destroy the growth of the N-CNT bamboo structure.31
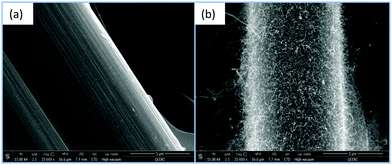
Fig. 4 shows the difference between the morphologies of CP (Fig. 4a) and N-CP (Fig. 4b) at 5 μm magnification under SEM. Unlike Fig. 4a in which the morphology of the carbon paper is bare at the stated magnification, Fig. 4b clearly shows bamboo-like CNT structures grown on carbon fibers of the carbon paper modified with FeCl3 as the source of the Fe catalyst. The sample was subjected to an acetonitrile atmosphere ensured by a flow of a H2–Ar mixture (3% H2) for 3 hours at 900 °C.
Cyclic voltammetry
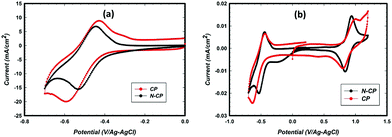
Cyclic voltammetry (CV) studies of the CP and N-CP samples were carried out in electrolyte containing VOSO4 and sulfuric acid. The potential window 0 to −0.7 V/Ag–AgCl was chosen specifically so that the electrode response corresponds to the redox couple V2+ ⇔ V3+ since the present study focuses more on anode reactions where undesired reactions, such as hydrogen evolution, are a challenge. As shown in Fig. 5a, the as-received carbon paper (CP) shows activity toward redox reactions of V2+/V3+ with a relatively good reversibility (the ratio: reverse peak current to forward peak current was about 0.74). The forward and the reverse peak potentials were estimated to be −0.62 V and −0.43 V, respectively, resulting in a peak separation (ΔE) of 0.19 V. Meanwhile the N-CP electrode showed a significant improvement in reversibility (the peak intensity ratio, i.e. reverse peak current to forward peak current, was 0.86) as well as in the kinetics of the redox reaction as indicated by ΔE (black CV in Fig. 5a). The forward and the reverse peaks for N-CP were found to be at −0.53 V and −0.45 V, respectively, resulting in a ΔE of 0.08 V, which is about half of what was observed for the unmodified sample. Such a decrease in peak potential separation is a clear indication of fast kinetics of V2+/V3+ redox reactions on the N-CP electrode. The mechanism is difficult to explain since the common understanding in the literature is associated with the presence of oxygen functionalities; the greater the oxygen groups on the carbon surface, the faster the kinetics will be, particularly for V2+/V3+ redox.21,22 However, we know from XPS data that oxygen groups were reduced significantly for the treated samples, N-CP. Therefore, the attribution of fast kinetics for V2+/V3+ to oxygen groups is not entirely true. In fact, the same improvement in kinetics was also observed for cathodic redox, V4+/V5+ (Fig. 5b), in which ΔE is 0.1 V for N-CP as against 0.21 V for CP.Typically, the peak potential separation (ΔE) determines how fast the kinetics of reversible electrochemical reactions is, which is related to the rate of charge transfer to the surface of electrodes. A smaller ΔE indicates a low barrier to electron transfer, which enables fast Nernst equilibrium to be established upon changes in the applied potential. Whereas, a large ΔE indicates a high barrier to electron transfer, which often leads to sluggish electrochemical reactions. In the case of N-CP, the rate of electron transfer between the dissolved V3+/V2+ redox species and electrode surface (N-CP) seems to be more efficient, which results in a smaller ΔE value (80 mV) as compared to the conventional CP electrode with a ΔE value of 190 mV. The main reason for this improvement is more likely related to nitrogen doping, which changes the electronic, geometric, and chemical environments of the host carbon surface, thereby improving electron transfer between the carbon surface and vanadium ions as reported elsewhere.32 In fact, this results in improved adsorption of vanadium redox species onto the carbon surface, leading to enhanced electrochemical activity of redox reactions.
We also observed that the corrosion resistance of N-CP at 1.4 V/RHE and 60 °C in 2 M sulfuric acid was greatly improved (see Fig. 6d). Thus, introduction of nitrogen to the surface in the form of bamboo-like carbon nanotubes is expected to change the electronic and chemical environment in the carbon matrix, rendering active sites for V redox species more suitable and more corrosion resistant.
Durability test—potential cycles for V2+/V3+ redox
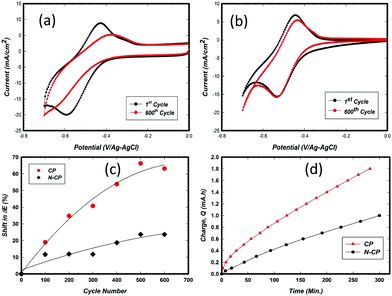
The common challenge that is widely reported is associated with electrode stability, which is always interpreted as voltage and coulombic efficiencies. Overcharging of a V-battery cell can cause degradation on the cathode side due to corrosion, and the removal of some functional groups (oxygen groups) on the anode side. Since the redox reaction of V2+/V3+ occurs near to the hydrogen evolution reaction (HER), it is very difficult to eliminate this latter reaction entirely. Many studies have been reported in this regard, involving carbon electrode modification with heteroatoms, such as N,33 and deposition of metals that impede the HER, such as Bi,34 Sn,35 Cu,36 Zr,37 and others.38 In the general view, one can ensure that till now there has been no breakthrough in tackling the issue of the HER. Furthermore, to the best of our knowledge, there is no deep study on the electrode behavior with cycling in the potential window corresponding to V2+/V3+ specifically.In this regard, the CP and N-CP electrode samples were subjected to potential cycles of up to 600 cycles in order to compare their durability, in other words, which electrode can maintain better V2+/V3+ redox activity before the HER starts to dominate. The CV scans were carried out in the potential window of 0 V to −0.70 V (against Ag–AgCl electrode) at a scan rate of 10 mV s−1. The obtained results are illustrated in Fig. 6a and b. As shown, for the CP based electrode (Fig. 6a), the forward and the reverse peaks shifted significantly after 600 cycles, to values of −0.63 V and −0.38 V, respectively, with a ΔE of 0.25 V. This gives approximately a 32% loss in activity from the first to the 600th potential cycle. The shift in ΔE from the beginning of life to the 600th cycle is estimated to be 60 mV, translating into a rate of 100 μV cycle−1 (Fig. 6c), while for N-CP at the 600th cycle, the forward and reverse peak scans were located at −0.53 V and −0.43, respectively, with a ΔE of 0.10 V. The activity loss from the first to the 600th potential cycle is approximately 25%, with a degradation rate of 30 μV cycle−1 (Fig. 6c). Such a degradation rate, which explains the loss in the kinetics of vanadium redox on the electrodes, has been a subject of debate among many researchers.21,39 As mentioned earlier, a large number of investigations13,40,41 relate the loss in the kinetics of vanadium redox reactions to the loss of oxygen functionalities on the carbon surface as a result of cycling in the said potential window. However, from our observation and the results presented, we believe strongly that the activity retention and durability of N-CP are more related to a change in the electronic and chemical environment triggered by the nitrogen dopants on the treated carbon paper as shown in the XPS results presented in this work. The corrosion performance of N-CP and CP, which is related to the rate of electrode oxidation under harsh acidic conditions (2 M H2SO4 at 60 °C at 1.4 V/RHE), is illustrated in Fig. 6d. N-CP displayed a lower corrosion rate (0.003 mA h s−1) than CP (0.006 mA h s−1).
Furthermore, the effect of potential cycling on the peak intensity ratio (reverse/forward), which defines the degree of reversibility of V2+/V3+ redox on an electrode, was also investigated. For an ideal redox system, such a ratio would be unity, 1. The values mentioned above, 0.74 and 0.86 for CP and N-CP, respectively, were reduced to 0.47 and 0.65 after 600 cycles. This drop in the peak ratio alone with the shift in ΔE indicates that potential cycling has affected both the coulometric charge manifested from the peak current, which has a direct relationship with surface active sites, and the redox kinetics, which is associated with charge transfer between the redox species and electrode active sites. As illustrated in Table 1, the loss in peak current ratio (ir/if) and potential peak separation (ΔE) after 600 cycles were found to be 36% and 56% for the CP electrode and 24% and 25% for N-CP, respectively.
| E f (V) | E r (V) | i r (mA cm−2) | i f (mA cm−2) | ΔE (V) | (ir/if)abs | |
|---|---|---|---|---|---|---|
| r: reverse, f: forward, abs: absolute value. | ||||||
| 1st cycles | ||||||
| CP | −0.62 | −0.43 | 13.19 | −17.88 | 0.19 | 0.74 |
| N-CP | −0.53 | −0.45 | 12.38 | −14.37 | 0.08 | 0.86 |
| 600th cycles | ||||||
| CP | −0.63 | −0.38 | 7.21 | −15.49 | 0.25 | 0.47 |
| N-CP | −0.53 | −0.43 | 10.05 | −15.54 | 0.10 | 0.65 |
XPS characterization
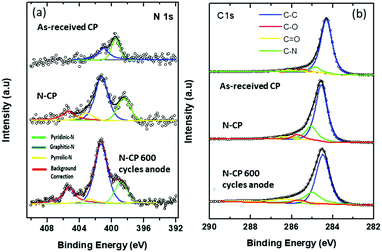
The development of nitrogen-doped active sites on carbon materials with activity towards V-redox reactions has been a subject of discussion among many scientists. The discussion centered on which nitrogen function, between graphitic-N (N bonding to three carbon atoms) and pyridinic-N (N bonding to two carbon atoms), is responsible for the creation of active sites on carbon materials undergoing pyrolysis.42–44 The reason for this debate is to shed light on what happens during the doping process; different types of nitrogen groups are created on the carbon surface when subjected to high temperature in an atmosphere containing the acetonitrile precursor. It is very challenging, however, to know exactly which type of nitrogen is more dominant to facilitate redox reactions. In this regard, X-ray photoelectron spectroscopy (XPS) was employed and the obtained results revealed that the total nitrogen content increased significantly from 0.96 atomic% for the untreated sample, CP, to 5.96 atomic% for the treated one, N-CP. On the other hand, the total oxygen content decreased from 12.4 atomic% (in CP) to 3.70% (in N-CP), which is believed to correspond to a reduction in oxygen functional groups, paving the way for nitrogen active sites.45,46 By curve deconvolution (Fig. 8), well-defined π-conjugations based on graphitic-N (402 eV), pyridinic-N (398 eV) and pyrrolic-N (401 eV) were observed. Quantitatively, the curve was dominated by pyridinic-N and graphitic-N with peak areas of 22% and 53%, respectively, which shows that the active sites created on the N-CP carbon lattice network were made possible by these functional groups, pyridinic-N and graphitic-N. Their high percentage on the surface could be an indicator of the improved electrochemical activity of N-CP over CP. Note that it has been reported elsewhere that pyridinic-N is the most electrochemically active toward vanadium redox reactions.28,47 The negatively charged nitrogen atoms incorporated onto the carbon matrix introduce a change in the electronic and chemical environment of carbon, thereby improving electron transfer between the carbon surface and vanadium ions, which in fact results in improved adsorption of vanadium redox species onto the carbon surface, leading to enhanced electrochemical activities.32 The explanation for the improved activity of N-CP can also be supported by density functional theory calculations; carbon atoms closest to nitrogen dopants have a significantly high positive charge density to offset the strong electronic affinity of the negatively charged nitrogen atom.48 These highly positively charged carbon atoms act as the active sites for the oxidation reaction in which electrons are transferred to the reactant from the electrode. Nitrogen atoms with five valence electrons contribute an extra charge to the π-bond in CNTs grown on the carbon paper.Furthermore, it has been reported that pyridinic-N with an extra lone pair in addition to an electron that is donated by the π-conjugated system increases the electrical conductivity49 and basicity50,51 of N-CP. However, it is worth mentioning that these nitrogen functions, pyridinic-N and graphitic-N (Fig. 7), are prone to undergo protonation reactions in acidic medium, resulting in more change in the electronic environment of neighboring carbon atoms.
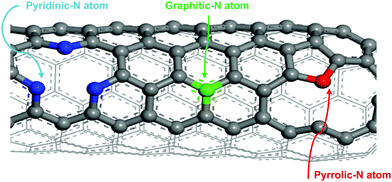 | ||
| Fig. 7 Schematic diagram of the bonding arrangement of different nitrogen atoms to carbon (graphitic-N: N bonding to three carbon atoms, pyridinic-N: N bonding to two carbon atoms). | ||
After 600 potential cycles, an interesting phenomenon was observed in the N 1s spectra of N-CP (Fig. 8(a)), in which the peak area of pyridinic-N reduced from 22% to 18.7% and pyrrolic-N from 8% to 5.4%. However, graphitic-N increased from 53% to 56.5%. This observed percentage reduction in pyridinic-N and pyrrolic-N is almost in correlation with the observed activity loss in cyclic voltammetry, which is a kind of confirmation that these two nitrogen functions, probably pyridinic-N is more dominant, have a key effect on the durability of the electrode activity during potential cycling.
On the other hand, as shown in Fig. 8(b), the deconvoluted C 1s spectra for the electrode samples, as-received CP, N-CP and potential cycled N-CP, the atomic percent of carbon in the XPS survey increased from 85.68% to 89.63% for N-CP, which is expected due to the treatment under a reducing atmosphere, which leads to removal of some oxygen functionalities as discussed above. The peak position of the C–C bond in CP is at 284.4 eV, which is very close to the acceptable value of pure C–C sp2 bonding at 284.3 eV,52 which shows that the carbon atoms are more or less entirely sp2 hybridized in CP. Meanwhile the position of the peak shifted to 284.7 eV for the sample N-CP (Fig. 8b). This positive shift of 0.3 eV in N-CP is obvious and is in agreement with values reported in the literature on nitrogen-doped thin carbon films.53 It is also consistent with the increased structural disorder in the sp2 carbon structure due to the fusion of nitrogen within the carbon lattice.51,54 As for the cycled sample, N-CP, after 600 cycles, there is no discernible shift in the peaks of carbon, which confirms our earlier statement that continuous cycling of carbon electrodes in vanadium systems leads to a loss of oxygen functionalities, but does not affect the carbon matrix.
Raman characterization
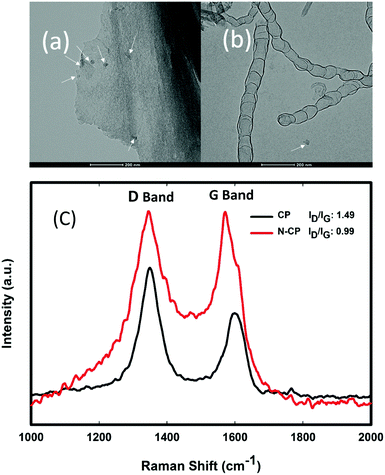
Moreover, the Raman spectra of CP and N-CP were also investigated and the results are shown in Fig. 9(c). The spectra show two strong peaks at about 1350 and 1600 cm−1, which correspond to D-band and G-band peaks, respectively. Typically, in Raman spectra, the D-band peaks show that there are defects in the morphology of the carbon, such as those caused by the presence of functional groups and amorphous carbon, while the G-band peaks reveal the level of graphitization in the carbon lattice. Thus, the ratio of the D-band to the G-band peak intensities (ID/IG) is used to determine the level of defects in a carbon matrix. The higher ID/IG ratio for the sample CP indicated a high level of disorderliness in the carbon structure, which may be due to some defects along with functional groups before treatment: Fig. 9(a) shows CP with multiple arrows showing some defect sites before thermal treatment, while Fig. 9(b) shows N-CP with clearly illustrated bamboo-like carbon nanotubes, and a single arrow indicating the loss of some defect sites that were replaced with nitrogen-rich CNTs. However, the low ID/IG ratio displayed for N-CP is clearly due to the crystallinity of CNTs grown on the carbon surface, which is expected because CNTs are graphitic carbon with a highly crystalline structure.29 X-ray diffraction (XRD) patterns of N-CP and CP carbon papers are shown in Fig. S2 (ESI†) for further information on the N-CP crystallinity. As illustrated, XRD did not reveal a significant change in the diffraction pattern of the two carbon materials, only a slight shift in peak position (2θ), which might be due to the insertion of elemental nitrogen.Subscale cell performance
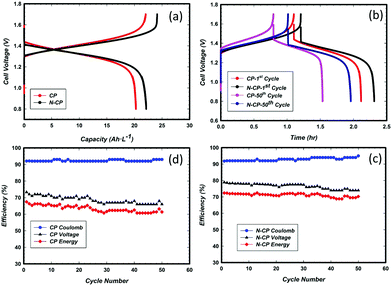
Tests of these sample electrodes with three-electrode cells are very important, but not enough. This is why it is important to further understand the performance in a real cell. In this context, a subscale single cell test was performed for both the CP and N-CP electrodes. Cell charge and discharge were conducted with V-based electrolyte. The stopping potentials of the battery were 1.7 V for charging and 0.8 V for discharging at a constant current density of 40 mA cm−2. A 50 mL min−1 electrolyte flow rate was maintained through a peristaltic pump on both the catholyte and anolyte sides. The results obtained are illustrated in Fig. 10a in the form of specific capacity versus cell voltage. Under the same experimental conditions, the N-CP electrode shows an increased capacity (about 10%) and an improved voltage efficiency of 7% as compared to the conventional electrode, CP. Nevertheless, the coulombic efficiency remained almost the same, around 92%, for both the CP and N-CP electrodes. With the aid of numerical integration (Simson trapezoidal rule eqn (1)), the voltage efficiencies of CP and N-CP were computed to be 73% and 79%, respectively. | (1) |
The energy efficiencies of CP and N-CP were also calculated and found to be 67% and 73%, respectively. Such an improvement in battery efficiency can be attributed to a number of factors: (i) the catalytic activities of nitrogen rich CNTs grown on the carbon paper, (ii) the increased real surface area of N-CP due to formation of N-CNTs on the surface, which provides more active sites for vanadium redox reactions, and (iii) improved sp2 carbon content on the treated carbon paper. This latter factor has a significant effect on the corrosion resistance; the corrosion test (Fig. 6d) of N-CP revealed an improvement in corrosion resistance by almost 2-fold as compared to its homologue CP at 1.4 V and 60 °C.
Moreover, durability studies of the electrodes, CP and N-CP, were also carried out under similar experimental conditions for 50 charge/discharge cycles. The capacities recorded are shown in Fig. 10(b). After 50 cycles, CP lost 29% in capacity, whereas N-CP lost 15%, which are equivalent to a loss in energy efficiency of 15% and 5%, respectively. The effects of cycling on the coulombic, voltage and energy efficiencies for CP and N-CP are shown in Fig. 10(c) and (d). For both electrodes, the coulombic efficiency remained unchanged at around 92% for the entire 50 cycles, while their voltage efficiencies were gradually decreasing with a steeper slope observed in CP than in N-CP. The rates of voltage efficiency loss were found to be 0.16% per cycle for CP and 0.08% per cycle for N-CP. It is important to note that the durability observed in the 3-electrode cell could not be translated entirely at the cell level due to two important factors; (i) the membrane (Nafion 212) used for the experiments allowed substantial crossover from the anode to the cathode; this was visible in the difference in the volumes of the catholyte and anolyte after an extended number of charge/discharge cycles, and (ii) the contribution from cathode degradation as a result of its high potential during cell charging. The cathode potential can reach as high as 1.4 V/RHE as evidenced by integration of a reference electrode.
One may argue that the cell performance (Fig. 10a) does not indicate a huge difference between both electrodes, CP and N-CP. However, in the long run and in terms of efficiency, we can see a net improvement in the voltage and coulombic efficiencies for the cell with N-CP.
The significance of this work lies in the promotion of thin carbon paper as well as its treatment as electrodes for VRFB reactions. Thin carbon electrodes will help increase the volumetric power density, and reduce the cost of battery materials. This may lead to the possibility of replacing the conventional carbon felt with thin (200 μm) carbon paper as efficient VRFB electrodes with good kinetics and cycling stability, especially for the anode reactions involving the redox couple V2+/V3+. Table 2 shows the comparison of peak potential separations (ΔE) in this work with those reported in the literature. A smaller ΔE indicates a low barrier to electron transfer, which enables fast Nernst equilibrium to be established upon changes in the applied potential. Whereas, a large ΔE indicates a high barrier to electron transfer, which often leads to sluggish electrochemical reactions. 100 mV and 80 mV peak potential separations are recorded in this work on the positive and negative electrodes, respectively. This signifies faster charge transfer kinetics between vanadium and N-CP than in similar reported studies using carbon felt or carbon paper. The main reason for this improvement is more likely related to nitrogen doping, which changes the electronic and chemical environments of the host carbon surface, thereby improving electron transfer between the carbon surface and vanadium ions.32
| Electrocatalysts | Working electrode | Precursor/catalyst | Positive electrode ΔE (mV) | Negative electrode ΔE (mV) | Ref. |
|---|---|---|---|---|---|
| Carbon nanofiber/nanotubes | Carbon felt | Ni(NO3)2 | 136 | 615 | 20 |
| Carbon nanorods | Carbon felt | Co3O4 | 440 | 55 | |
| Carbon nanotubes | Carbon paper | FeCl3 | 100 | 80 | This work |
| SnO2 nanoparticles | Carbon paper | Na4P2O7/C4H6O6/SnCl2 | 280 | — | 35 |
| ZrO2 nanoparticles | Carbon felt | Zr(NO3)4·5H2O/NH3·H2O | 224 | 223 | 37 |
| Carbon nanotubes | Carbon felt | Cobalt(III) nitrate | 181 | — | 29 |
| Ir-coated graphene | Ir-graphite | IrCl3·3H2O | 127 | — | 56 |
| TiN nanoparticles | Carbon paper | — | — | 103 | 57 |
| Hydroxylation (–OH) | Carbon paper | H2SO4/HNO3 (3/1: v/v) | 220 | — | 21 |
| Co3O4 nanoparticles | Carbon paper | (CH3COO)2Co·4H2O/C2H5OH | 142 | — | 58 |
Conclusions
In this work, we report the unique electrochemical property of thin carbon paper (CP) modified with bamboo-like carbon nanotubes as a potential durable thin electrode (N-CP) in all-vanadium redox flow batteries (VRFBs). Special attention was given to the anode reaction where the hydrogen evolution reaction is considered a major issue to tackle in V-RFBs. Carbon paper modification was achieved through the use of Fe (from FeCl3) as a catalyst, anhydrous acetonitrile as a source of nitrogen and carbon, and H2–Ar as the carrier gas in a chemical vapor deposition (CVD) reactor, subjected to 900 °C for 3 hours. The generated sample was characterized by electrochemical techniques (cyclic voltammetry and chronopotentiometry), XPS, Raman spectroscopy and SEM. The XPS analysis revealed about a 5% increase in the atomic percentage of nitrogen in N-CP compared to that of the as-received CP. The morphology of N-CP was analyzed by SEM, which revealed substantial growth of bamboo-like carbon nanotubes. A three-electrode cell study showed an excellent kinetic improvement for both redox reactions V2+/V3+ and V4+/V5+. On the anode, N-CP displayed a significant suppression in peak potential separation (ΔE ∼ 80 mV), which indicates much faster kinetics when compared to that of CP (ΔE ∼ 160 mV). Also, the durability of the electrode towards the anodic reaction (V3+/V2+) was far better when compared to CP. After 600 potential cycles, N-CP lost only 25% activity, whereas the pristine CP lost 56%. In addition, the subscale cell performance showed good durability, about a 5% loss in energy efficiency in N-CP, while a 15% loss was observed for CP after 50 charge–discharge cycles. This again confirms the observation of our analytical tests in a three-electrode cell. The obtained results are promising for the integration of such thin carbon paper as electrodes in redox flow battery architectures against the bulky and slow kinetics carbon felt electrodes.Although the findings are encouraging, substantial improvement in cycling at the cell level can be achieved if the crossover from the membrane is prevented. Therefore, more studies are underway to isolate the influence of crossover, and cathode polarization during extended cell cycling.
Conflicts of interest
There are no conflicts to declare.Acknowledgements
This work was supported by Qatar National Research Fund (QNRF) [NPRP grant 9-158-1-029], a member of Qatar Foundation. We acknowledge Qatar Environment & Energy Research Institute (QEERI) core lab director Dr Said Mansour and staff: Yahya Zakaria, Mohamed Helal, Mujaheed Pasha and Janarthanan Ponraj for SEM and XPS analysis. We equally acknowledge Qatar University Central Laboratories Unit (QUCLU) for the Raman spectroscopy.References
- A. Sodiq, L. Mohapatra, F. Fasmin, S. Mariyam, M. Arunachalam, A. Kheireddine, R. Zaffou and B. Merzougui, Chem. Commun., 2019, 55, 10249–10252 RSC.
- Z. Li, K. C. Smith, Y. Dong, N. Baram, F. Y. Fan, J. Xie, P. Limthongkul, W. C. Carter and Y.-M. Chiang, Phys. Chem. Chem. Phys., 2013, 15, 15833–15839 RSC.
- B. Li, Z. Nie, M. Vijayakumar, G. Li, J. Liu, V. Sprenkle and W. Wang, Nat. Commun., 2015, 6, 6303, DOI:10.1038/ncomms7303.
- L. Li, S. Kim, W. Wang, M. Vijayakumar, Z. Nie, B. Chen, J. Zhang, G. Xia, J. Hu and G. Graff, Adv. Energy Mater., 2011, 1, 394–400 CrossRef CAS.
- M. Skyllas-Kazacos, M. Rychcik, R. G. Robins, A. Fane and M. Green, J. Electrochem. Soc., 1986, 133, 1057 CrossRef CAS.
- M. Chakrabarti, R. Dryfe and E. Roberts, Electrochim. Acta, 2007, 52, 2189–2195 CrossRef CAS.
- G. Wei, C. Jia, J. Liu and C. Yan, J. Power Sources, 2012, 220, 185–192 CrossRef CAS.
- B. Li, M. Gu, Z. Nie, X. Wei, C. Wang, V. Sprenkle and W. Wang, Nano Lett., 2013, 14, 158–165 CrossRef PubMed.
- M. Park, J. Ryu, Y. Kim and J. Cho, Energy Environ. Sci., 2014, 7, 3727–3735 RSC.
- C.-N. Sun, F. M. Delnick, D. Aaron, A. Papandrew, M. M. Mench and T. A. Zawodzinski, ECS Electrochem. Lett., 2013, 2, A43–A45 CrossRef CAS.
- M. Chakrabarti, N. Brandon, S. Hajimolana, F. Tariq, V. Yufit, M. Hashim, M. Hussain, C. Low and P. Aravind, J. Power Sources, 2014, 253, 150–166 CrossRef CAS.
- W. Wang, Q. Luo, B. Li, X. Wei, L. Li and Z. Yang, Adv. Funct. Mater., 2013, 23, 970–986 CrossRef CAS.
- B. Sun and M. Skyllas-Kazacos, Electrochim. Acta, 1992, 37, 1253–1260 CrossRef CAS.
- P. Han, H. Wang, Z. Liu, X. Chen, W. Ma, J. Yao, Y. Zhu and G. Cui, Carbon, 2011, 49, 693–700 CrossRef CAS.
- M. Park, I. Y. Jeon, J. Ryu, J. B. Baek and J. Cho, Adv. Energy Mater., 2015, 5, 1401550 CrossRef.
- Z. González, C. Botas, C. Blanco, R. Santamaría, M. Granda, P. Álvarez and R. Menéndez, Nano Energy, 2013, 2, 1322–1328 CrossRef.
- M. Ulaganathan, A. Jain, V. Aravindan, S. Jayaraman, W. C. Ling, T. M. Lim, M. P. Srinivasan, Q. Yan and S. Madhavi, J. Power Sources, 2015, 274, 846–850 CrossRef CAS.
- W. Li, J. Liu and C. Yan, Carbon, 2011, 49, 3463–3470 CrossRef CAS.
- P. Han, Y. Yue, Z. Liu, W. Xu, L. Zhang, H. Xu, S. Dong and G. Cui, Energy Environ. Sci., 2011, 4, 4710–4717 RSC.
- M. Park, Y.-J. Jung, J. Kim, H. I. Lee and J. Cho, Nano Lett., 2013, 13, 4833–4839 CrossRef CAS PubMed.
- L. Yue, W. Li, F. Sun, L. Zhao and L. Xing, Carbon, 2010, 48, 3079–3090 CrossRef CAS.
- C. Flox, J. Rubio-García, M. Skoumal, T. Andreu and J. R. Morante, Carbon, 2013, 60, 280–288 CrossRef CAS.
- W. Li, J. Liu and C. Yan, Carbon, 2013, 55, 313–320 CrossRef CAS.
- W. Zhang, J. Xi, Z. Li, H. Zhou, L. Liu, Z. Wu and X. Qiu, Electrochim. Acta, 2013, 89, 429–435 CrossRef CAS.
- A. L. M. Reddy, A. Srivastava, S. R. Gowda, H. Gullapalli, M. Dubey and P. M. Ajayan, ACS Nano, 2010, 4, 6337–6342 CrossRef CAS PubMed.
- C.-H. Wang, C.-C. Chen, H.-C. Hsu, H.-Y. Du, C.-P. Chen, J.-Y. Hwang, L.-C. Chen, H.-C. Shih, J. Stejskal and K.-H. Chen, J. Power Sources, 2009, 190, 279–284 CrossRef CAS.
- Y. Wang, Y. Shao, D. W. Matson, J. Li and Y. Lin, ACS Nano, 2010, 4, 1790–1798 CrossRef CAS PubMed.
- S. Wang, X. Zhao, T. Cochell and A. Manthiram, J. Phys. Chem. Lett., 2012, 3, 2164–2167 CrossRef CAS PubMed.
- Y.-C. Chang, Y.-C. Shih, J.-Y. Chen, G.-Y. Lin, N.-Y. Hsu, Y.-S. Chou and C.-H. Wang, RSC Adv., 2016, 6, 102068–102075 RSC.
- Z. He, L. Shi, J. Shen, Z. He and S. Liu, Int. J. Energy Res., 2015, 39, 709–716 CrossRef CAS.
- A. Hachimi, B. Merzougui, A. Hakeem, T. Laoui, G. M. Swain, Q. Chang, M. Shao and M. A. Atieh, J. Nanomater., 2015, 16, 425 Search PubMed.
- T. Wu, K. Huang, S. Liu, S. Zhuang, D. Fang, S. Li, D. Lu and A. Su, J. Solid State Electrochem., 2012, 16, 579–585 CrossRef CAS.
- L. Wu, Y. Shen, L. Yu, J. Xi and X. Qiu, Nano Energy, 2016, 28, 19–28 CrossRef CAS.
- D. J. Suárez, Z. González, C. Blanco, M. Granda, R. Menéndez and R. Santamaría, ChemSusChem, 2014, 7, 914–918 CrossRef PubMed.
- X. He, Z. He, Q. Zou and L. Wu, Int. J. Energy Res., 2019, 2100–2109 Search PubMed.
- L. Wei, T. Zhao, L. Zeng, X. Zhou and Y. Zeng, Appl. Energy, 2016, 180, 386–391 CrossRef CAS.
- H. Zhou, Y. Shen, J. Xi, X. Qiu and L. Chen, ACS Appl. Mater. Interfaces, 2016, 8, 15369–15378 CrossRef CAS PubMed.
- K. J. Kim, H. S. Lee, J. Kim, M. S. Park, J. H. Kim, Y. J. Kim and M. Skyllas-Kazacos, ChemSusChem, 2016, 9, 1329–1338 CrossRef CAS PubMed.
- A. M. Pezeshki, J. T. Clement, G. M. Veith, T. A. Zawodzinski and M. M. Mench, J. Power Sources, 2015, 294, 333–338 CrossRef CAS.
- E. Agar, C. R. Dennison, K. W. Knehr and E. C. Kumbur, J. Power Sources, 2013, 225, 89–94 CrossRef CAS.
- C. Flox, M. Skoumal, J. Rubio-Garcia, T. Andreu and J. R. Morante, Appl. Energy, 2013, 109, 344–351 CrossRef CAS.
- H.-W. Liang, X. Zhuang, S. Brüller, X. Feng and K. Müllen, Nat. Commun., 2014, 5, 4973 CrossRef CAS PubMed.
- H. Kim, K. Lee, S. I. Woo and Y. Jung, Phys. Chem. Chem. Phys., 2011, 13, 17505–17510 RSC.
- N. P. Subramanian, X. Li, V. Nallathambi, S. P. Kumaraguru, H. Colon-Mercado, G. Wu, J.-W. Lee and B. N. Popov, J. Power Sources, 2009, 188, 38–44 CrossRef CAS.
- V. Nallathambi, J.-W. Lee, S. P. Kumaraguru, G. Wu and B. N. Popov, J. Power Sources, 2008, 183, 34–42 CrossRef CAS.
- G. Wu, K. L. More, C. M. Johnston and P. Zelenay, Science, 2011, 332, 443–447 CrossRef CAS PubMed.
- H. Lee and H. Kim, J. Appl. Electrochem., 2013, 43, 553–557 CrossRef CAS.
- K. Gong, F. Du, Z. Xia, M. Durstock and L. Dai, Science, 2009, 323, 760–764 CrossRef CAS PubMed.
- Q. Yang, W. Xu, A. Tomita and T. Kyotani, Chem. Mater., 2005, 17, 2940–2945 CrossRef CAS.
- C. L. y Leon, J. Solar, V. Calemma and L. R. Radovic, Carbon, 1992, 30, 797–811 CrossRef.
- S. Maldonado, S. Morin and K. J. Stevenson, Carbon, 2006, 44, 1429–1437 CrossRef CAS.
- R. L. McCreery, Electroanal. Chem., 1991, 17, 221–374 Search PubMed.
- P. Papakonstantinou and P. Lemoine, J. Phys.: Condens. Matter, 2001, 13, 2971 CrossRef CAS.
- S. Maldonado and K. J. Stevenson, J. Phys. Chem. B, 2005, 109, 4707–4716 CrossRef CAS PubMed.
- S. Abbas, H. Lee, J. Hwang, A. Mehmood, H.-J. Shin, S. Mehboob, J.-Y. Lee and H. Y. Ha, Carbon, 2018, 128, 31–37 CrossRef CAS.
- H.-M. Tsai, S.-J. Yang, C.-C. M. Ma and X. Xie, Electrochim. Acta, 2012, 77, 232–236 CrossRef CAS.
- C. Yang, H. Wang, S. Lu, C. Wu, Y. Liu, Q. Tan, D. Liang and Y. Xiang, Electrochim. Acta, 2015, 182, 834–840 CrossRef CAS.
- S. Abbas, S. Mehboob, H.-J. Shin, O. H. Han and H. Y. Ha, Chem. Eng. J., 2019, 378, 122190 CrossRef CAS.
Footnotes |
| † Electronic supplementary information (ESI) available: Further spectroscopic characterization. See DOI: 10.1039/d0ma00142b |
| ‡ Authors with equal contribution. |
| This journal is © The Royal Society of Chemistry 2020 |

