Lysosome-targeted iridium(III) compounds with pyridine-triphenylamine Schiff base ligands: syntheses, antitumor applications and mechanisms†
Shujiao
Chen
,
Xicheng
Liu
 *,
Xingxing
Ge
,
Qinghui
Wang
,
Yaoqi
Xie
,
Yingying
Hao
,
Ying
Zhang
,
Lei
Zhang
,
Wenjing
Shang
and
Zhe
Liu
 *
*
Institute of Anticancer Agents Development and Theranostic Application, The Key Laboratory of Life-Organic Analysis and Key Laboratory of Pharmaceutical Intermediates and Analysis of Natural Medicine, School of Chemistry and Chemical Engineering, Qufu Normal University, Qufu 273165, China. E-mail: chemlxc@163.com; liuzheqd@163.com
First published on 15th October 2019
Abstract
Six N-phenylcarbazole/triphenylamine modified half-sandwiched iridium(III) Schiff base compounds ([(η5-Cpx)Ir(N^N)Cl]PF6) were synthesised and characterised in this study. The regulation and introduction of Schiff bases increased the antitumor activity of these compounds (IC50: 1.4 ± 0.1 μM–11.5 ± 0.5 μM). The highest antitumor activity exhibited by these compounds was nearly 13 times that of clinical cisplatin. Interestingly, these compounds could also effectively block the migration of cancer cells. These compounds were observed to bind to proteins (binding constant: ∼104 M−1) and transport through serum protein, catalyse the oxidation of the coenzyme nicotinamide-adenine dinucleotide, and increase reactive oxygen species levels in cells, which resulted in an antitumor mechanism of oxidation. Laser confocal microscopy and flow cytometry studies confirmed that these compounds possessed an energy-dependent cellular uptake mechanism, effectively accumulated in lysosomes (Pearson co-localization coefficient: ∼0.75), damaged the integrity of acidic lysosomes, disrupted the cell cycle, induced a change in mitochondrial membrane potential, and eventually led to apoptosis. All these findings suggest that these compounds are potential antitumor agents with dual functions: metastasis inhibition and lysosomal damage.
Introduction
Lysosomes, acidic organelles (pH: ∼5.0, containing more than 50 acid hydrolytic enzymes), can degrade almost all kinds of biomacromolecules.1 A wide range of cellular processes are inseparable from lysosome-mediated degradation, e.g., apoptosis, cell migration, metabolism, plasma membrane repair, and the release of active enzymes.2,3 Generally, tumour cells contain more lysosomes and exhibit poor stability and higher cathepsin activity than normal cells. Previous studies have shown that weakly basic antitumor compounds can accumulate efficiently in lysosomes, induce lysosomal swelling and rupture, and eventually lead to lysosomal membrane permeabilisation (LMP).4 LMP, in turn, causes the release of cathepsins and other hydrolases from the lysosomal lumen to the cytosol and thus induces apoptosis or necrotic cell death.5 All these findings suggest that lysosomes could be an attractive target for selective killing of tumour cells. Agents that can interact with lysosomes could show promise for the development of novel and potent antitumor drugs.Although organometallic platinum compounds have been widely used in the clinic and have shown good effects, emerging disadvantages, such as drug resistance and adverse effects, greatly limit the scope of their applications.6,7 Due to the unique mechanism of action (inhibiting the activity of various proteins and involvement in cellular redox reactions), iridium(III) (IrIII) compounds are expected to be an effective substitute for platinum-based drugs.8–10 Among them, half-sandwiched IrIII compounds have attracted attention because of their favourable stability and antitumor activity.11–13 The general formula for half-sandwiched IrIII compounds can be described as [(arene)Ir(L^L)X], where arene represents electron-rich cyclopentadienyl or its derivatives (phenyl/biphenyl-substituted), L^L represents various chelating ligands (N^N, C^N, N^O, C^O, etc.), and X is the leaving group.14 Due to the easy modification for L^L ligands, a large number of weakly basic groups containing free electron pairs, e.g., morpholine,15 benzimidazole,16 rhodamine,17 β-carboline,18 and imine-N-heterocyclic carbine,19 have been introduced into IrIII compounds and have been used as lysosome targeted antitumor drugs and shown to achieve expected results.
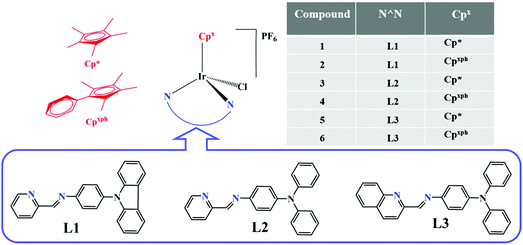
Schiff bases, a series of organic compounds containing an imide or methylamine group (–RC![[double bond, length as m-dash]](https://www.rsc.org/images/entities/char_e001.gif) N–), are usually condensed by amine (including amino acids, thiosemicarbazones, shrinkage amine, heterocyclic, hydrazone, etc.) and active carbonyl (aldehydes or ketones) and have exhibited unique medicinal effects in antiviral, antibacterial, bactericidal, and antitumor studies.20–22 Schiff bases possess good coordination ability (electron-rich nitrogen and carbon providing electron pairs) with transition metals. The development in the field of bioinorganic chemistry has increased the interest in Schiff base complexes, since it has been recognized that many of these complexes may serve as models for biologically important species.23–25 Triphenylamine (TPA), N-phenylcarbazole (PhCz) and their derivatives, classical hole-transporting and light-emitting materials, have shown potential applications in the organic photoelectric field.26,27 Additionally, recent studies have shown that TPA/PhCz can be used in the fields of biological probes and antitumor drug targeting due to its favourable luminescence properties.28 In this study, TPA/PhCz-appended Schiff base (N^N) chelating pro-ligands were prepared, and then coordination with the dimers of iridium and half-sandwiched IrIII compounds ([(η5-Cpx)Ir(N^N)Cl]PF6) (Fig. 1) was achieved. The antitumor activity of these compounds was tested in A549 (human lung cancer cells) and HeLa (human cervical cancer cells) by MTT (3-(4,5-dimethylthiazol-2-yl)-2,5-diphenyltetrazolium bromide) assay, and the antimigration ability of tumour cells was also evaluated. The fluorescence properties of the target were exploited by using laser confocal technology to investigate its cellular uptake and localisation and to understand the mechanism of its antitumor activities. TPA/PhCz-appended half-sandwiched IrIII Schiff base compounds are potential antitumor agents for further evaluation.
N–), are usually condensed by amine (including amino acids, thiosemicarbazones, shrinkage amine, heterocyclic, hydrazone, etc.) and active carbonyl (aldehydes or ketones) and have exhibited unique medicinal effects in antiviral, antibacterial, bactericidal, and antitumor studies.20–22 Schiff bases possess good coordination ability (electron-rich nitrogen and carbon providing electron pairs) with transition metals. The development in the field of bioinorganic chemistry has increased the interest in Schiff base complexes, since it has been recognized that many of these complexes may serve as models for biologically important species.23–25 Triphenylamine (TPA), N-phenylcarbazole (PhCz) and their derivatives, classical hole-transporting and light-emitting materials, have shown potential applications in the organic photoelectric field.26,27 Additionally, recent studies have shown that TPA/PhCz can be used in the fields of biological probes and antitumor drug targeting due to its favourable luminescence properties.28 In this study, TPA/PhCz-appended Schiff base (N^N) chelating pro-ligands were prepared, and then coordination with the dimers of iridium and half-sandwiched IrIII compounds ([(η5-Cpx)Ir(N^N)Cl]PF6) (Fig. 1) was achieved. The antitumor activity of these compounds was tested in A549 (human lung cancer cells) and HeLa (human cervical cancer cells) by MTT (3-(4,5-dimethylthiazol-2-yl)-2,5-diphenyltetrazolium bromide) assay, and the antimigration ability of tumour cells was also evaluated. The fluorescence properties of the target were exploited by using laser confocal technology to investigate its cellular uptake and localisation and to understand the mechanism of its antitumor activities. TPA/PhCz-appended half-sandwiched IrIII Schiff base compounds are potential antitumor agents for further evaluation.
Results and discussion
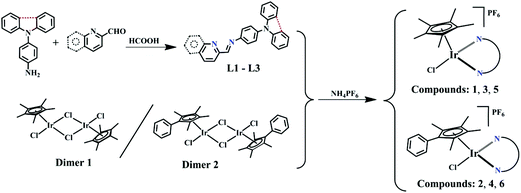
Schiff base pro-ligands (L1–L3) were obtained from the corresponding 2-formyl pyridine/quinoline and amino-substituted triphenylamine derivatives using formic acid (2 drops) catalysis (Scheme 1).291–6 ([(η5-Cpx)Ir(N^N)Cl]PF6) were synthesised by the reaction of the dimers of iridium (dimer 1 and 2) and L1–L3 at room temperature, and isolated as PF6 salt in high yield (75%–88%). The composition and structure of compounds were characterised by 1H NMR (Fig. S19 and S20†), 13C NMR (Fig. S21 and S22†), elemental analysis, electrospray ionization-mass spectrometry (ESI-MS) (Fig. S23 and S24†) and X-ray crystallography (Fig. 2). Deuterated reagent CDCl3 (7.26 ppm) or DMSO (2.50 ppm) was used as a solvent for recording the 1H NMR spectrum. The hydrogen atoms of the Cpx ring were shown in the range of 1.30 to 1.90 ppm, and those on the benzene ring and pyridine were shown in the range of 7.0 to 9.7 ppm in the 1H NMR spectrum. Additionally, multiple solvents including dichloromethane (5.30 or 5.76 ppm) and H2O (1.56 or 3.33 ppm) were used in the synthesis and purification processes, which appeared as a certain amount of residues in the 1H NMR spectrum. Carbons of the five methyl groups on cyclopentadienyl are shown in 7.76–10.37 ppm for these compounds in 13C NMR spectra, and those on the benzene ring and pyridine are shown in the range of 109.19–170.24 ppm, respectively. The results of ESI-MS were consistent with the theoretically calculated values (loss of PF6−).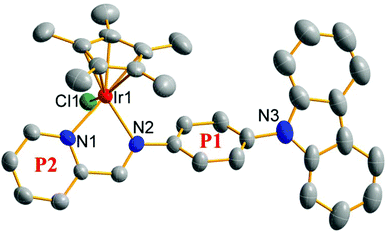 | ||
| Fig. 2 X-ray crystal structure of 1. The thermal ellipsoids drawn at the 50% probability level; H atoms and PF6 counterions were omitted for clarity. | ||
Single crystals suitable for X-ray diffraction analysis were obtained by the slow diffusion of n-hexane into a saturated dichloromethane solution of [(η5-C5Me5)Ir(L1)Cl]PF6 (1). The X-ray crystal structure is illustrated in Fig. 2 and the crystallographic data are listed in Table S1.†1 shows the expected half-sandwiched “three-legged piano-stool” geometry. The terminal carbazole group exhibits a classical planar configuration, though the benzene ring (P1) attached to it shows a relatively large angle (56.37°). The angle between P1 and P2 (pyridine ring) is 22.31°. The smaller angle ensures the good coplanar properties of the chelating pro-ligand and further improves the electron donating ability of the Schiff base pro-ligand (L1). The distance from the central iridium ion to the cyclopentadiene ring is 1.801 Å, and the distances of Ir–N1, Ir–N2 and Ir–Cl1 are 2.107(7), 2.121(7) and 2.402(2) Å, respectively.
Previous studies have shown that the stability of compounds in solution could effectively affect their bioactivity; therefore, the stability of 1–6 in a mixture of 80% DMSO-d6/20% phosphate-buffered saline (PBS, pH ≈ 7.2, prepared from D2O) was evaluated by 1H NMR spectroscopy at 37 °C.30 As shown in Fig. S1–S6,† these compounds exhibited no obvious change over 24 h, which indicated that these IrIII compounds were fairly stable and provided the conditions for the subsequent biological assay.
Cytotoxicity and antimetastatic assay
The antitumor activities of 1–6, half-sandwiched IrIII bipyridine (biPy, the most common N^N chelating ligand) compounds (7 and 8, Scheme S1†) and cisplatin against A549 (human lung cancer cells) and HeLa (human cervical cancer cells) were determined by MTT assay after 24 h of exposure. The IC50 (concentration at which 50% cell growth was inhibited) values are listed in Table 1. 1–6 all exhibit favourable antitumor activity with the IC50 values ranging from 1.4 μM to 11.5 μM, and the highest activity is exhibited by 6 which is almost 13 times that of cisplatin (widely used in clinical studies) under the same conditions. Additionally, compared with simple biPy-based IrIII compounds (7 and 8), the activity of 1–6 was higher, suggesting that the introduction of PhCz/TPA is beneficial for antitumor activity.| Compound | IC50 (μM) | ||
|---|---|---|---|
| A549 | HeLa | BEAS-2B | |
| [(η5-C5Me5)Ir(L1)Cl]PF6 (1) | 9.0 ± 0.2 | 11.5 ± 0.5 | 14.5 ± 0.3 |
| [(η5-C5Me4C6H5)Ir(L1)Cl]PF6 (2) | 6.0 ± 0.3 | 6.3 ± 0.4 | 5.7 ± 0.1 |
| [(η5-C5Me5)Ir(L2)Cl]PF6 (3) | 7.7 ± 0.4 | 8.2 ± 0.2 | 6.9 ± 2.1 |
| [(η5-C5Me4C6H5)Ir(L2)Cl]PF6 (4) | 2.9 ± 0.2 | 3.7 ± 0.5 | 2.0 ± 0.8 |
| [(η5-C5Me5)Ir(L3)Cl]PF6 (5) | 2.3 ± 0.2 | 2.3 ± 0.1 | 1.8 ± 0.1 |
| [(η5-C5Me4C6H5)Ir(L3)Cl]PF6 (6) | 1.6 ± 0.1 | 1.4 ± 0.1 | 1.0 ± 0.2 |
| [(η5-C5Me5)Ir(biPy)Cl] PF6 (7) | >100 | >100 | >100 |
| [(η5-C5Me4C6H5)Ir(biPy)Cl]PF6 (8) | >100 | >100 | >100 |
| Cisplatin | 21.3 ± 1.7 | 7.5 ± 0.2 | 38.4 ± 2.8 |
Further, compounds containing phenyl-substituted cyclopentadienyl (η5-C5Me4C6H5: 2, 4 and 6) show higher antitumor ability than the corresponding η5-C5Me5-coordination analogues (1, 3 and 5), respectively. To understand this, quantum chemical computation was used to assess the crystal structure of 1. The Wiberg bond order of Ir–Cl (central iridium ion and the leaving chloride ion) was analysed by density functional theory calculation at the B3LYP/6-31G(d, p) (C, H, N, Cl)/SDD (Ir) level with the values of 0.6362, 0.6283 and 0.6226 for 1, 2 and 5, respectively.31,32 Obviously, the introduction of additional electron-rich phenyl (2 and 5) increases the electron donor capacity of ligands, decreases the Wiberg bond order of Ir–Cl to some extent, and thus improves the cytotoxicity of the compounds. Interestingly, the addition of a benzene ring to the Schiff-base chelating pro-ligand is more beneficial for enhancing the activity than that on cyclopentadienyl (Cp). This conclusion is also validated by the results of the MTT assay (5 > 4), which provides a structural basis for the design and optimisation of such compounds. Inductively coupled plasma mass spectrometry (ICP-MS) indicates that the values of log![[thin space (1/6-em)]](https://www.rsc.org/images/entities/char_2009.gif) P (partition coefficient in oil/water) were −0.15, −0.41 and −0.75 for 1, 2 and 5 respectively, which further indicates that the improvement of lipid solubility is beneficial to enhance the antitumor activity of these compounds. This further explains why 6 shows the best activity among these compounds. The cytotoxicity of these compounds was further evaluated in human lung epithelial cells (BEAS-2B, Table 1). However, the results were unsatisfactory, since there was no significant selectivity between tumour cells and normal cells. Hence, more structural modification is necessary in future work to decrease the cytotoxic action against normal cells without the loss of potential antitumor activity.
P (partition coefficient in oil/water) were −0.15, −0.41 and −0.75 for 1, 2 and 5 respectively, which further indicates that the improvement of lipid solubility is beneficial to enhance the antitumor activity of these compounds. This further explains why 6 shows the best activity among these compounds. The cytotoxicity of these compounds was further evaluated in human lung epithelial cells (BEAS-2B, Table 1). However, the results were unsatisfactory, since there was no significant selectivity between tumour cells and normal cells. Hence, more structural modification is necessary in future work to decrease the cytotoxic action against normal cells without the loss of potential antitumor activity.
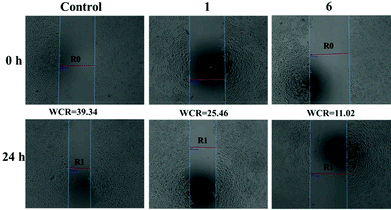
It is well known that inhibition of metastasis is an effective approach for cancer therapy. The wound healing test is commonly used to assess the antimetastatic ability of these compounds.33 As shown in Fig. 3, the middle region between the two blue lines (“wounds”) represents no tumour cells, and R0 and R1 represent the distance between cancer cells without and with the addition of targeting compounds, respectively. Wound closure ratio (WCR = (R0 − R1)/R0 × 100%) well reflects the antimetastatic ability of these compounds. The smaller the wound closure ratio, the stronger the antimetastatic ability of the targeting compounds. After incubation for 24 h, compared with the control group (WCR = 39.34), the wound closure ratios of 1 and 6 are 25.46 and 11.02, respectively. These findings validate that these compounds have a potential influence on the migration of tumor cells. In addition, this conclusion is consistent with the results of MTT assay (6 shows better anticancer activity than 1).
Protein binding assay
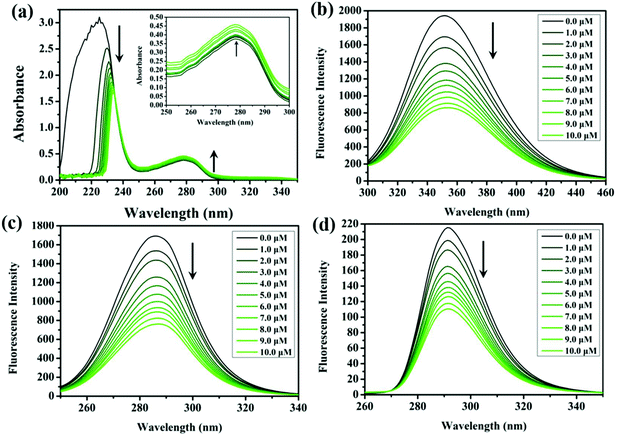
The mutual reactions between antitumor drugs and serum albumin (plenty in blood plasma, plays an indispensable role in drug transport and metabolism) may affect the biodistribution of drugs in vivo, and thus influence the effective toxicity.34 Due to the structural homology with human serum albumin, bovine serum albumin (BSA) offers a cost-effective model for protein binding, which is utilised to study the binding characteristics with the compounds in this study. The UV-vis spectra of BSA, before and after the addition of these compounds in Tris-HCl buffer solution (trishydroxymethylaminomethane-hydrochloric acid, pH = 7.2), are shown in Fig. 4a and S7.† The absorption intensity at 228 nm (the UV-vis absorption of BSA) decreases significantly along with a red shift phenomenon (∼5 nm, related to the surrounding polar solvent), which can be attributed to the induced perturbation of the α-helix of BSA after the addition of these compounds. Meanwhile, the absorption at 278 nm increases without any shift, which can be explained by the presence of three major amino acid residues (tryptophan, tyrosine, and phenylalanine) in BSA. Studies of synchronous fluorescence showed that the wavelength intervals of Δλ = 15 nm and Δλ = 60 nm are the spectral characteristics of tyrosine and tryptophan residues, respectively.35 As shown in Fig. 4c, d, S8, and S9,† the fluorescence intensity gradually decreases with the addition of these compounds, and a minor blue shift (∼2 nm) is found at Δλ = 60 nm. However, no change occurs at the wavelength of Δλ = 15 nm, which indicates that the conformation of the tryptophan microregion is influenced by the interaction between the compounds and BSA, other than tyrosine.36The interaction between the compounds and BSA was further confirmed through the fluorescence quenching phenomenon of BSA.37,38 As shown in Fig. 4b and S10,† the fluorescence intensity of BSA (351 nm) was rapidly quenched along with the addition of the compounds. The probable quenching mechanism can be interpreted by the classical Stern–Volmer equation (formula (1)):39
| F0/F = 1 + KSV[Q] = 1 + Kqτ0[Q] | (1) |
| log[(F0 − F)/F] = logKb + nlog[Q] | (2) |
| Compounds | K SV (105 M−1) | K q (1013 M−1 s−1) | K b (104 M−1) | n |
|---|---|---|---|---|
| 1 | 0.69 ± 0.10 | 0.69 | 4.33 | 1.17 |
| 2 | 0.75 ± 0.20 | 0.75 | 6.79 | 1.00 |
| 3 | 0.51 ± 0.11 | 0.51 | 6.01 | 0.92 |
| 4 | 1.25 ± 0.21 | 1.25 | 8.17 | 1.15 |
| 5 | 1.05 ± 0.13 | 1.05 | 8.30 | 1.09 |
| 6 | 1.22 ± 0.12 | 1.22 | 13.73 | 0.95 |
As shown in Fig. S12,†Kb and n are the data after linear fitting of log((F0 − F)/F) vs. log[Q]. The values of n for these compounds are almost the same (∼1), which is consistent with the results showing that the binding between BSA and IrIII compounds can affect the conformation of the tryptophan microregion. The binding constants (Kb) of 2, 4 and 6 are a little higher than those of homologous analogues (1, 3 and 5), respectively, which is also consistent with the results of the cytotoxicity assay. All these findings suggest that BSA can be an excellent carrier for the delivery of these compounds in vivo.
Biocatalytic assay
The reduced state of NADH, a control marker in the energy production chain of organisms, can transfer its own hydrogen to the compounds, and thus improve the accumulation of reactive oxygen species (ROS, 1O2), which is manifested as an antitumor mechanism of oxidation.42,43 As shown in Fig. 5a and S13,† the interaction between these compounds and NADH can be determined by UV-vis spectroscopy. The maximum absorbance of NADH and NAD+ (oxidation state of NADH after the loss of hydrogen catalysed by these compounds) is at 339 nm and 259 nm, respectively. A significant decrease and increase occur at 339 nm and 259 nm with the addition of 1–6. These changes can be effectively expressed through the turnover numbers (TONs, Fig. 5b). Among them, 6 showed the highest TONs, which indicates that 6 has the best biocatalytic performance among these compounds. Additionally, TONs of 1, 3 and 5 (η5-C5Me5) are significantly lower than those of the corresponding phenyl-appended analogues (2, 4 and 6, η5-C5Me4C6H5), and these findings are all consistent with the results of the MTT assay, suggesting that the larger the TONs, the better the antitumor activity.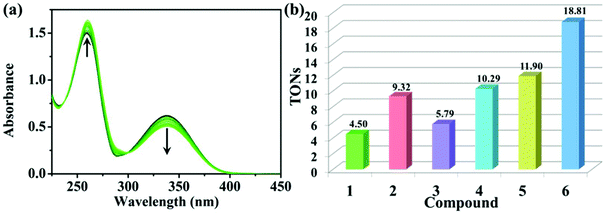 | ||
| Fig. 5 (a) UV-vis spectra of NADH (100.0 μM) after reaction with 6 (1.0 μM) in 20% MeOH/80% H2O (v/v) at 25 °C for 8 h. The arrows indicate the changes over time. (b) TONs of 1–6. | ||
The accumulation of ROS marks the change of NADH/NAD+ and may cause mitochondrial dysfunction and eventually lead to cell death.44 In this study, A549 cells were treated with 1 and 6 for 24 h, and then the ROS levels were assessed by flow cytometry. As shown in Fig. S14,† the levels of ROS are nearly 1.10 and 1.13 times that of the negative control for 1 and 6 at a concentration of 0.50 × IC50, respectively, which further confirms the biocatalytic characteristics of these compounds.
Apoptosis assay
Apoptosis, a process of programmed cell death, is a basic biological phenomenon of cells. Most metal compounds can induce apoptosis and demonstrate antitumor activity to some extent.45 In order to determine whether these IrIII compounds could induce apoptosis, A549 cells were treated with 1 and 6 at the concentrations of 0.5 × IC50, 1.0 × IC50, 2.0 × IC50 and 3.0 × IC50 for 24 h, and then analysed by flow cytometry (Fig. 6 and S15†). 1 and 6 can induce apoptosis in a dose-dependent manner, and mainly focus on late apoptosis. At the maximal concentration of incubation (3.0 ×IC50), the proportions of late apoptotic cells after exposure to 1 and 6 are 31.40% and 67.49%, respectively (Tables S2 and S3†). However, under the same conditions, 93.32% of the cells survived in the control group.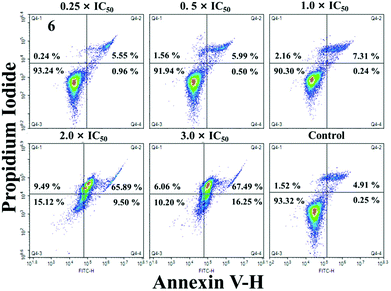 | ||
| Fig. 6 Apoptosis analysis of A549 cells after exposure to 6 for 24 h at 37 °C, determined by flow cytometry using Annexin VFITC/PI staining. | ||
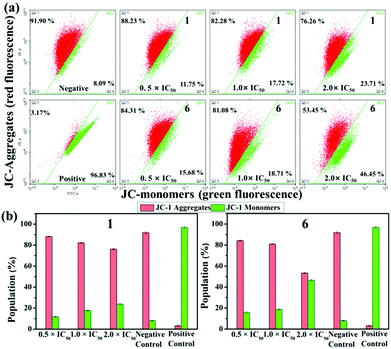
Mitochondria play a unique role in the process of apoptosis because they are the main source of intracellular ATP. A decrease in mitochondrial membrane potential (MMP) is a key indicator of apoptosis. JC-1 (5,5,6,6′-tetrachloro-1,1′,3,3′ tetraethylbenzimidazolylcarbocyanine iodide), an ideal fluorescent probe for detecting MMP with red and green fluorescence representing high and low MMP, was utilised to ascertain the depolarisation of MMP which was estimated by flow cytometry.46,47 As shown in Fig. 7a, the increase in green fluorescence was accompanied by a decrease in red fluorescence with the addition of 1 and 6. The percentage of mitochondrial membrane depolarised cells increases by 11.96% and 30.76% for 1 and 6 when the concentration changes from 0.5 × IC50 to 2.0 × IC50 (Tables S4 and S5†). The increase in the ratio of JC-1 green/red fluorescence intensity (Fig. 7b) further confirms that these IrIII compounds can induce the change of MMP, and eventually lead to apoptosis. IrIII compounds have been reported to exert antitumor effects and induce function decline through disrupting the cell cycle.48 As shown in Fig. S16 and Table S6,† when the concentration of 1 changed from 0.25 × IC50 to 2.0 × IC50, the cells in the G2/M phase increased from 9.43% to 19.44%. For 6, the cells in the G0/G1 phases increased by 16.96% (Table S7†). These results indicate that these compounds can inhibit the proliferation of A549 cells by cell cycle arrest, which eventually leads to induction of apoptosis.
Cell uptake mechanism and cellular localization
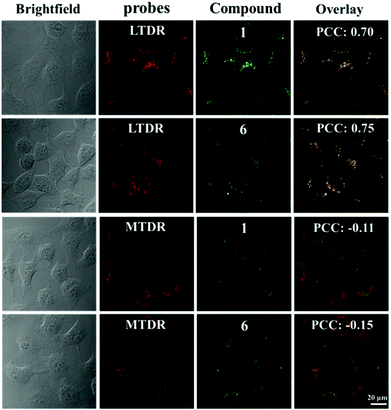
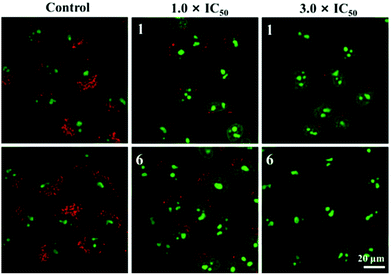
The cellular uptake mechanism is of vital importance for the activity of antitumor drugs and this was tested for the selected compounds (1 and 6) in labelled A549 cells by laser confocal microscopy. In general, cellular uptake mechanisms are mainly divided into energy-independent mechanisms and energy-dependent mechanisms.49 In this study, A549 tumour cells were incubated with 1 and 6 (10 μM) at 37 °C and 4 °C, and then treated with chlorocyanochlorophenyl (CCCP, metabolic inhibitor, 50 μM) or chloroquine (endocytosis modulator, 50 μM) to assess the cellular uptake mechanism. As shown in Fig. S17,† except for A549 cells cultured at 4 °C, the others show effective cellular uptake of 1 and 6, which indicate that 1 and 6 enter cells primarily following energy-dependent pathways. Due to the favourable targeted luminescence properties of these compounds, laser confocal microscopy was also utilised to determine the co-localisation of these compounds. MTDR (Mito Tracker Deep Red) and LTDR (Lyso Tracker Deep Red) were used as mitochondrial and lysosomal fluorescent probes in this study, respectively.50–52 As shown in Fig. 8, 1 and 6 can effectively accumulate in lysosomes with the Pearson Co-localisation Coefficients (PCC) of 0.70 and 0.75 after 1 h of incubation. However, the PCC for mitochondria is almost negligible (−0.11 and −0.15 for 1 and 6 respectively). Compared with 7 and 8 (the PCCs for lysosomes are 0.42 and 0.45 under the same conditions, Fig. S18†), these findings indicate that the introduction of the weakly basic PhCz/TPA unit at the end of N^N chelating ligands (containing electron-rich nitrogen atoms) and Schiff base group are beneficial for targeting acidic lysosomes (pH = 4.5–5.5) for these compounds.52 Additionally, these compounds do not cause abnormal cell death immediately, which makes it easy to track the changes in cells in real-time.Lysosomal damage, a process known as lysosomal membrane permeabilisation, can lead to the release of cathepsins and other hydrolases from the lysosomal lumen to the cytosol, thus inducing apoptosis.53 In general, acridine orange (AO) is usually used to determine the integrity of lysosomes. Red fluorescence and green fluorescence represent the aggregation of AO in lysosomes and nuclei or the cytoplasm, respectively.54 As shown in Fig. 9, A549 cells treated only with AO (5 μM) show a distinct red fluorescence, which indicates the lysosome integrity. However, the red fluorescence quenches quickly in a dose-dependent manner after being incubated with 1 and 6, which suggests an increase in lysosomal damage. The results further confirm that these compounds may induce cell death through the disruption of lysosomes.
Conclusion
In this study, a series of half-sandwiched iridium(III) compounds with N-phenylcarbazole/triphenylamine-appended Schiff base pro-ligands were prepared and characterised. The subtle structural changes at three locations have a major impact on their cytotoxicity, and an appropriate increase in the number of phenyl groups in the Schiff base ligand was most beneficial to improve the antitumor activity of these compounds. The compounds were stable in the biological environment and could transport through serum protein, catalyse the oxidation of NADH to NAD+, and then increase the levels of ROS in cells, which provides a mechanism of antioxidant activity. In addition, flow cytometry and laser confocal microscopy confirm that these compounds exhibit an energy-dependent cellular uptake mechanism, effectively accumulate in lysosomes and damage the integrity of acidic lysosomes, disrupt the cell cycle, lead to a change in MMP, and eventually induce apoptosis. All these findings suggest that these IrIII compounds are potential antitumor agents with dual functions, including metastasis inhibition and lysosomal damage.Experimental
General information
Iridium chloride hydrate, 1,2,3,4,5-pentamethyl-cyclopentadiene (95%), n-butyl lithium solution (1.6 M in hexane), 2,3,4,5-tetramethyl-2-cyclopentenone (95%), sodium hydride, diphenylamine, 1-fluoro-4-nitrobenzene, palladium on activated charcoal (5%), hydrazine hydrate (50%), 2-formylpyridine, 2-quinolinecarboxaldehyde, ammonium hexafluorophosphate, and N,N-dimethylformamide were purchased from Ruiya Biotechnology Co., Ltd. Fetal bovine serum, nicotinamide adenine dinucleotide (NADH), penicillin/streptomycin mixture, trypsin/EDTA, and PBS were purchased from Sangon Biotech. A549 (human lung cancer cells), HeLa (human cervical cancer cells) and BEAS-2B (human lung epithelial cells) were obtained from Shanghai Institute of Biochemistry and Cell Biology (SIBCB). Dimers of iridium (dimers 1 and 2)55 and amidogen-substituted N-phenylcarbazole/triphenylamine were synthesised according to previously described methods.29,56 The data are shown in the ESI.†NMR spectra and ESI-MS mass spectra were obtained using a Bruker DPX 500 spectrometer and an LCQ Advantage MAX mass spectrometer, respectively. Elemental analysis was performed on a VarioMICRO CHNOS elemental analyser. X-ray diffraction data were obtained on a Bruker Smart CCD area detector with graphite-monochromated Mo Kα radiation (λ = 0.71073 Å). A high performance computing system Inspur TS10K was used to obtain theoretical calculation data. UV-vis spectra and fluorescence spectra were collected on a PERSEE TU-1901 UV spectrometer and a Hitachi F-4600 fluorescence spectrophotometer, respectively. Apoptosis, cell cycle, and MMP were determined using an ACEA Novocyte 2040R flow cytometer. Cell viability assay (MTT) was performed using a Perlong DNM-9606 microplate reader at 570 nm absorbance. A Carl Zeiss AG*/LSM/880NLO two-photon laser scanning microscope was used to determine the cellular uptake and cell localisation.
The spectrograms of target compounds and the methods of biological performance testing are shown in the ESI.†
Synthesis
L1: Yield: 3.06 g (88.3%). 1H NMR (500 MHz, CDCl3) δ 8.75 (d, J = 9.1 Hz, 2H, HC![[double bond, length as m-dash]](https://www.rsc.org/images/entities/char_e001.gif) N, Ar–H), 8.27 (s, 1H, Ar–H), 8.15 (s, 2H, Ar–H), 7.86 (s, 1H, Ar–H), 7.62 (d, J = 4.1 Hz, 2H, Ar–H), 7.53 (d, J = 3.0 Hz, 2H, Ar–H), 7.44 (s, 5H, Ar–H), 7.30 (s, 2H, Ar–H). 13C NMR (126 MHz, CDCl3) δ 161.06 (HC
N, Ar–H), 8.27 (s, 1H, Ar–H), 8.15 (s, 2H, Ar–H), 7.86 (s, 1H, Ar–H), 7.62 (d, J = 4.1 Hz, 2H, Ar–H), 7.53 (d, J = 3.0 Hz, 2H, Ar–H), 7.44 (s, 5H, Ar–H), 7.30 (s, 2H, Ar–H). 13C NMR (126 MHz, CDCl3) δ 161.06 (HC![[double bond, length as m-dash]](https://www.rsc.org/images/entities/char_e001.gif) N), 154.51, 149.96, 149.84, 141.01, 137.03, 136.40, 128.03, 126.14, 125.51, 123.55, 122.75, 122.25, 120.46, 120.15, 109.93. ESI-MS (m/z): calcd for C24H17N3, [M + Na]+, 370.1; found 370.1.
N), 154.51, 149.96, 149.84, 141.01, 137.03, 136.40, 128.03, 126.14, 125.51, 123.55, 122.75, 122.25, 120.46, 120.15, 109.93. ESI-MS (m/z): calcd for C24H17N3, [M + Na]+, 370.1; found 370.1.
L2: Yield: 2.79 g (80.0%). 1H NMR (500 MHz, CDCl3) δ 8.70 (d, J = 4.4 Hz, 1H, HC![[double bond, length as m-dash]](https://www.rsc.org/images/entities/char_e001.gif) N), 8.65 (s, 1H, Ar–H), 8.19 (d, J = 7.9 Hz, 1H, Ar–H), 7.80 (t, J = 7.6 Hz, 1H, Ar–H), 7.36–7.32 (m, 1H Ar–H,), 7.30–7.25 (m, 6H, Ar–H), 7.12 (dd, J = 7.8, 5.7 Hz, 6H, Ar–H), 7.04 (t, J = 7.3 Hz, 2H, Ar–H). 13C NMR (126 MHz, CDCl3) δ 158.31 (HC
N), 8.65 (s, 1H, Ar–H), 8.19 (d, J = 7.9 Hz, 1H, Ar–H), 7.80 (t, J = 7.6 Hz, 1H, Ar–H), 7.36–7.32 (m, 1H Ar–H,), 7.30–7.25 (m, 6H, Ar–H), 7.12 (dd, J = 7.8, 5.7 Hz, 6H, Ar–H), 7.04 (t, J = 7.3 Hz, 2H, Ar–H). 13C NMR (126 MHz, CDCl3) δ 158.31 (HC![[double bond, length as m-dash]](https://www.rsc.org/images/entities/char_e001.gif) N), 154.94, 149.68, 147.61, 147.10, 144.87, 136.63, 129.34, 124.84, 124.51, 124.06, 123.10, 122.47, 121.70. ESI-MS (m/z): calcd for C24H19N3, [M + Na]+, 372.1; found 372.1.
N), 154.94, 149.68, 147.61, 147.10, 144.87, 136.63, 129.34, 124.84, 124.51, 124.06, 123.10, 122.47, 121.70. ESI-MS (m/z): calcd for C24H19N3, [M + Na]+, 372.1; found 372.1.
L3: Yield: 3.25 g (81.6%). 1H NMR (500 MHz, CDCl3) δ 10.24 (s, 1H, HC![[double bond, length as m-dash]](https://www.rsc.org/images/entities/char_e001.gif) N), 8.84 (s, 1H, Ar–H), 8.37 (d, J = 8.5 Hz, 1H, Ar–H), 8.32 (d, J = 8.4 Hz, 1H, Ar–H), 8.25 (dd, J = 13.3, 8.6 Hz, 2H, Ar–H), 8.16 (d, J = 8.4 Hz, 1H, Ar–H), 8.04 (d, J = 8.4 Hz, 1H, Ar–H), 7.91 (d, J = 8.1 Hz, 1H, Ar–H), 7.87–7.82 (m, 2H, Ar–H), 7.75 (d, J = 7.3 Hz, 1H, Ar–H), 7.70 (t, J = 7.5 Hz, 1H, Ar–H), 7.59 (t, J = 7.5 Hz, 1H, Ar–H), 7.33 (s, 1H, Ar–H), 7.14 (d, J = 7.5 Hz, 4H, Ar–H), 7.05 (t, J = 7.3 Hz, 2H, Ar–H). 13C NMR (126 MHz, CDCl3) δ 147.54 (HC
N), 8.84 (s, 1H, Ar–H), 8.37 (d, J = 8.5 Hz, 1H, Ar–H), 8.32 (d, J = 8.4 Hz, 1H, Ar–H), 8.25 (dd, J = 13.3, 8.6 Hz, 2H, Ar–H), 8.16 (d, J = 8.4 Hz, 1H, Ar–H), 8.04 (d, J = 8.4 Hz, 1H, Ar–H), 7.91 (d, J = 8.1 Hz, 1H, Ar–H), 7.87–7.82 (m, 2H, Ar–H), 7.75 (d, J = 7.3 Hz, 1H, Ar–H), 7.70 (t, J = 7.5 Hz, 1H, Ar–H), 7.59 (t, J = 7.5 Hz, 1H, Ar–H), 7.33 (s, 1H, Ar–H), 7.14 (d, J = 7.5 Hz, 4H, Ar–H), 7.05 (t, J = 7.3 Hz, 2H, Ar–H). 13C NMR (126 MHz, CDCl3) δ 147.54 (HC![[double bond, length as m-dash]](https://www.rsc.org/images/entities/char_e001.gif) N), 130.53, 130.00, 129.37, 128.83, 127.79, 127.60, 124.65, 123.84, 123.23, 122.74, 118.67. ESI-MS (m/z): calcd for C28H21N3, [M + Na]+, 422.2; found 422.1.
N), 130.53, 130.00, 129.37, 128.83, 127.79, 127.60, 124.65, 123.84, 123.23, 122.74, 118.67. ESI-MS (m/z): calcd for C28H21N3, [M + Na]+, 422.2; found 422.1.
[(η5-C5Me5)Ir(L1)Cl]PF6 (1). Yield: 94.8 mg (79.2%). 1H NMR (500 MHz, CDCl3) δ 9.02 (s, 1H, HC
![[double bond, length as m-dash]](https://www.rsc.org/images/entities/char_e001.gif) N), 8.79 (d, J = 5.2 Hz, 1H, Ar–H), 8.34 (d, J = 7.4 Hz, 1H, Ar–H), 8.17 (d, J = 7.8 Hz, 3H, Ar–H), 8.06 (d, J = 8.2 Hz, 2H, Ar–H), 7.79 (d, J = 7.8 Hz, 3H, Ar–H), 7.46 (ddd, J = 16.4, 11.8, 4.4 Hz, 4H, Ar–H), 7.36–7.32 (m, 2H, Ar–H), 1.58 (s, 15H, C5Me5–CH3). 13C NMR (126 MHz, DMSO) δ 169.26 (HC
N), 8.79 (d, J = 5.2 Hz, 1H, Ar–H), 8.34 (d, J = 7.4 Hz, 1H, Ar–H), 8.17 (d, J = 7.8 Hz, 3H, Ar–H), 8.06 (d, J = 8.2 Hz, 2H, Ar–H), 7.79 (d, J = 7.8 Hz, 3H, Ar–H), 7.46 (ddd, J = 16.4, 11.8, 4.4 Hz, 4H, Ar–H), 7.36–7.32 (m, 2H, Ar–H), 1.58 (s, 15H, C5Me5–CH3). 13C NMR (126 MHz, DMSO) δ 169.26 (HC![[double bond, length as m-dash]](https://www.rsc.org/images/entities/char_e001.gif) N), 155.07, 152.18, 147.13, 140.43, 139.59, 137.40, 130.38, 129.82, 127.43, 126.17, 124.17, 122.65, 120.39, 120.18, 109.19, 89.61, 7.76 (C5Me5–CH3). Elemental analysis: found: C, 57.79; H, 4.64; N, 5.99%, calcd for C, 57.49; H, 4.54; N, 5.92%. ESI-MS (m/z): calcd for C34H32ClF6IrN3P, [M − PF6]+, 710.1; found 710.4.
N), 155.07, 152.18, 147.13, 140.43, 139.59, 137.40, 130.38, 129.82, 127.43, 126.17, 124.17, 122.65, 120.39, 120.18, 109.19, 89.61, 7.76 (C5Me5–CH3). Elemental analysis: found: C, 57.79; H, 4.64; N, 5.99%, calcd for C, 57.49; H, 4.54; N, 5.92%. ESI-MS (m/z): calcd for C34H32ClF6IrN3P, [M − PF6]+, 710.1; found 710.4.
[(η5-C5Me4C6H5)Ir(L1)Cl]PF6 (2). Yield: 105.3 mg (82.0%).1H NMR (500 MHz, CDCl3) δ 9.06 (s, 1H, HC
![[double bond, length as m-dash]](https://www.rsc.org/images/entities/char_e001.gif) N), 8.36 (t, J = 7.5 Hz, 2H, Ar–H), 8.17 (d, J = 7.7 Hz, 2H, Ar–H), 8.07 (d, J = 8.1 Hz, 3H, Ar–H), 7.76 (d, J = 8.0 Hz, 2H, Ar–H), 7.63–7.60 (m, 2H, Ar–H), 7.55 (d, J = 1.6 Hz, 3H, Ar–H), 7.46 (dd, J = 7.1, 0.9 Hz, 2H, Ar–H), 7.41 (d, J = 8.1 Hz, 2H, Ar–H), 7.37–7.32 (m, 3H, Ar–H), 1.83 (s, 3H, C5Me4C6H5–CH3) 1.70 (s, 3H, C5Me4C6H5–CH3), 1.59 (s, 3H, C5Me4C6H5–CH3), 1.30 (s, 3H, C5Me4C6H5–CH3). 13C NMR (126 MHz, DMSO) δ 170.24 (HC
N), 8.36 (t, J = 7.5 Hz, 2H, Ar–H), 8.17 (d, J = 7.7 Hz, 2H, Ar–H), 8.07 (d, J = 8.1 Hz, 3H, Ar–H), 7.76 (d, J = 8.0 Hz, 2H, Ar–H), 7.63–7.60 (m, 2H, Ar–H), 7.55 (d, J = 1.6 Hz, 3H, Ar–H), 7.46 (dd, J = 7.1, 0.9 Hz, 2H, Ar–H), 7.41 (d, J = 8.1 Hz, 2H, Ar–H), 7.37–7.32 (m, 3H, Ar–H), 1.83 (s, 3H, C5Me4C6H5–CH3) 1.70 (s, 3H, C5Me4C6H5–CH3), 1.59 (s, 3H, C5Me4C6H5–CH3), 1.30 (s, 3H, C5Me4C6H5–CH3). 13C NMR (126 MHz, DMSO) δ 170.24 (HC![[double bond, length as m-dash]](https://www.rsc.org/images/entities/char_e001.gif) N), 155.51, 151.81, 147.22, 140.98, 139.82, 137.68, 130.80, 130.55, 130.23, 129.90, 129.12, 128.97, 128.76, 127.50, 126.48, 124.52, 122.96, 120.70, 120.52, 109.51, 96.64, 89.79, 86.89, 83.42, 9.41 (C5Me4C6H5–CH3), 8.93 (C5Me4C6H5–CH3), 8.28 (C5Me4C6H5–CH3), 8.06 (C5Me4C6H5–CH3). Elemental analysis: found: C, 60.81; H, 4.62; N, 5.53%, calcd for C, 60.65; H, 4.44; N, 5.44%. ESI-MS (m/z): calcd for C39H34ClF6IrN3P, [M − PF6]+, 772.2; found 772.4.
N), 155.51, 151.81, 147.22, 140.98, 139.82, 137.68, 130.80, 130.55, 130.23, 129.90, 129.12, 128.97, 128.76, 127.50, 126.48, 124.52, 122.96, 120.70, 120.52, 109.51, 96.64, 89.79, 86.89, 83.42, 9.41 (C5Me4C6H5–CH3), 8.93 (C5Me4C6H5–CH3), 8.28 (C5Me4C6H5–CH3), 8.06 (C5Me4C6H5–CH3). Elemental analysis: found: C, 60.81; H, 4.62; N, 5.53%, calcd for C, 60.65; H, 4.44; N, 5.44%. ESI-MS (m/z): calcd for C39H34ClF6IrN3P, [M − PF6]+, 772.2; found 772.4.
[(η5-C5Me5)Ir(L2)Cl]PF6 (3). Yield: 105.6 mg (88.0%). 1H NMR (500 MHz, CDCl3) δ 8.80 (s, 1H, HC
![[double bond, length as m-dash]](https://www.rsc.org/images/entities/char_e001.gif) N), 8.73 (d, J = 5.4 Hz, 1H, Ar–H), 8.20 (d, J = 7.7 Hz, 1H, Ar–H), 8.04 (td, J = 7.8, 1.1 Hz, 1H, Ar–H), 7.73–7.69 (m, 1H, Ar–H), 7.60 (d, J = 8.9 Hz, 2H, Ar–H), 7.32 (t, J = 7.9 Hz, 4H, Ar–H), 7.12 (dd, J = 12.3, 3.9 Hz, 7H, Ar–H), 7.09 (s, 1H, Ar–H), 1.50 (s, 15H, C5Me5–H). 13C NMR (126 MHz, DMSO) δ 166.96 (HC
N), 8.73 (d, J = 5.4 Hz, 1H, Ar–H), 8.20 (d, J = 7.7 Hz, 1H, Ar–H), 8.04 (td, J = 7.8, 1.1 Hz, 1H, Ar–H), 7.73–7.69 (m, 1H, Ar–H), 7.60 (d, J = 8.9 Hz, 2H, Ar–H), 7.32 (t, J = 7.9 Hz, 4H, Ar–H), 7.12 (dd, J = 12.3, 3.9 Hz, 7H, Ar–H), 7.09 (s, 1H, Ar–H), 1.50 (s, 15H, C5Me5–H). 13C NMR (126 MHz, DMSO) δ 166.96 (HC![[double bond, length as m-dash]](https://www.rsc.org/images/entities/char_e001.gif) N), 155.46, 152.16, 148.48, 146.40, 142.38, 140.46, 129.68, 129.64, 129.33, 124.49, 123.97, 123.93, 122.06, 89.60, 7.89 (C5Me5–CH3). Elemental analysis: found: C, 57.51; H, 4.86; N, 5.93%, calcd for C, 57.33; H, 4.81; Cl, 4.98; N, 5.90%. ESI-MS (m/z): calcd for C34H34ClF6IrN3P, [M − PF6]+, 712.2; found 712.4.
N), 155.46, 152.16, 148.48, 146.40, 142.38, 140.46, 129.68, 129.64, 129.33, 124.49, 123.97, 123.93, 122.06, 89.60, 7.89 (C5Me5–CH3). Elemental analysis: found: C, 57.51; H, 4.86; N, 5.93%, calcd for C, 57.33; H, 4.81; Cl, 4.98; N, 5.90%. ESI-MS (m/z): calcd for C34H34ClF6IrN3P, [M − PF6]+, 712.2; found 712.4.
[(η5-C5Me4C6H5)Ir(L2)Cl]PF6 (4). Yield: 98.2 mg (76.3%). 1H NMR (500 MHz, DMSO) δ 9.40 (s, 1H, HC
![[double bond, length as m-dash]](https://www.rsc.org/images/entities/char_e001.gif) N), 8.67 (d, J = 5.4 Hz, 1H, Ar–H), 8.40 (d, J = 7.1 Hz, 1H, Ar–H), 8.32 (t, J = 7.1 Hz, 1H, Ar–H), 7.84 (t, J = 6.6 Hz, 1H, Ar–H), 7.56 (d, J = 8.9 Hz, 2H, Ar–H), 7.44 (d, J = 5.4 Hz, 4H, Ar–H), 7.38 (dd, J = 8.2, 7.6 Hz, 4H, Ar–H), 7.15 (t, J = 7.4 Hz, 2H, Ar–H), 7.05 (d, J = 7.5 Hz, 4H, Ar–H), 7.01 (d, J = 8.9 Hz, 3H, Ar–H), 1.61 (d, J = 7.5 Hz, 6H, C5Me4C6H5–CH3), 1.47 (s, 3H, C5Me4C6H5–CH3), 1.38 (s, 3H, C5Me4C6H5–CH3). 13C NMR (126 MHz, DMSO) δ 167.72 (HC
N), 8.67 (d, J = 5.4 Hz, 1H, Ar–H), 8.40 (d, J = 7.1 Hz, 1H, Ar–H), 8.32 (t, J = 7.1 Hz, 1H, Ar–H), 7.84 (t, J = 6.6 Hz, 1H, Ar–H), 7.56 (d, J = 8.9 Hz, 2H, Ar–H), 7.44 (d, J = 5.4 Hz, 4H, Ar–H), 7.38 (dd, J = 8.2, 7.6 Hz, 4H, Ar–H), 7.15 (t, J = 7.4 Hz, 2H, Ar–H), 7.05 (d, J = 7.5 Hz, 4H, Ar–H), 7.01 (d, J = 8.9 Hz, 3H, Ar–H), 1.61 (d, J = 7.5 Hz, 6H, C5Me4C6H5–CH3), 1.47 (s, 3H, C5Me4C6H5–CH3), 1.38 (s, 3H, C5Me4C6H5–CH3). 13C NMR (126 MHz, DMSO) δ 167.72 (HC![[double bond, length as m-dash]](https://www.rsc.org/images/entities/char_e001.gif) N), 158.04, 155.75, 151.66, 148.57, 146.46, 142.28, 140.86, 130.50, 130.28, 129.89, 129.83, 129.79, 129.04, 128.86, 124.67, 124.16, 124.12, 121.90, 99.37, 96.63, 89.32, 86.91, 9.34 (C5Me4C6H5–CH3), 8.85 (C5Me4C6H5–CH3), 8.21 (C5Me4C6H5–CH3, 8.16 (C5Me4C6H5–CH3). Elemental analysis: found: C, 60.91; H, 4.72; N, 5.63%, calcd for C, 60.49; H, 4.69; N, 5.43%. ESI-MS (m/z): calcd for C39H36ClF6IrN3P, [M − PF6]+, 774.2; found 774.3.
N), 158.04, 155.75, 151.66, 148.57, 146.46, 142.28, 140.86, 130.50, 130.28, 129.89, 129.83, 129.79, 129.04, 128.86, 124.67, 124.16, 124.12, 121.90, 99.37, 96.63, 89.32, 86.91, 9.34 (C5Me4C6H5–CH3), 8.85 (C5Me4C6H5–CH3), 8.21 (C5Me4C6H5–CH3, 8.16 (C5Me4C6H5–CH3). Elemental analysis: found: C, 60.91; H, 4.72; N, 5.63%, calcd for C, 60.49; H, 4.69; N, 5.43%. ESI-MS (m/z): calcd for C39H36ClF6IrN3P, [M − PF6]+, 774.2; found 774.3.
[(η5-C5Me5)Ir(L3)Cl]PF6 (5). Yield: 95.3 mg (75.0%). 1H NMR (500 MHz, CDCl3) δ 9.13 (s, 1H, HC
![[double bond, length as m-dash]](https://www.rsc.org/images/entities/char_e001.gif) N), 8.47 (t, J = 8.5 Hz, 2H, Ar–H), 8.33 (d, J = 8.3 Hz, 1H, Ar–H), 8.02 (d, J = 7.4 Hz, 1H, Ar–H), 7.89 (d, J = 8.9 Hz, 3H, Ar–H), 7.81 (t, J = 7.2 Hz, 1H, Ar–H), 7.34 (t, J = 7.9 Hz, 4H, Ar–H), 7.15 (t, J = 8.3 Hz, 6H, Ar–H), 7.11 (d, J = 8.8 Hz, 2H, Ar–H), 1.42 (s, 15H, C5Me5–CH3). 13C NMR (126 MHz, DMSO) δ 164.49 (HC
N), 8.47 (t, J = 8.5 Hz, 2H, Ar–H), 8.33 (d, J = 8.3 Hz, 1H, Ar–H), 8.02 (d, J = 7.4 Hz, 1H, Ar–H), 7.89 (d, J = 8.9 Hz, 3H, Ar–H), 7.81 (t, J = 7.2 Hz, 1H, Ar–H), 7.34 (t, J = 7.9 Hz, 4H, Ar–H), 7.15 (t, J = 8.3 Hz, 6H, Ar–H), 7.11 (d, J = 8.8 Hz, 2H, Ar–H), 1.42 (s, 15H, C5Me5–CH3). 13C NMR (126 MHz, DMSO) δ 164.49 (HC![[double bond, length as m-dash]](https://www.rsc.org/images/entities/char_e001.gif) N), 158.95, 156.66, 154.86, 154.27, 148.92, 146.35, 141.74, 140.37, 138.98, 136.98, 130.58, 129.91, 128.97, 128.37, 124.96, 124.40, 121.62, 90.23, 8.37 (C5Me5–CH3). Elemental analysis: found: C, 60.01; H, 4.81; N, 5.60%, calcd for C, 59.87; H, 4.76; N, 5.51%. ESI-MS (m/z): calcd for C38H36ClF6IrN3P, [M − PF6]+, 762.2; found 762.3.
N), 158.95, 156.66, 154.86, 154.27, 148.92, 146.35, 141.74, 140.37, 138.98, 136.98, 130.58, 129.91, 128.97, 128.37, 124.96, 124.40, 121.62, 90.23, 8.37 (C5Me5–CH3). Elemental analysis: found: C, 60.01; H, 4.81; N, 5.60%, calcd for C, 59.87; H, 4.76; N, 5.51%. ESI-MS (m/z): calcd for C38H36ClF6IrN3P, [M − PF6]+, 762.2; found 762.3.
[(η5-C5Me4C6H5)Ir(L3)Cl]PF6 (6). Yield: 108.8 mg (80.2%). 1H NMR (500 MHz, DMSO) δ 9.66 (s, 1H, HC
![[double bond, length as m-dash]](https://www.rsc.org/images/entities/char_e001.gif) N), 8.91 (d, J = 8.4 Hz, 1H, Ar–H), 8.41 (d, J = 8.3 Hz, 1H, Ar–H), 8.24 (t, J = 8.4 Hz, 2H, Ar–H), 7.87 (t, J = 7.5 Hz, 1H, Ar–H), 7.76 (d, J = 8.9 Hz, 2H, Ar–H), 7.60–7.57 (m, 1H, Ar–H), 7.47–7.44 (m, 4H, Ar–H), 7.40 (t, J = 7.9 Hz, 5H, Ar–H), 7.18 (t, J = 7.3 Hz, 2H, Ar–H), 7.08 (d, J = 8.4 Hz, 4H, Ar–H), 7.03 (d, J = 8.9 Hz, 2H, Ar–H), 1.57 (s, 3H, C5Me4C6H5–CH3), 1.49 (s, 3H, C5Me4C6H5–CH3), 1.41 (s, 3H, C5Me4C6H5–CH3), 1.32 (s, 3H, C5Me4C6H5–CH3). 13C NMR (126 MHz, DMSO) δ 168.73 (HC
N), 8.91 (d, J = 8.4 Hz, 1H, Ar–H), 8.41 (d, J = 8.3 Hz, 1H, Ar–H), 8.24 (t, J = 8.4 Hz, 2H, Ar–H), 7.87 (t, J = 7.5 Hz, 1H, Ar–H), 7.76 (d, J = 8.9 Hz, 2H, Ar–H), 7.60–7.57 (m, 1H, Ar–H), 7.47–7.44 (m, 4H, Ar–H), 7.40 (t, J = 7.9 Hz, 5H, Ar–H), 7.18 (t, J = 7.3 Hz, 2H, Ar–H), 7.08 (d, J = 8.4 Hz, 4H, Ar–H), 7.03 (d, J = 8.9 Hz, 2H, Ar–H), 1.57 (s, 3H, C5Me4C6H5–CH3), 1.49 (s, 3H, C5Me4C6H5–CH3), 1.41 (s, 3H, C5Me4C6H5–CH3), 1.32 (s, 3H, C5Me4C6H5–CH3). 13C NMR (126 MHz, DMSO) δ 168.73 (HC![[double bond, length as m-dash]](https://www.rsc.org/images/entities/char_e001.gif) N), 157.25, 153.56, 152.11, 149.54, 146.75, 145.22, 143.66, 142.61, 142.46, 133.13, 132.27, 130.88, 130.38, 130.06, 129.52, 129.41, 126.36, 125.43, 125.02, 124.89, 124.80, 121.97, 98.48, 96.57, 90.65, 88.09, 10.37 (C5Me4C6H5–CH3), 10.00 (C5Me4C6H5–CH3), 9.05(C5Me4C6H5–CH3), 8.56 (C5Me4C6H5–CH3). Elemental analysis: found: C, 62.72; H, 4.69; N, 5.13%, calcd for C, 62.64; H, 4.65; N, 5.10%. ESI-MS (m/z): calcd for C43H38ClF6IrN3P, [M − PF6]+, 824.2; found 824.4.
N), 157.25, 153.56, 152.11, 149.54, 146.75, 145.22, 143.66, 142.61, 142.46, 133.13, 132.27, 130.88, 130.38, 130.06, 129.52, 129.41, 126.36, 125.43, 125.02, 124.89, 124.80, 121.97, 98.48, 96.57, 90.65, 88.09, 10.37 (C5Me4C6H5–CH3), 10.00 (C5Me4C6H5–CH3), 9.05(C5Me4C6H5–CH3), 8.56 (C5Me4C6H5–CH3). Elemental analysis: found: C, 62.72; H, 4.69; N, 5.13%, calcd for C, 62.64; H, 4.65; N, 5.10%. ESI-MS (m/z): calcd for C43H38ClF6IrN3P, [M − PF6]+, 824.2; found 824.4.
Conflicts of interest
The authors declare no competing financial interest.Acknowledgements
We thank the University Research Development Program of Shandong Province (J18KA082), the Student's Platform for Innovation and Entrepreneurship Training Program (S201910446034), the National Natural Science Foundation of China (Grant No. 21671118), the Taishan Scholars Program and the High Performance Computing Center of Qufu Normal University for their support.References
- C. L. Minchew and V. V. Didenko, Methods Mol. Biol., 2017, 1554, 229–236 CrossRef CAS.
- M. E. Guicciardi, M. Leist and G. J. Gores, Oncogene, 2004, 23, 2881–2890 CrossRef CAS.
- P. Saftig and J. Klumperman, Nat. Rev. Mol. Cell Biol., 2009, 10, 623–635 CrossRef CAS.
- J. P. Luzio and P. R. Pryor, Nat. Rev. Mol. Cell Biol., 2007, 8, 622–632 CrossRef CAS.
- A. Serrano-Puebla and P. Boya, Ann. N. Y. Acad. Sci., 2016, 1371, 30–44 CrossRef.
- B. Rosenberg, L. Vancamp, J. E. Trosko and V. H. Mansour, Nature, 1969, 222, 385–386 CrossRef CAS.
- Y. Shi, S. A. Liu, D. J. Kerwood, J. Goodisman and J. C. Dabrowiak, J. Inorg. Biochem., 2012, 107, 6–14 CrossRef CAS.
- M. H. Chen, Y. Zheng, X. J. Cai, H. Zhang, F. X. Wang, C. P. Tan, W. H. Chen, L. N. Ji and Z. W. Mao, Chem. Sci., 2019, 10, 3315–3323 RSC.
- R. Guan, Y. Chen, L. Zeng, T. W. Rees, C. Jin, J. Huang, Z. S. Chen, L. Ji and H. Chao, Chem. Sci., 2018, 9, 5183–5190 RSC.
- X. Ge, S. Chen, X. Liu, Q. Wang, L. Gao, C. Zhao, L. Zhang, M. Shao, X. Yuan, L. Tian and Z. Liu, Inorg. Chem., 2019, 58, 14175–14184 CrossRef CAS.
- J. Ruiz, C. Vicente, C. D. Haro and D. Bautista, Inorg. Chem., 2013, 52, 974–982 CrossRef CAS.
- Z. Liu, A. Habtemariam, A. M. Pizarro, S. A. Fletcher, A. Kisova, O. Vrana, L. Salassa, P. C. A. Bruijnincx, G. J. Clarkson, V. Brabec and P. J. Sadler, J. Med. Chem., 2011, 54, 3011–3026 CrossRef CAS PubMed.
- K. K. W. Lo and K. Y. Zhang, RSC Adv., 2012, 2, 12069–12083 RSC.
- S. J. Lucas, R. M. Lord, R. L. Wilson, R. M. Phillips, V. Sridharan and P. C. McGowan, Dalton Trans., 2012, 41, 13800–13802 RSC.
- K. Q. Qiu, J. Q. Wang, C. L. Song, L. L. Wang, H. Y. Zhu, H. Y. Huang, J. J. Huang, H. Wang, L. N. Ji and H. Chao, ACS Appl. Mater. Interfaces, 2016, 8, 12702–12710 CrossRef CAS.
- F. X. Wang, M. H. Chen, Y. N. Lin, H. Zhang, C. P. Tan, L. N. Ji and Z. W. Mao, ACS Appl. Mater. Interfaces, 2017, 9, 42471–42481 CrossRef CAS.
- W. Ma, Z. Tian, S. Zhang, X. He, J. Li, X. Xia, X. Chen and Z. Liu, Inorg. Chem. Front., 2018, 5, 2587–2597 RSC.
- L. He, Y. Li, C. P. Tan, R. R. Ye, M. H. Chen, J. J. Cao, L. N. Ji and Z. W. Mao, Chem. Sci., 2015, 6, 5409–5418 RSC.
- Y. Han, X. Liu, Z. Tian, X. Ge, J. Li, M. Gao, Y. Li, Y. Liu and Z Liu, Chem. – Asian J., 2018, 13, 3697–3705 CrossRef CAS.
- M. A. Malik, O. A. Dar, P. Gull, M. Y. Wani and A. A. Hashmi, Med. Chem. Commun., 2018, 9, 409–436 RSC.
- A. Prakash and D. Adhikari, Int. J. ChemTech Res., 2011, 3, 1891–1896 Search PubMed.
- W. H. Mahmoud, R. G. Deghadi and G. G. Mohamed, Appl. Organomet. Chem., 2016, 30, 221–230 CrossRef CAS.
- X. Qiao, Z. Y. Ma, C. Z. Xie, F. Xue, Y. W. Zhang, J. Y. Xu, Z. Y. Qiang, J. S. Lou, G. J. Chen and S. P. Yan, J. Inorg. Biochem., 2011, 105, 728–737 CrossRef CAS.
- S. R. Collinson and D. E. Fenton, Coord. Chem. Rev., 1996, 148, 19–40 CrossRef CAS.
- M. Nath and P. K. Saini, Dalton Trans., 2011, 40, 7077–7121 RSC.
- F. Zhang, X. Zhao, C. Yi, D. Bi, X. Bi, P. Wei, X. Liu, S. Wang, X. Li, S. M. Zakeeruddin and M. Gratzel, Nano Energy, 2017, 41, 469–475 CrossRef CAS.
- X. Zhao, F. Zhang, C. Yi, D. Bi, X. Bi, P. Wei, J. Luo, X. Liu, S. Wang, X. Li, S. M. Zakeeruddin and M. Gratzel, J. Mater. Chem. A, 2016, 4, 16330–16334 RSC.
- J. Li, X. Liu, H. Zhang, X. Ge, Y. Tang, Z. Xu, L. Tian, X. Yuan, X. Mao and Z. Liu, Inorg. Chem., 2019, 58, 1710–1718 CrossRef CAS.
- H. Naeimi, J. Safari and A. Heidarnezhad, Dyes Pigm., 2007, 73, 251–253 CrossRef CAS.
- Y. Yang, L. Guo, Z. Tian, X. Ge, Y. Gong, H. Zheng, S. Shi and Z. Liu, Organometallics, 2019, 38, 1761–1769 CrossRef CAS.
- O. Edfors, M. Sandell, J. J. van de Beek, S. K. Wilson and P. O. Börjesson, Wirel. Pers. Commun., 2000, 12, 55–70 CrossRef.
- B. Yang, Z. Cao and K. B. Letaief, IEEE Trans. Commun., 2001, 49, 1977–1987 CrossRef.
- Q. He and J. Shi, Adv. Mater., 2014, 26, 391–411 CrossRef CAS.
- O. Dömötör, C. G. Hartinger, A. K. Bytzek, T. Kiss, B. K. Keppler and E. A. Enyedy, J. Biol. Inorg. Chem., 2013, 18, 9–17 CrossRef PubMed.
- M. E. Pacheco and L. Bruzzone, J. Lumin., 2013, 137, 138–142 CrossRef CAS.
- X. He, M. Tian, X. Liu, Y. Tang, C. Shao, P. Gong, J. Liu, S. Zhang, L. Guo and Z. Liu, Chem. - Asian J., 2018, 13, 1500–1509 CrossRef CAS.
- Y. Z. Zhang, B. Zhou, Y. X. Liu, C. X. Zhou, X. L. Ding and Y. Liu, J. Fluoresc., 2008, 18, 109–118 CrossRef CAS PubMed.
- M. R. Eftink and C. A. Ghiron, J. Phys. Chem., 1976, 80, 486–493 CrossRef CAS.
- A. Castiñeiras, N. Fernández-Hermidan, I. García-Santos and L. Gómez-Rodríguez, Dalton Trans., 2012, 41, 3486–3495 Search PubMed.
- J. H. Tang, F. Luan and X. G. Chen, Bioorg. Med. Chem., 2006, 14, 3210–3217 CrossRef CAS.
- Z. J. Cheng, J. Lumin., 2012, 132, 2719–2729 CrossRef CAS.
- S. Betanzos-Lara, Z. Liu, A. Habtemariam, A. M. Pizarro, B. Qamar and P. J. Sadler, Angew. Chem., Int. Ed., 2012, 51, 3897–3900 CrossRef CAS.
- Z. Liu, R. J. Deeth, J. S. Butler, A. Habtemariam, M. E. Newton and P. J. Sadler, Angew. Chem., Int. Ed., 2013, 52, 4194–4197 CrossRef CAS.
- I. Romero-Canelon, M. Mos and P. J. Sadler, Enhancement of selectivity of an organometallic anticancer agent by redox modulation, J. Med. Chem., 2015, 58, 7874–7880 CrossRef CAS.
- V. Novohradsky, L. Zerzankova, J. Stepankova, A. Kisova, H. Kostrhunova, Z. Liu, P. J. Sadler, J. Kasparkova and V. Brabec, Metallomics, 2014, 6, 1491–1501 RSC.
- H. Antonicka, K. Choquet, Z. Y. Lin, A. C. Gingras, C. L. Kleinman and E. A. Shoubridge, EMBO Rep., 2017, 18, 28–38 CrossRef CAS.
- Y. Y. Jiang, G. H. Liu, X. R. Wang, J. M. Hu, G. Y. Zhang and S. Y. Liu, Macromolecules, 2015, 48, 764–774 CrossRef CAS.
- M. Tian, J. Li, S. Zhang, L. Guo, X. He, D. Kong, H. Zhang and Z. Liu, Chem. Commun., 2017, 53, 12810–12813 RSC.
- C. Y. Li, M. X. Yu, Y. Sun, Y. Q. Wu, C. H. Huang and F. Y. Li, J. Am. Chem. Soc., 2011, 133, 11231–11239 CrossRef CAS.
- S. Daum, M. S. V. Reshetnikov, M. Sisa, T. Dumych, M. D. Lootsik, R. Bilyy, E. Bila, C. Janko, C. Alexiou, M. Herrmann, L. Sellner and A. Mokhir, Angew. Chem., Int. Ed., 2017, 56, 15545–15549 CrossRef CAS.
- J. Yang, J. X. Zhao, Q. Cao, L. Hao, D. Zhou, Z. Gan, L. N. Ji and Z. W. Mao, ACS Appl. Mater. Interfaces, 2017, 9, 13900–13912 CrossRef CAS.
- X. He, X. Liu, Y. Tang, J. Du, M. Tian, Z. Xu, X. Liu and Z. Liu, Dyes Pigm., 2019, 160, 217–226 CrossRef CAS.
- K. Kågedal, M. Zhao, I. Svensson and U. T. Brunk, Biochem. J., 2001, 15, 335–343 CrossRef.
- G. Kroemer and L. Galluzzi, Oncotarget, 2017, 8, 112168–112169 Search PubMed.
- Z. Liu and P. J. Sadler, Acc. Chem. Res., 2014, 47, 1174–1185 CrossRef CAS.
- K. Y. Chiu, T. X. Su, J. H. Li, T. H. Lin, G. S. Liou and S. H. Cheng, J. Electroanal. Chem., 2005, 575, 95–101 CrossRef CAS.
Footnote |
| † Electronic supplementary information (ESI) available. CCDC 1948627. For ESI and crystallographic data in CIF or other electronic format see DOI: 10.1039/c9qi01161g |
| This journal is © the Partner Organisations 2020 |

