 Open Access Article
Insight into structural stability and helium diffusion behavior of Fe–Cr alloys from first-principles†
Lei Wan a,
Qingqing Wang
 a,
Xiaoqiu Yeb,
Xingzhong Cao
 c,
Shuoxue Jinc and
Tao Gao*ad
aInstitute of Atomic and Molecular Physics, Sichuan University, Chengdu, Sichuan 610065, P. R. China. E-mail: gaotao@scu.edu.cn
bScience and Technology on Surface Physics and Chemistry Laboratory, Mianyang, Sichuan 621907, P. R. China
cInstitute of High Energy Physics, Chinese Academy of Science, Beijing 100049, P. R. China
dKey Laboratory of High Energy Density Physics and Technology of Ministry of Education, Sichuan University, Chengdu, Sichuan 610064, P. R. China
First published on 20th January 2020
Abstract
We have performed the first-principles method to study the structural stability and helium diffusion behavior of Fe–Cr alloys. The calculated bulk modulus of 284.935 GPa in the non-magnetic (NM) state is in good agreement with others. We have obtained solid evidence that the alloy structures meet the mechanical stability criteria and lattice dynamics conditions in the anti-ferromagnetism (AFM) and non-magnetic (NM) states. Compared with bulk γ-Fe, a slightly larger Young's modulus indicates that the doping of Cr helps to enhance the stiffness of the material and the ability to resist the reversible deformation of shear stress, but the ductility decreased slightly. Our results revealed that the addition of interstitial He atom promotes the expansion and deformation of the lattice, and further enlarges the cell volume. The presence of Cr in the alloy structures promotes the migration of a single helium atom between octahedral interstitials, and at the same time, inhibits the diffusion of helium atoms between tetrahedral interstitials to a large extent, which seem to be trapped in tetrahedral interstitials and cannot escape. The electronic properties show that the alloy materials exhibit obvious metallicity, and the doping of Cr generates an impurity state at lower energy, which is mainly formed by the s, p of Fe and s, p shell electrons of Cr. The charge density difference graphs corroborate that there is bonding interactions between Fe and Cr atoms. Bader charge analysis shows that a stronger polar covalent bond is formed between Fe and Cr in the non-magnetic (NM) state than in the anti-ferromagnetism (AFM) state. Our results provide useful information for understanding the initial growth of helium bubbles in experiments.
1. Introduction
Stainless steel is an abbreviation of stainless acid-resistant steel, which is resistant to weak corrosion media such as air, steam and water. Stainless steel can be divided into martensitic steel, ferritic steel, austenitic steel, austenitic–ferritic (duplex) stainless steel and precipitation hardening stainless steel. Austenitic stainless steel has always played the most important role in the stainless steel family, accounting for about 70% of the total output and consumption of stainless steel. Because of its excellent plasticity, toughness and weldability, it has good corrosion resistance in oxidizing and reducing media. It is widely used in furniture decoration and the food and medical industries, such as corrosion-resistant containers, transportation pipelines, acid-resistant parts and other equipment. However, austenitic stainless steel has no magnetism and low strength, so it cannot be strengthened by phase transformation, only by cold working. Generally, solid solution treatment is used, that is, steel is heated to 1050–1150 °C, then is water-cooled or air-cooled to obtain single-phase austenite.It is well known that helium (He) has low solubility in alloy stainless steel and is not easy to diffuse. The deposited He will interact with the defects in the material to form He bubbles. At higher temperatures, He bubbles tend to accumulate at grain boundaries, phase boundaries and dislocations, causing surface bubbles or internal swelling of alloy materials.1 Kramer et al. injected atomic He with concentration of 1 × 10⁻⁷ and 3 × 10⁻⁵ into 304 austenitic stainless steel.1 Tensile tests above 540 °C showed that the progressive ductility loss measured by the total elongation at fracture was more serious in samples with high He content.1 The experimental results reveal that with the increase of He ion flux, the number of ferromagnetic phases observed in paramagnetic matrix increases from Hayashi et al.2 In recent years, many researchers have studied the effect of He accumulation and diffusion on 316 stainless steel. Gong et al. used TDS and DBS to study the behavior of He atoms in high flux and low energy He plasma exposed to 316L stainless steel annealed at 723 K after 10% deformation.3 The results indicate that there is a main peak at 450–940 K, which shows that most He is desorbed from HemVn, while the dislocation desorption peak is concealed. Sun et al. produced 316L austenitic stainless steel by SLM method with He ion irradiation at 450 °C.3 The investigations reveal that the interface provided by subgrain boundaries and nano-oxide inclusions is an effective trapping point for He bubbles and helps to improve its tolerance.4
Alloy 304 austenitic stainless steel is a standard “18/8 stainless steel”, that is, stainless steel is mainly composed of Fe, Cr and Ni,5 exhibits a face-centered cubic (fcc) austenite phase,6–8 and the content of Cr and Ni is not less than 18% and 8% respectively. Alloy austenite can be obtained by adding Cr and Ni to γ-Fe.5 It is noteworthy that many researchers have explored the effect of He on α-Fe-based Fe–Cr alloys by means of experiments and first-principles. In the framework of SIESA, Martínez et al. found that Cr and He had a significant repulsion effect at the adjacent tetrahedral positions.9 Ding et al. concluded that the existence of Cr inhibited the multiple trapping of He in the vacancy to some extent by first-principles calculation.10 Liu et al. studied the effect of the synergistic effect of He and H on the vacancy mobility by pre-implanting single-He, H and sequential (He + H) ions into Fe–Cr alloy at 573–773 K.11 They observed that the size and growth rate of dislocation loops ascended with the increase of irradiation dose and temperature.11
However, up to now, most of the studies have focused on He effect in RAFM steel based on bcc Fe or Fe–Cr alloys. Few investigations pay attention to the evolution behavior of face-centered cubic (fcc) γ-Fe and Fe–Cr alloys (austenite). In this work, we systematically investigated the electronic properties, bonding, charge transfer of Fe–Cr alloys, the effect of interstitial He on the structural stability of the alloys, and the migration barriers of interstitial He by ab initio first principles calculation method. For Fe–Cr alloys austenite, the single-layer anti-ferromagnetism (AFM), double-layer anti-ferromagnetism (AFMD), ferromagnetic (FM) and non-magnetic (NM) magnetic states were considered.12–15
2. Methodology
All calculations are fulfilled within the scheme of density functional theory (DFT) as executed by the Vienna ab initio Simulation Package (VASP).16–18 We employed the generalized gradient approximation (GGA) with the Perdew–Burke–Ernzerhof (PBE)19 functional for the exchange–correlation interaction and the projector-augmented wave (PAW) pseudopotentials20 for the valence and core electronic interactions. In the relaxation process, all atoms are completely relaxed until the total energy change between the two steps of the electron self-consistent iteration cycle is less than 10−10 eV, and the maximum force on each atom is less than 0.01 eV Å−1, the optimization will stop. In collinear approximation, spin-polarization is adopted to fit AFM, AFMD and FM states into the model, and non-spin-polarization DFT is utilized to the NM states. Under precise testing and strict screening, 2 × 2 × 2 supercells containing 32 atoms5 were selected and sampled at 3 × 3 × 3 k-points in Brillouin region by Monkhorst–Pack scheme.21 The cutoff energy of plane wave expansion is set to 500 eV, and our test proves that it is sufficient to converge the total energy of the system. The climbing-image nudged elastic band (CI-NEB) method22,23 is used to examine the minimum energy path (MEP) and migration barriers of interstitial He. All images relaxed totally until the force of each atom in each image is less than 0.05 eV Å−1.The solution energy of He in Fe–Cr alloys can be expressed as follows:
| Esol(He) = E(Cr,He) − E(Cr) −μHe | (1) |
The binding energy between A and B can be obtained as follows:
| Eb(A + B) = E(A + B) + E(pure) − [E(A) + E(B)] | (2) |
3. Results and discussions
3.1 Stable structural and magnetic states
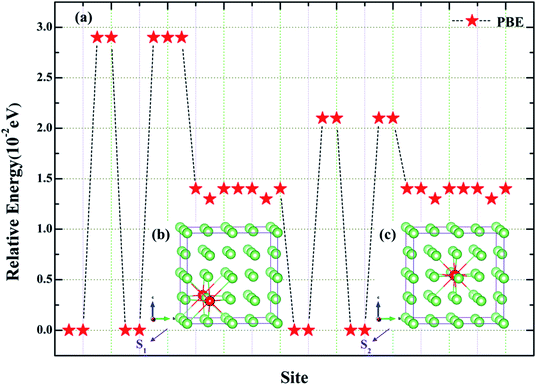
In order to accurately simulate the evolution and diffusion behavior of He in Fe–Cr alloys (austenite), we first use the principle of minimum energy to screen the stable position of adding Cr, and then select the stable magnetic state according to the mechanical stability criterion and the lattice dynamic properties of the material. The structures of Fe–Cr alloys with one Cr atom added at different locations are completely relaxed, and the relative energies of 32 corresponding configurations are obtained as shown in Fig. 1. Fig. 1 shows that there are eight structures with lower relative energy. Considering the computational resources and the completeness and accuracy of the simulation, we select two typical substitution locations, which are marked with S1 (Fig. 1b or 2d) and S2 (Fig. 1c or 2d) respectively. For both doping structures (S1 and S2), we consider four magnetic states [AFM (Fig. 2a), AFMD (Fig. 2b) FM (Fig. 2c) and NM (Fig. 2d)], as shown in Fig. 2. After that, all the calculations are based on S1 and S2 configurations, and the corresponding site of γ-Fe bulk structure is taken as a reference for comparative analysis.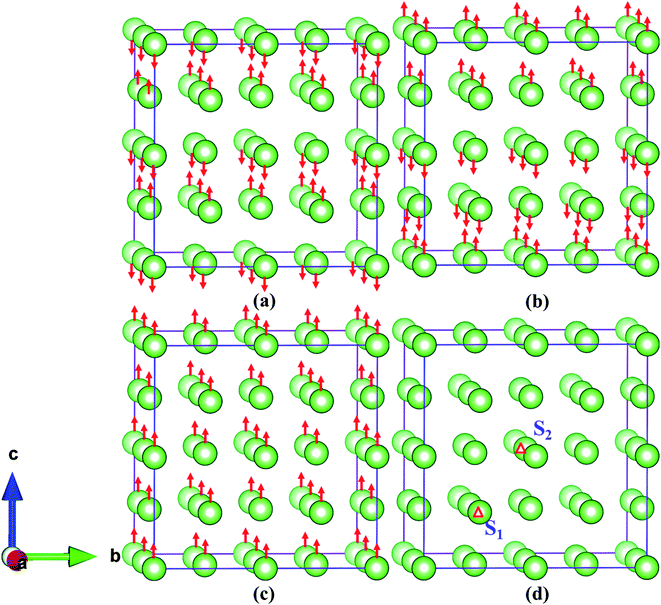 | ||
| Fig. 2 (a–d) Represent AFM, AFMD, FM and NM states of Fe–Cr alloys, respectively. The letters “S1” and “S2” in (a) denote two different configurations of one Cr replacing Fe atom, respectively. | ||
The elastic stiffness constant is a physical quantity that characterizes the elasticity of materials. There are 21 (Cij) independent constants for the generalized elastic tensor related to stress and strain in anisotropic media. Theoretical5,24 and experimental25–28 studies have confirmed that the austenitic stainless steel exhibits a face-centered cubic structure. For cubic crystalline phase, the number of independent elastic constants is reduced to 3 (C11, C12 and C44), and the mechanical stability criteria are given by as follows:
| C11 > 0, C44 > 0, C11 > |C12|, (C11 + 2C12) > 0 | (3) |
The calculated values of elastic stiffness matrix, bulk modulus (B), shear modulus (G), Young's modulus (E), Pugh ratio (B/G), Poisson's ratio (ν), A (anisotropic factors)29 and G/B ratio30,31 are presented in Table 1. The formulas of elastic moduli for cubic phase are derived from ref. 32.
 | (4) |
 | (5) |
 | (6) |
 | (7) |
 | (8) |
 | (9) |
 | (10) |
 | (11) |
| Sys. | Mag. | Cij (GPa) | B (GPa) | GR (GPa) | GV (GPa) | G (GPa) | E (GPa) | B/G | G/B | ν | A | ||
|---|---|---|---|---|---|---|---|---|---|---|---|---|---|
| C11 | C12 | C44 | |||||||||||
| a Ref. 35 (obtained by PAW and FLAPW methods).b Ref. 5 (using both LDA and GGA functionals).c Ref. 15 (under LAPW methods).d Ref. 13 (used the FLAPW method employing the WIEN95 code). | |||||||||||||
| Pure | AFM | 313.502 | 247.613 | 247.935 | 269.576 | 68.674 | 161.939 | 115.307 | 302.755 | 2.338 | 0.428 | 0.313 | 2.372 |
| Others | 198a, 193a, 323c, 193d | ||||||||||||
| AFMD | 435.479 | 209.657 | 260.918 | 284.931 | 171.169 | 201.715 | 186.442 | 459.174 | 1.528 | 0.654 | 0.231 | 1.680 | |
| Others | 130a, 127a, 127d | ||||||||||||
| FM | −39.326 | 180.332 | −31.532 | 107.113 | |||||||||
| Others | 167a, 171a, 171d, 211d | ||||||||||||
| NM | 435.483 | 209.661 | 260.918 | 284.935 | 171.169 | 201.715 | 186.442 | 459.174 | 1.528 | 0.654 | 0.231 | 1.680 | |
| Others | 282a, 293a, 320b, 240b, 232b, 293d | ||||||||||||
| S1 | AFM | 312.086 | 234.225 | 239.972 | 260.179 | 78.278 | 159.555 | 118.917 | 309.585 | 2.188 | 0.457 | 0.302 | 2.288 |
| AFMD | 138.052 | 175.416 | 171.056 | ||||||||||
| FM | −71.731 | 163.432 | −66.067 | ||||||||||
| NM | 412.040 | 218.846 | 243.790 | 283.244 | 151.468 | 184.913 | 168.191 | 421.203 | 1.684 | 0.594 | 0.252 | 1.714 | |
| S2 | AFM | 313.097 | 234.138 | 240.103 | 260.458 | 79.172 | 159.854 | 119.513 | 310.975 | 2.179 | 0.459 | 0.301 | 2.282 |
| AFMD | 133.010 | 170.140 | 169.055 | ||||||||||
| FM | −70.564 | 165.954 | −63.028 | ||||||||||
| NM | 411.983 | 219.445 | 244.001 | 283.624 | 151.194 | 184.908 | 168.051 | 421.003 | 1.688 | 0.593 | 0.253 | 1.717 | |
The subscripts V and R in formulas (4)–(6), (9) and (10) represent Voigt and Reuss bound, respectively. It is well known that the Voigt bound32 is the upper limit of the actual effective moduli and the average polycrystalline moduli is obtained on the basis of assuming the uniform strain of the whole polycrystalline. The Reuss bound33 is the lower limit of the actual effective moduli and is obtained by assuming the uniform stress. Formulas (9) and (10) are the arithmetic average of Voigt and Reuss bound, which are called Voigt–Reuss–Hill approximations.34
Combining Table 1 and cubic phase mechanical stability criterion [formula (3)], it is shown that the AFM, AFMD and NM states of pure γ-Fe satisfy the stability criteria except for the FM state, and can be stable. From Table 1, it is clear that most of the calculated eigenvalues of the elastic stiffness matrix are positive except for the FM state, which indicates that the state is unstable under elastic deformation. In general, C11 measures the directional resistance of material to linear compression along a-axis direction, while C44 corresponds to shear resistance of {100} plane. In the FM state, the elastic constants (C11 = −39.326, C44 = −31.532 GPa) are negative, which means that the ability of the linear compression resistance along a-axis direction and the shear resistance of {100} plane are weak. In the NM state, the calculated bulk modulus of 284.935 GPa is in good agreement with the computed values 282 and 293 GPa obtained by PAW and FLAPW methods by Jiang et al.35 and Herper et al.13 Our results are very close to 264 GPa (the average value of LDA and GGA values) from the work of Yu et al.5 However, in the AFM, AFMD and FM states, the bulk modulus calculated by ours are larger or smaller than that computed by others. In detail, in the AFM state, our calculated bulk modulus of 269.576 GPa is larger than that calculated by Jiang et al.35 and Herper et al.13 using PAW and FLAPW methods, but closer to 323 GPa obtained by Wang et al.15 For the AFMD state, the bulk modulus of 284.931 GPa obtained by ours is larger than those of Jiang et al.35 and Herper et al.13 The bulk modulus in FM state is smaller than others' results, but it does not satisfy the criterion of mechanical stability, so it is not considered.
The bulk modulus is the measurement of volume change resistance under applied pressure, while shear modulus is the measurement of reversible deformation resistance under shear stress. Looking closely at Table 1, we can find that the bulk modulus is much larger than the corresponding shear modulus in all magnetic states, which means that the volume deformation has a higher resistance under isotropic pressure. For perfect γ-Fe, the bulk modulus in the AFMD and NM states are 284.931 and 284.935 GPa, respectively, which are larger than the value of 269.576 GPa in the AFM state, indicating that the alloys in the AFM state have stronger compressibility than other states. Compared with bulk modulus, shear modulus is a better hardness index. The larger the shear modulus, the stronger the stiffness of materials. The calculated values of the shear modulus in both the AFMD and NM states are 186.442 GPa, which is much larger than 115.307 GPa in the AFM, which means that the alloys is more rigid in both the AFMD and NM states. Young's modulus corresponds to the deformation resistance of the alloy material. The Young's modulus 302.755 GPa calculated in the AFM state is much smaller than that in the AFMD and NM states, which implies that the material is more prone to deformation in the AFM state, which is also consistent with the smaller bulk modulus and shear modulus of the AFM state. B/G Pugh ratio is the empirical relationship between material plasticity and elasticity. The critical value for distinguishing the two properties is about 1.75.36,37 A higher B/G ratio is related to ductility, while a lower value corresponds to brittleness. Pugh ratios in AFM, AFMD and NM states are 2.338, 1.528 and 1.528, respectively. According to the rule, it can be judged that the alloys exhibit excellent ductility in AFM, but brittleness in the AFMD and NM states. Poisson's ratio is also an index of ductility, and the critical value is about 0.3.38 A larger Poisson's ratio corresponds to a better ductility, while a smaller Poisson's ratio implies a stronger bonding directivity.29 In addition, Poisson's ratio can also measure the stability of material against shear stress.39 According to this standard, the Poisson's ratio of alloy in AFM is 0.313, which should have fine ductility. However, in the states of AFMD and NM, the material is harder to deform under shear stress, and the bonding direction is stronger. Tanaka et al. proposed that G/B ratio (not B/G) denotes the relative directionality of bonding in materials.30,31 That is, bulk modulus is used as a measure of average bonding strength, while shear modulus is used as a measure of resistance of external stress to change of bonding angle. The G/B ratios of AFM, AFMD and NM states are 0.428, 0.654 and 0.654, respectively. The smaller values of AFM state indicates that the material has a weak bonding directivity, while in AFMD and NM states, it has a strong bonding directivity. This is consistent with the conclusion of smaller Poisson's ratio. The anisotropic factor (A) is used to measure the degree of elastic anisotropy. The value 1 represents complete elastic isotropy, while the value smaller or greater than 1 means elastic anisotropy. The calculated anisotropic factors are 2.372, 1.680 and 1.680 for the AFM, AFMD and NM states, respectively. This shows that the alloys exhibit elastic anisotropy in all magnetic states, especially in the AFM state.
From Table 1, for doped configurations S1 and S2, the alloy structures does not meet the mechanical stability criteria under the magnetic states of AFMD and FM. Combined with the phonon dispersion curves, as shown in Fig. 3, for AFM and NM states, the phonon dispersion curves of the structures have no imaginary frequency, indicating that they are dynamically stable. Therefore, all subsequent calculations only consider the magnetic states of AFM and NM. We have calculated the bulk modulus slightly smaller, but it is noteworthy that the calculated shear modulus and Young's modulus are 118.917 (119.513) and 309.585 GPa (310.975 GPa) for S1 (S2), respectively, in the AFM state, which are larger than the corresponding values 115.307 and 302.755 GPa for pure γ-Fe. This means that the doping of Cr helps to enhance the stiffness of the material and the ability to resist the reversible deformation of shear stress. For configuration S1 and S2, the Poisson's ratios in AFM state are 2.188 and 2.179 respectively, indicating that Fe–Cr alloy is ductile material, but it does not show better ductility than bulk γ-Fe. For S1 (S2), the smaller bulk modulus and shear modulus, and the larger B/G Pugh ratio 1.684 (1.688) in the NM state, compared with 1.528 in pure iron, indicate that the ductility of Fe–Cr alloys in the NM state is improved, but the stiffness is obviously reduced. From the calculated G/B ratio, Poisson's ratio and anisotropic factor, it can be concluded that the larger G/B ratio [0.457 (0.459)], smaller Poisson's ratio [0.302 (0.301)] and smaller anisotropic factor [2.288 (2.282)] in the AFM state imply that the relative directionality of bonding of Fe–Cr alloys increases, but the ductility and the degree of elastic anisotropy of the material decreases slightly. This is consistent with the previous analysis of modulus of elasticity. By comparing models S1 and S2, we found that S2 has stronger stiffness and relative directionality of bonding in the AFM state, and a slightly lower degree of ductility and elastic anisotropy. For the NM state, the opposite is true.
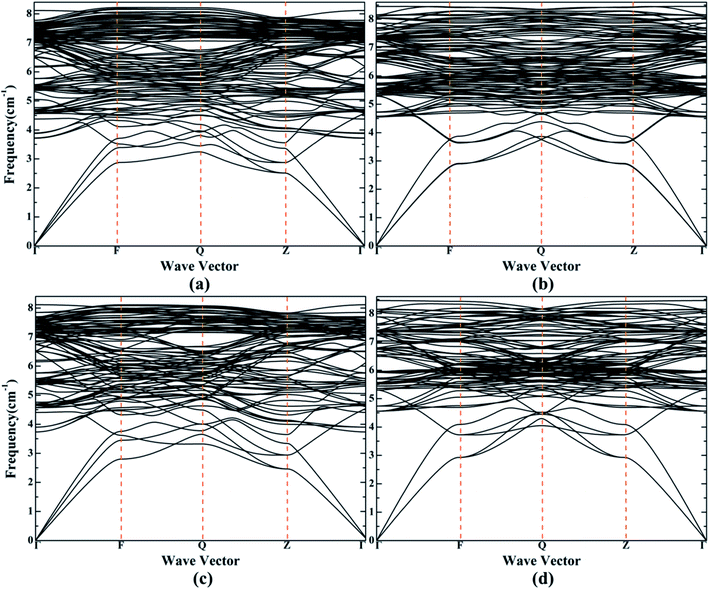 | ||
| Fig. 3 (a) and (b) Indicate the phonon dispersion curves of S1 in the AFM and NM states, respectively. (c) and (d) Denote the phonon dispersion curves of S2 in the AFM and NM states, respectively. | ||
The calculated lattice constants, axial ratio (c/a), spin orbital magnetic moments (M) and total energy (E) of pure γ-Fe and Fe–Cr alloys in AFM and NM states are listed in Table 2. The theoretical results of others and partial experimental results are used to verify the results. Looking at Table 2, we note that the optimized lattice constants (a = 3.420, c = 3.685 Å) in the AFM state are slightly different from experimental values (a = 3.56 Å) obtained by Acet et al.40 However, the relaxed lattice constants (a = c = 3.446 Å) in the NM state are obviously distorted compared with the experimental results (a = 3.645 Å) of Acet et al.40 Similar situations have been encountered in other theoretical studies. Compared with other theoretical results, our lattice constants in the AFM state are similar to the values a = 3.48 and a = 3.50 Å calculated by Jiang et al.35 using PAW and FLAPW methods respectively, which are close to a = 3.47 and c = 3.75 Å of Marcus et al.,41 and consistent with a = 3.420 Å of Medvedeva et al.42 Similarly, the lattice constants a = 3.446 Å in the NM state are close to a = 3.45 and a = 3.46 Å of Jiang et al.,35 and are in good agreement with a = 3.443 Å (average value of LDA and GGA) from Yu et al.,5 similar to a = 3.44 Å in Marcus et al.,41 and matched with a = 3.45 Å of Medvedeva et al.42 The computed axes ratios in the AFM and NM states are 1.077 and 1.000, respectively, which are in good agreement with 1.09 (1.07) and 1.00 obtained by Chohan et al.12 and Medvedeva et al.42 The total spin orbital magnetic moment calculated by ours is 0.000 μB, which is different from the experimental value 0.70 μB of Abrahams et al.,43 and is more different from the theoretical value of others.13,15,35,40,42,44,45 As we all know, the characteristic of the AFM state is that the net magnetic moment per unit volume is zero without external magnetic field, and it does not show magnetism in macroscopical. Therefore, we think our conclusion is reasonable. Since there is no magnetic moment in the NM state, we label it with “—”, which is consistent with the conclusions of Wang et al.15 and Medvedeva et al.42 The total energies of the AFM and NM states in our calculations are −260.334 and −258.553 eV, respectively. Although they differ greatly from the values of −254.120 and −254.120 eV of LAPW method used by Wang et al.,15 our results are more accurate and clearly reasonable. For doped configurations S1 and S2, we found that the optimized lattice parameters increased compared with pristine γ-Fe, indicating that the lattice expansion and cell volume increased due to the substitution of Cr for Fe. Similarly, we obtained the reasonable axial ratios c/a in the AFM and NM states of S1 and S2, 1.070 and 1.000, respectively. The calculated total spin magnetic moments of S1 and S2 in the AFM state are −0.577 and 0.554 μB, respectively. The results show that the total magnetic moments will change with the addition of Cr, and the contribution of d orbit to the total magnetic moments is the largest. The calculated total energies of S1 in AFM and NM states are −261.634 and −259.759 eV respectively, indicating that Fe–Cr alloys are more advantageous in energy than bulk iron.
| Sys. | Mag. | Lattice parameters (Å) | c/a | M (μB) | E (eV) | |||
|---|---|---|---|---|---|---|---|---|
| s | p | d | Total | |||||
| a Ref. 35 (obtained by PAW and FLAPW methods).b Ref. 40 (using the values of the atomic volume at 4 K and RT).c Ref. 5 (using both LDA and GGA functionals).d Ref. 41 (first-principles total-energy calculations combined with measured epitaxial film lattice constants and measured elastic constants).e Ref. 44 (by ab initio electronic structure calculations).f Ref. 15 (under LAPW methods).g Ref. 45 (employed the DVM in the framework of LDT).h Ref. 51 (the comparative experiment of two samples of Cu–Fe alloy).i Ref. 52 (used the PAW method as implemented in the VASP framework).j Ref. 53 (using the full-potential LAPW method implemented in the ELK code).k Ref. 13 (used the FLAPW method employing the WIEN95 code).l Ref. 12 (adopted PBE functional in the frame of VASP code).m Ref. 49 (using a new fixed spin-moment method). | ||||||||
| Pure | AFM | a = 3.420, c = 3.685 | 1.077 | −0.000 | −0.000 | 0.000 | 0.000 | −260.334 |
| Others | a = 3.48a | 1.09e 1.07i 1.07l | 0.04g | 0.05g | 1.41g | 1.51g | −254.120f | |
| a = 3.50a | 1.30a | |||||||
| a = 3.56b (exp.) | 0.75b | |||||||
| a = 3.47, c = 3.75d | 1.8e | |||||||
| a = 3.45e | 0.64f | |||||||
| a = 3.38f | 1.50g | |||||||
| a = 3.56g | 0.70h (exp.) | |||||||
| a = 3.42i | 1.6i | |||||||
| 1.30k | ||||||||
| NM | a = c = 3.446 | 1.000 | — | −258.553 | ||||
| Others | a = 3.45a | 1.00i | 0.000a | −254.120f | ||||
| a = 3.46a | 0.000a | |||||||
| a = 3.382c | —f | |||||||
| a = 3.472c | —i | |||||||
| a = 3.474c | 0.000k | |||||||
| a = 3.645b (exp.) | 0.000m | |||||||
| a = 3.44d | ||||||||
| a = 3.38f | ||||||||
| a = 3.45i | ||||||||
| a = 3.552j | ||||||||
| S1 | AFM | a = 3.430, c = 3.670 | 1.070 | 0.007 | 0.043 | −0.577 | −0.527 | −261.634 |
| NM | a = 3.451, c = 3.450 | 1.000 | — | −259.759 | ||||
| S2 | AFM | a = 3.431, c = 3.670 | 1.070 | −0.007 | −0.045 | 0.554 | 0.501 | −261.647 |
| NM | a = c = 3.451 | 1.000 | — | −259.764 | ||||
3.2 Stability of interstitial He structure
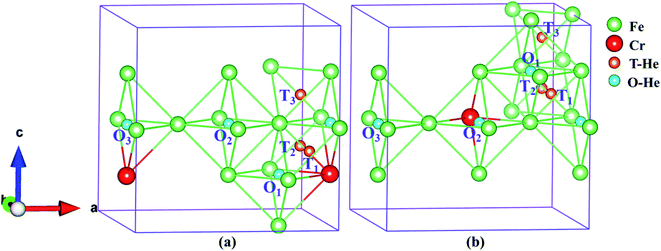
Previously, we adopted the criterion of mechanical stability and lattice dynamics to strictly screen out two stable substitution positions S1 and S2, taking into account the magnetic states of AFM and NM. Next, we use the complete relaxation method to examine the effect of interstitial He on the structural stability of the alloys. For S1 and S2, we consider three tetrahedral (T) and octahedral (O) interstitial positions, which are marked with T1, T2, and T3, O1, O2 and O3, respectively, the structures are shown in Fig. 4. The computed lattice parameters, axial ratio (c/a), spin orbital magnetic moment (M), solution energy (Esol), binding energy (Eb) and total energy (E) of different interstitial types in S1 and S2 under the AFM and NM states are presented in Tables 3 and 4.| Site | Mag. | Inter. type | Lattice parameters (Å) | c/a | M (μB) | Esol (eV) | Eb (eV) | E (eV) | |||
|---|---|---|---|---|---|---|---|---|---|---|---|
| s | p | d | Total | ||||||||
| S1 | AFM | O1 | a = 3.456, c = 3.693 | 1.069 | 0.007 | 0.044 | −0.427 | −0.376 | 4.947 | −0.204 | −256.685 |
| O2 | a = 3.445, c = 3.699 | 1.074 | −0.002 | 0.044 | 0.380 | 0.422 | 4.978 | −0.193 | −256.654 | ||
| O3 | a = 3.428, c = 3.687 | 1.076 | −0.025 | −0.020 | 2.262 | 2.217 | 5.474 | −0.159 | −256.158 | ||
| T1 | a = 3.447, c = 3.706 | 1.075 | −0.000 | 0.019 | 0.657 | 0.676 | 5.574 | −0.227 | −256.058 | ||
| T2 | a = 3.456, c = 3.693 | 1.069 | 0.007 | 0.042 | −0.378 | −0.328 | 4.947 | −0.401 | −256.685 | ||
| T3 | a = 3.456, c = 3.695 | 1.069 | 0.006 | 0.033 | −0.489 | −0.450 | 4.878 | −0.470 | −256.754 | ||
| NM | O1 | a = 3.475, c = 3.473 | 1.000 | — | 4.937 | −0.326 | −254.820 | ||||
| O2 | a = 3.468, c = 3.471 | 1.001 | — | 5.105 | −0.187 | −254.652 | |||||
| O3 | a = 3.461, c = 3.481 | 1.006 | — | 5.624 | −0.153 | −254.133 | |||||
| T1 | a = 3.473, c = 3.474 | 1.000 | — | 5.795 | −0.270 | −253.962 | |||||
| T2 | a = 3.475, c = 3.473 | 1.000 | — | 4.936 | −0.630 | −254.821 | |||||
| T3 | a = 3.474, c = 3.473 | 1.000 | — | 4.914 | −0.652 | −254.843 | |||||
| Site | Mag. | Inter. type | Lattice parameters (Å) | c/a | M (μB) | Esol (eV) | Eb (eV) | E (eV) | |||
|---|---|---|---|---|---|---|---|---|---|---|---|
| s | p | d | Total | ||||||||
| S2 | AFM | O1 | a = 3.453, c = 3.697 | 1.071 | −0.003 | −0.044 | 0.000 | −0.047 | 4.790 | −0.226 | −256.855 |
| O2 | a = 3.446, c = 3.696 | 1.072 | 0.003 | −0.007 | 1.300 | 1.296 | 4.923 | −0.159 | −256.722 | ||
| O3 | a = 3.430, c = 3.683 | 1.074 | −0.025 | −0.071 | 2.349 | 2.254 | 5.631 | 0.110 | −256.014 | ||
| T1 | a = 3.453, c = 3.696 | 1.071 | −0.003 | −0.044 | 0.013 | −0.035 | 4.791 | −0.158 | −256.854 | ||
| T2 | a = 3.453, c = 3.697 | 1.071 | −0.003 | −0.044 | −0.003 | −0.050 | 4.791 | −0.158 | −256.854 | ||
| T3 | a = 3.453, c = 3.691 | 1.069 | −0.000 | 0.023 | −1.837 | −1.814 | 5.630 | −0.076 | −256.015 | ||
| NM | O1 | a = c = 3.474 | 1.000 | — | 4.804 | −0.262 | −254.958 | ||||
| O2 | a = c = 3.472 | 1.000 | — | 5.009 | −0.222 | −254.753 | |||||
| O3 | a = 3.459, c = 3.476 | 1.005 | — | 5.632 | −0.119 | −254.130 | |||||
| T1 | a = c = 3.474 | 1.000 | — | 4.804 | −0.700 | −254.958 | |||||
| T2 | a = c = 3.474 | 1.000 | — | 4.804 | −0.700 | −254.958 | |||||
| T3 | a = c = 3.471 | 1.000 | — | 5.754 | −0.154 | −254.008 | |||||
By comparing Tables 2–4, it is not difficult to find that the addition of interstitial He atom promotes the expansion and deformation of the lattice, and further enlarges the cell volume. Except for the O3 site of models S1 and S2 in the AFM state, the lattice parameters are a = 3.428 and a = 3.430 Å, respectively, which remain unchanged or slightly decrease. Besides, from Tables 2 and 3, we obtain corresponding reasonable axial ratio of c/a, but we also notice that the larger values in the AFM state are 1.076 and 1.074 respectively, which is also reasonable in terms of numerical value compared with 1.09 of Boukhvalov et al.44 The interstitial He of different types will lead to the numerical difference of the total spin magnetic moment of configurations in the AFM state. For configuration S1, the net magnetic moments of O2 and T1 are 0.422 and 0.676 μB respectively in the AFM state, which are opposite to those of O1, T2 and T3, −0.376, −0.328 and −0.450 μB, respectively. The total magnetic moments of O1, T1 and T2 of S2 calculated in the AFM state are very small, −0.047, −0.035 and −0.050 μB, respectively. The values of O2 and T3 are similar, but its magnetic moments are opposite, 1.296 and −1.814 μB, respectively. In particular, we also found that the net magnetic moments of O3 in model S1 and S2 under the AFM state are larger than other values, 2.217 and 2.254 μB, respectively. This may be due to the rearrangement of atomic magnetic moments in the cell caused by interstitial He. Furthermore, the total spin magnetic moment is completely determined by the value of d orbital magnetic moment.46–48
From Table 3, for S1, by comparing the solution energies of He in tetrahedron and octahedral interstitial in the AFM state, we found that T1 and T3 have the highest and lowest solution energies, 5.574 and 4.878 eV, respectively. Among the three octahedral interstitials, the solution energy of O1 is 4.947 eV, which is the most advantageous. Similarly, in the NM state, T3 and O1 have lower solution energies, 4.914 and 4.937 eV, respectively. This implies that compared with other interstitial types, T3 and O1 are the tetrahedral and octahedral interstitial most easily formed in model S1, respectively. The calculated binding energies of all structures in the AFM and NM states are negative, which means that they are stable. In particular, the tetrahedron (T3) and octahedron (O1) interstitial with lower binding energies in the AFM (NM) state are −0.470 (−0.652) and −0.204 (−0.326) eV, respectively. It is proved that the most stable structures in both AFM and NM states are T3 and O1. As shown in Table 4, for model S2, we were surprised to find that T1 and T2 have the same solution energies, binding energies and total energies in AFM and NM states, indicating that T1 and T2 have the same advantages in the possibility of formation and stability. In detail, T1 (T2) and O1 have lower solution energies in AFM (NM) phase, 4.791 (4.804) and 4.790 (4.804) eV respectively, which means that T1 (T2) and O1 are easier to form. In addition, T1 (T2) and O1 have lower binding energies in AFM (NM) phase, −0.158 (−0.700) and 0.226 (0.262) eV, respectively, indicating that T1 (T2) and O1 are the stable tetrahedral and octahedral interstitials, respectively. To facilitate the comparison, T1 was selected as the representative stable tetrahedral interstitial of model S2 for further study.
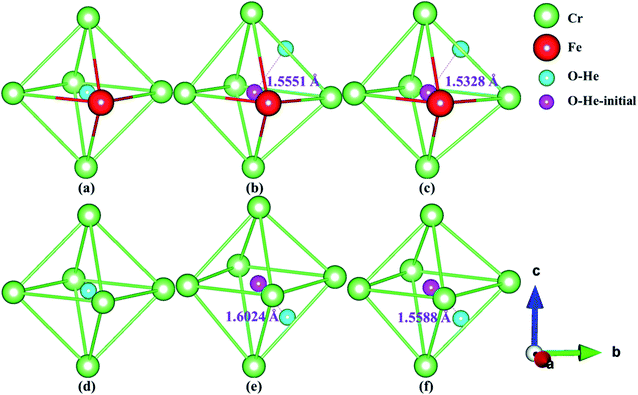
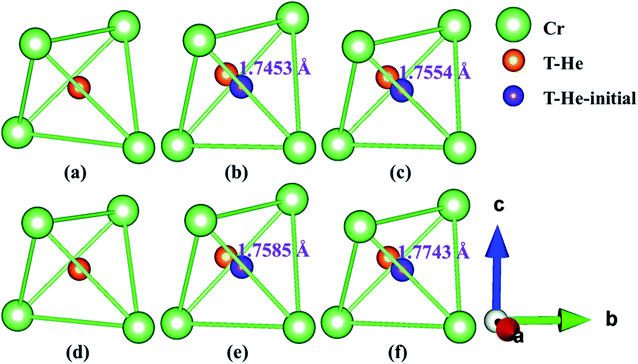
Fig. 5 and 6 show the structure diagrams of stable tetrahedral [T3 (Fig. 6b and c) and T1 (Fig. 6e and f)] and octahedral [O1 (Fig. 5b and c) and O1 (Fig. 5e and f)] interstitials after optimizing of configuration S1 and S2 in AFM and NM states. The range and average bond length before and after relaxation of stable tetrahedral and octahedral interstitials in model S1 and S2 under AFM and NM states are summarized in Table 5. For the octahedral interstitial O1 of model S1, the distances from the initial position of fully relaxed He atom in AFM and NM states are 1.5551 and 1.5328 Å, respectively, as shown in Fig. 5b and c. However, as presented in Fig. 6b and c, for the tetrahedral interstitial T3, the distances of interstitial atom from the initial position under AFM and NM states are 1.7453 and 1.7554 Å, respectively. Comparing Fig. 5 and 6, we find a similar trend, i.e., for octahedral interstitial, the optimized He atom in the AFM state deviates further from the initial position. However, for the tetrahedral interstitial, the opposite is true. Table 5 exhibits that the initial bond lengths of all tetrahedral and octahedral interstitial structures are 2.5774 Å. After complete optimization, the interstitial atom leads to lattice deformation and expansion, which changes the bond lengths in varying degrees. The bond length range of the relaxed octahedral interstitial O1 in S1 and S2 are 2.4430–2.9124 and 2.4414–2.8814 Å under the AFM state, while the optimized bond distance range of the corresponding tetrahedral interstitial T3 and T1 are 2.4276–2.8866 and 2.4491–2.8808 Å, and their average bond lengths are 2.5983 (O1), 2.5904 (O1), 2.5696 (T3) and 2.5689 Å (T1), respectively. This phenomenon indicates that the He atom in the octahedral interstitial cause a larger expansion and deformation of the lattice than in the tetrahedral interstitial. In addition, the average bond lengths of interstitial He configurations O1, T3, O1 and T1 in the NM state are 2.5571, 2.5163, 2.5482 and 2.5196 Å, suggesting that interstitial He in the NM state will cause smaller lattice deformation than that in the AFM state, and the range of bond lengths is smaller. This conclusion is consistent with the larger lattice constants of the octahedral interstitial structure in Tables 3 and 4, e.g., the lattice parameters of the octahedral interstitial O1 of S2 in the AFM state are a = 3.453, c = 3.697 Å (Table 4).
| Site | Inter. type | Mag. | R (Å) | Fig. | ||
|---|---|---|---|---|---|---|
| Initial | Final | Average | ||||
| S1 | O1 | AFM | 2.5774 | 2.4430–2.9124 | 2.5983 | 5b |
| NM | 2.4561–2.8248 | 2.5571 | 5c | |||
| T3 | AFM | 2.4276–2.8866 | 2.5696 | 6b | ||
| NM | 2.4434–2.7981 | 2.5163 | 6c | |||
| S2 | O1 | AFM | 2.5774 | 2.4414–2.8814 | 2.5904 | 5e |
| NM | 2.4564–2.8087 | 2.5482 | 5f | |||
| T1 | AFM | 2.4491–2.8808 | 2.5689 | 6e | ||
| NM | 2.4566–2.8064 | 2.5196 | 6f | |||
3.3 Migration of interstitial He in Fe–Cr alloy
In order to understand the diffusion and evolution of He in Fe–Cr alloys, the CI-NEB method was used to determine the energy barriers of He migration between interstitial sites. Based on the discussion in the previous section, we know that O1, T3 and O1, T1 are the stable octahedral and tetrahedral interstitials in configuration S1 and S2, respectively. By combining Tables 3 and 4, the binding energies of different interstitial positions are compared, so that we can obtain the metastable octahedral and tetrahedral interstitials of S1 and S2, which are O2, T2 and O2, T2, respectively. For S1 and S2, we determine the following migration paths of interstitial He in AFM and NM states: O1 → O2, T2 → T3, and T3 → O1, O1 → O2, T1 → T2, and T1 → O1, respectively, as shown in Fig. 4a and b. Based on the binding energies of the interstitial structures in Tables 3 and 4, combined with the comparative analysis of Table 5, it is not difficult to conclude that the tetrahedral interstitial has more advantages in energy and the structure is more stable than the octahedron interstitial. Moreover, to investigate the diffusion behavior of He atom in tetrahedral interstitials, we consider the migration of He between four tetrahedral interstitials in models S1 and S2, as shown in Fig. 7a and b, i.e. T1 → T2 → T3 → T4. The energy barriers of helium migration between octahedral interstitials (O1 → O2), tetrahedral and octahedral interstitials (T3 → O1, T1 → O1), and tetrahedral interstitials (T2 → T3, T1 → T2, T1 → T2 → T3 → T4) in configurations S1, S2 and bulk iron are shown in Fig. 8–10.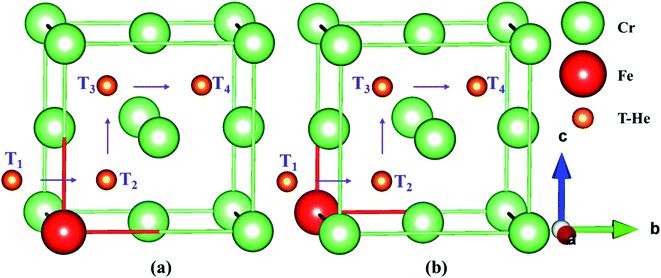 | ||
| Fig. 7 The migration paths between four stable tetrahedral interstitials (T1 → T2 → T3 → T4) in models S1 (a) and S2 (b). “T-He” denotes the He atoms in tetrahedral interstitials. | ||
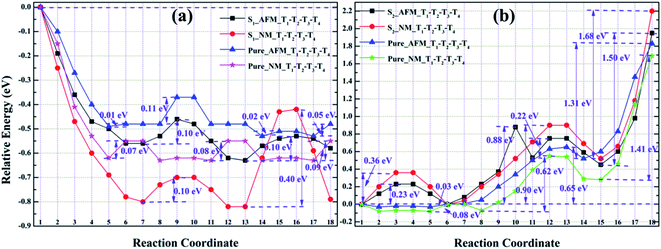 | ||
| Fig. 10 The energy barriers of He migration between the tetrahedral interstitials (T1 → T2 → T3 → T4) of S1 (a), S2 (b) and its corresponding pure iron in the AFM and NM states. | ||
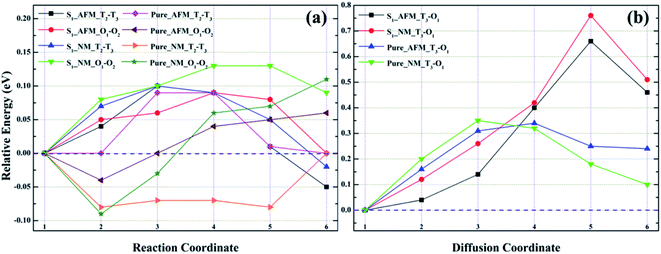
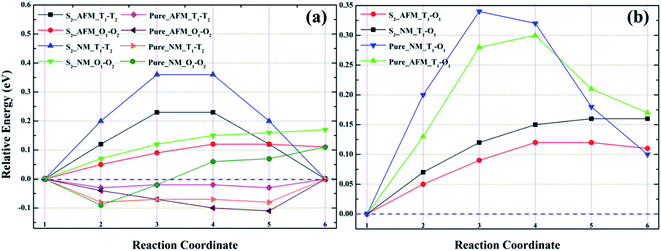
As shown in Fig. 8a, for model S1, the migration barriers of O1 → O2 in AFM and NM are 0.09 and 0.13 eV, respectively. The structural diagrams are shown in Fig. S1a and c.† In corresponding bulk γ-Fe, the diffusion barriers of O1 → O2 in AFM and NM states are 0.10 and 0.20 eV, respectively. Obviously, He migration in the octahedral interstitial is easier in Fe–Cr alloys. For configuration S2, as presented in Fig. 9a, the diffusion barriers of He in the octahedral interstitial O1 → O2 are 0.11 and 0.17 eV, respectively, in AFM and NM states. The structural diagrams are presented in Fig. S3a and c.† In pure iron, the energy barriers of He migration in the corresponding octahedral interstitial O1 → O2 under AFM and NM states are 0.11 and 0.20 eV, respectively. The smaller energy barriers indicate that single helium atom can diffuse between octahedral interstitials, and helium migration is easier in Fe–Cr alloys. Similarly, from Fig. 8a, the diffusion barriers of tetrahedral interstitial T2 → T3 in S1 and bulk γ-Fe under AFM (NM) state are 0.10 (0.10) and 0.09 (0.08) eV, respectively. The structural diagrams are shown in Fig. S1b and d.† For S2, the migration barriers of helium in tetrahedral interstitial T1 → T2 under AFM and NM states are 0.23 and 0.36 eV respectively, while in pure γ-Fe, the diffusion barriers of T1 → T2 in AFM and NM states are 0.03 and 0.08 eV respectively, as exhibited in Fig. 9a. The structural graph is presented in Fig. S3b and d.† The larger energy barriers in Fe–Cr alloys imply that the addition of Cr hinders the diffusion of single helium atom between tetrahedral interstitials to some extent. It can be seen from Fig. 8b that the diffusion barriers of helium from T3 to O1 in S1 and pure γ-Fe under AFM (NM) state are 0.66 (0.76) and 0.34 (0.35) eV, respectively. The structural diagrams are listed in Fig. S2a and b.† For S2, from Fig. 9b, the migration barriers of T1 → O1 in AFM and NM states are 0.12 and 0.16 eV, respectively, while the diffusion barriers of corresponding bulk structure in AFM and NM states are 0.30 and 0.34 eV, respectively. The structural diagrams are displayed in Fig. S4a and b.† By comparing Fig. 8b and 9b, we are surprised to find two completely opposite effect of Cr atom, that is, for model S1, larger migration barriers in alloy structures indicate that the addition of Cr largely inhibits the diffusion of single helium between tetrahedral and octahedral interstitials, while for S2, the presence of Cr significantly promote the migration of a single helium. Besides, from Fig. 8 and 9, we can clearly see that for all configurations, there are higher energy barriers in the NM state, which confirms that He migration is beneficial in AFM state.
By observing Fig. 10a and b, we found that the relative energies of helium in models S1 and S2 along the path T1 → T2 → T3 → T4 show two completely different trends, i.e., the relative energies of S1 are all negative, while the relative energies of S2 are almost positive. As shown in Fig. 10a, for the configuration S1, there is no barrier for He diffusion at the tetrahedron interstitial T1 → T2 in the AFM and NM states, which indicates that helium atom migration from T1 to T2 is a process of gradually decreasing energy, i.e., helium spontaneously diffused from T1 to T2 in model S1. If He migrates from T1 to T2 in its corresponding pure structure, the lower energy barriers in AFM and NM states are 0.01 and 0.07 eV, which means that the diffusion of He in the bulk structure is easier to achieve T1 → T2. For He diffusion from T2 to T3, the migration barriers of S1 and its pure γ-Fe in AFM (NM) state are 0.10 (0.10) and 0.11 (0.08) eV, respectively. Their energy barrier values are comparable, and the relatively small energy barrier (0.08 eV) of bulk γ-Fe in the NM state, suggesting that it is possible for helium in model S1 and its pure iron to diffuse from T2 to T3. For configuration S1 and its pure iron, the energy barriers of helium diffusing from T3 to T4 in AFM (NM) state are 0.10 (0.40) and 0.05 (0.09) eV, respectively. The structural diagrams are shown in Fig. S5a and b.† Obviously, compared with Fe–Cr alloys, helium migrates from T3 to T4 in pure iron with smaller energy barriers, which is easier to realize the diffusion of T3 → T4. It can be concluded that in model S1 and its bulk iron, helium atom may realize the diffusion from T1 to T3, but the presence of Cr obstructs the migration of helium from T3 to T4 to some extent.
For model S2 and its perfect iron, it is clear from Fig. 10b that the energy barriers of helium diffusion from T1 to T2 in AFM (NM) state are 0.23 (0.36) and 0.03 (0.08) eV respectively. The smaller energy barriers in pure iron imply that helium diffusion from T1 to T2 is easy to achieve, whereas it is more difficult in Fe–Cr alloys. For the migration from T2 to T3, the energy barriers of helium in model S2 and pristine iron under AFM (NM) state are 0.88 (0.90) and 0.65 (0.62) eV, respectively. The larger energy barriers suggest that helium is difficult to diffuse from T2 to T3, and is more likely to achieve the migration of T2 → T3 in bulk iron than in Fe–Cr alloys. For the diffusion of T3 → T4, the energy barriers of helium migrating from T3 to T4 in model S2 and its pure iron in AFM (NM) state are 1.50 (1.68) and 1.31 (1.41) eV respectively. The much larger barrier values mean that single helium atom is difficult to diffuse from T3 to T4, but the bulk structure is more conducive to He migration than that in Fe–Cr alloys. The structural diagrams are exhibited in Fig. S6a and b.† To sum up, we can conclude that the presence of Cr atom in the alloy structures greatly limits the diffusion of a single helium atom, which seems to be trapped in tetrahedral interstitial and cannot escape.
3.4 Electronic properties and bonding interaction
Since macro-mechanical properties are the characterization of micro-bonding, in order to bridge the relationship between them, the electronic structure should be studied in detail. In addition, to further investigate the bonding interaction and charge transfer in Fe–Cr alloys, we calculated the electronic properties, charge density difference and Bader charge of the alloy structures, which are listed in Fig. 11–13, Tables S1 and S2,† respectively. As can be seen from the band structure and partial density of states (PDOS) of Fig. 11, the Fe–Cr alloys show obvious metallicity. As we all know, because the gap between the conduction band and the valence band of metal materials is very small or overlapping, it is easy for electrons to jump from the valence band to the conduction band at room temperature, and the electrons can move arbitrarily between the bands and conduct electricity. As shown in Fig. 11a, for S1, the doping of Cr in AFM state introduces an impurity band at the lower energy −7.28 eV. According to the PDOS diagram, the impurity state is mainly formed by s, p of Fe and s, p shell electrons of Cr. Furthermore, the conduction bands and valence bands located at higher energies are mainly contributed by the d and p shell electrons of Fe, and the d electrons of Cr are also involved in their formation. The lower energy bands are mainly contributed by s shell electrons of Fe. In the NM state, an impurity level is generated at −7.10 eV with a slightly higher energy than in Fig. 11a, as exhibited in Fig. 11b, s and p shell electrons of Cr contribute more to the formation of the impurity state than that of the AFM state. For S2, from Fig. 11c and d, in the AFM and NM states, the doping of Cr introduces an impurity level at −7.23 and −7.12 eV, where the energy is relatively higher and lower than S1, and the s and p shell electrons of Cr in the NM state contribute more to the formation of impurity state, which is consistent with the previous conclusions.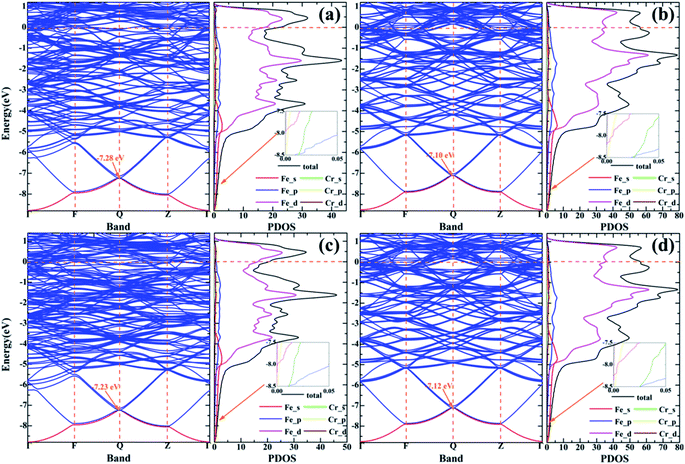 | ||
| Fig. 11 (a) and (c) Indicate the band structures and PDOS diagrams of S1 and S2 in AFM state. (b) and (d) Denote the band structures and PDOS diagrams of S1 and S2 in NM state, respectively. | ||
We defined the charge density difference as the difference of charge density of the Fe–Cr alloys system minus the corresponding charge density of the supercell containing only Cr atom, and then deduct the charge density of the system without Cr atom. From Fig. 12 and 13, it can be found that for configurations S1 and S2, there are charge depletion zone near Cr atom in both AFM and NM states, while there are charge aggregation in the region between Fe and Cr, indicating that there is bonding interaction between Fe and Cr atom. In order to further quantify the charge transfer between Fe and Cr atom, Bader charge analysis49 was carried out to evaluate the amount of charge transfer. Tables S1 and S2† show the Bader charge and net charge of Cr and its surrounding Fe atoms before and after doping, respectively. For bulk iron, as shown in Tables S1 and S2,† the charge amount of 32 Fe atoms in both AFM and NM states is 8.000 |e|, and the total charge of the system is 256.000 |e|. According to Pauling electronegativity50 periodic table, electronegativity is a measure of the ability of atoms to attract electrons in compounds, i.e. the more electronegativity an atom is, the better its ability to attract electrons. It is generally believed that polar covalent bonds are formed between atoms of two elements whose electronegativity difference is less than 1.7, and the corresponding compounds are covalent compounds. If Fe is replaced by Cr atom, the electronegativity of Fe and Cr atoms is 1.8 and 1.6, respectively. The difference of electronegativity leads to the loss of electrons in Cr and the gain of electrons in Fe, and the amount of charge transfer in AFM and NM states is different. In Table S1,† Fe atoms around Cr in both AFM and NM states obtain electrons to varying degrees, e.g., Fe2 and Fe10 obtained more electrons in the AFM state, with net charges of 0.052 and 0.049 |e|, respectively. The total charge amount in the whole doping system is 254.000 |e| under the AFM state, and the electron 0.445 |e| of the Cr atom is lost altogether, which indicates that the charge transfer path is Cr → Fe, and the total charge transferred is 0.445 |e|. However, the total number of electrons transferred from Cr to Fe atom in the NM state is 0.468 |e|. The net charge difference between NM and AFM states is 0.023 |e|, which indicates that a stronger polar covalent bond is formed between Fe and Cr in the NM state, which is consistent with the larger Young's modulus of alloy structure in NM state than that in AFM state in Table 1. From Table S2,† for S2, the total number of electrons obtained by Fe is 0.446 and 0.468 |e| respectively in the AFM and NM states, and the net charge difference between NM and AFM is 0.022 |e|, which means that the polar covalent bond between Fe and Cr is stronger in NM state. It is consistent with the previous conclusion of model S1.
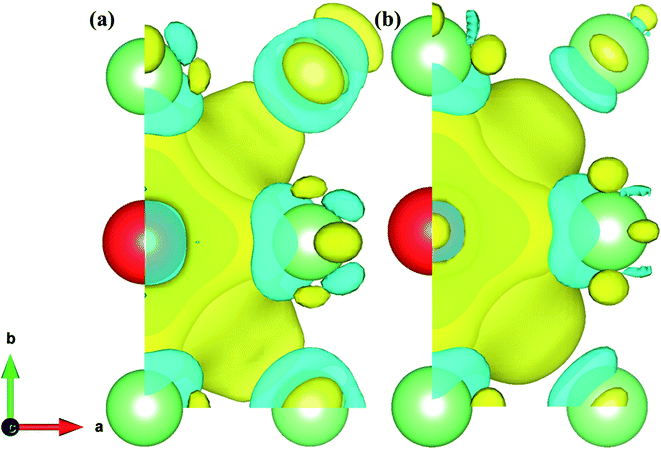 | ||
| Fig. 12 (a) and (b) Represent the charge density difference of S1 in the AFM and NM states. The value of the isosurface is 0.005 e Å−3. | ||
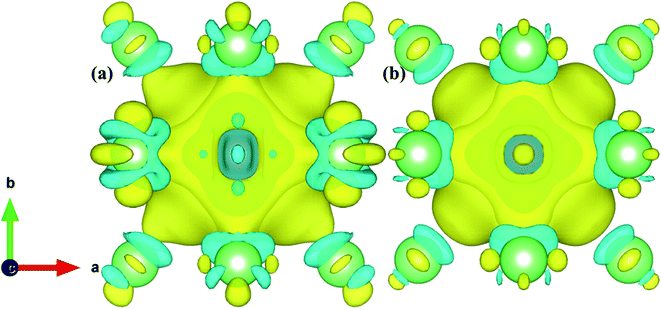 | ||
| Fig. 13 (a) and (b) Represent the charge density difference of S2 in the AFM and NM states. The value of the isosurface is 0.005 e Å−3. | ||
4. Conclusions
We have systematically investigated the stable structural and magnetic state of Fe–Cr alloy, the stability of interstitial He structure, the migration of interstitial He, the electronic properties and its bonding interaction by ab initio first-principles method.The calculated bulk modulus of 284.935 GPa in the NM state is in good agreement with the computed values 282 and 293 GPa obtained by Jiang et al. and Herper et al. However, in the AFM, AFMD and FM states, the bulk modulus calculated by ours are larger or smaller than that computed by others. We employed mechanical stability criterion and lattice dynamics conditions to strictly screen out two stable substitution positions S1 and S2, taking into account the magnetic states of AFM and NM. Compared with bulk γ-Fe, a slightly larger Young's modulus indicates that the doping of Cr helps to enhance the stiffness of the material and the ability to resist the reversible deformation of shear stress, but the ductility decreased slightly. For configurations S1 and S2, the larger G/B ratio [0.457 (0.459)], smaller Poisson's ratio [0.302 (0.301)] and smaller anisotropic factor [2.288 (2.282)] in the AFM state imply that the relative directionality of bonding in Fe–Cr alloys increases, but the ductility and the degree of elastic anisotropy of the material decreases slightly.
Our results revealed that the addition of interstitial He atom promotes the expansion and deformation of the lattice, and further enlarges the cell volume. Compared with bulk iron the substitution of Cr for Fe promotes He migration between octahedral interstitials and hinders He diffusion between tetrahedral interstitials. For the diffusion between tetrahedron and octahedron interstitials, we found two opposite effects of alloy element Cr, i.e., for model S1, the existence of Cr largely hinders the migration of single helium, while for S2, the addition of Cr promotes the diffusion of helium to some extent. For the migration between tetrahedron interstitials, the relative energies of S1 and S2 show two completely different trends, i.e. the relative energies of S1 are all negative, while the relative energies of S2 are almost positive. It can be concluded that in model S1 and its bulk iron, helium atom may realize the diffusion from T1 to T3, but the presence of Cr obstructs the migration of helium from T3 to T4 to some extent. For model S2 and its bulk iron, we found that the presence of Cr atom in the alloy structures greatly restrains the diffusion of a single helium atom, which seems to be trapped in tetrahedral interstitial and cannot escape.
The results of electronic properties show that the alloy materials exhibit obvious metallicity, and the doping of Cr generate an impurity state at lower energy, which is mainly formed by s, p of Fe and s, p shell electrons of Cr. The charge density difference graphs show that there are charge depletion zone near Cr atom in both AFM and NM states, while there are charge aggregation in the region between Fe and Cr, indicating that there is bonding interaction between Fe and Cr atom. Bader charge analysis show that the stronger polar covalent bond is formed between Fe and Cr in the NM state than that in the AFM state.
Conflicts of interest
There are no conflicts to declare.Acknowledgements
This work was supported by a fund from the Science and Technology on Surface Physics and Chemistry Laboratory (No. 02020417).References
- D. Kramer, H. Brager, C. Rhodes and A. J. Pard, J. Nucl. Mater., 1968, 25, 121–131 CrossRef CAS.
- N. Hayashi and T. Takahashi, Appl. Phys. Lett., 1982, 41, 1100–1101 CrossRef CAS.
- Y. Gong, S. Jin, T. Zhu, L. Cheng, X. Cao, L. You, G. Lu, L. Guo and B. Y. Wang, Nucl. Fusion, 2018, 58, 046011 CrossRef.
- X. Sun, F. Chen, H. Huang, J. Lin and X. J. B. Tang, Appl. Surf. Sci., 2019, 467, 1134–1139 CrossRef.
- J. Yu, X. Lin, J. Wang, J. Chen and W. D. Huang, Appl. Surf. Sci., 2009, 255, 9032–9039 CrossRef CAS.
- O. L. Anderson, Geophys. J. Int., 1986, 84, 561–579 CrossRef CAS.
- A. Katanin, A. Belozerov and V. I. Anisimov, Phys. Rev. B, 2016, 94, 161117 CrossRef.
- C. Yoo, J. Akella, A. Campbell, H. Mao and R. J. Hemley, Science, 1995, 270, 1473–1475 CrossRef CAS.
- E. Martínez and C. C. Fu, Phys. Rev. B: Condens. Matter Mater. Phys., 2011, 84, 014203 CrossRef.
- J. Ding, P. Zhang, D. Sun, Y. Wang, S. Huang and J. J. Zhao, J. Nucl. Mater., 2019, 513, 143–151 CrossRef CAS.
- P. Liu, Q. Zhan, W. Han, X. Yi, S. Ohnuki and F. R. Wan, J. Alloys Compd., 2019, 788, 446–452 CrossRef CAS.
- U. Chohan, E. J. Melero and S. P. Koehler, Comput. Mater. Sci., 2018, 153, 57–63 CrossRef CAS.
- H. Herper, E. Hoffmann and P. Entel, Phys. Rev. B: Condens. Matter Mater. Phys., 1999, 60, 3839–3848 CrossRef CAS.
- F. Pinski, J. Staunton, B. Gyorffy, D. D. Johnson and G. M. Stocks, Phys. Rev. Lett., 1986, 56, 2096–2099 CrossRef CAS PubMed.
- C. Wang, B. Klein and H. Krakauer, Phys. Rev. Lett., 1985, 54, 1852–1855 CrossRef CAS PubMed.
- G. Kresse and J. Furthmüller, Phys. Rev. B: Condens. Matter Mater. Phys., 1996, 54, 11169–11186 CrossRef CAS PubMed.
- G. Kresse and J. J. Hafner, J. Phys.: Condens. Matter, 1994, 6, 8245–8257 CrossRef CAS.
- G. Kresse and J. Hafner, Phys. Rev. B: Condens. Matter Mater. Phys., 1993, 47, 558–561 CrossRef CAS PubMed.
- J. P. Perdew, K. Burke and M. Ernzerhof, Phys. Rev. Lett., 1996, 77, 3865–3868 CrossRef CAS PubMed.
- G. Kresse and D. Joubert, Phys. Rev. B: Condens. Matter Mater. Phys., 1999, 59, 1758–1775 CrossRef CAS.
- H. J. Monkhorst and J. D. Pack, Phys. Rev. B: Solid State, 1976, 13, 5188–5192 CrossRef.
- G. Henkelman and H. Jónsson, J. Chem. Phys., 2000, 113, 9978–9985 CrossRef CAS.
- G. Henkelman, B. P. Uberuaga and H. Jónsson, J. Chem. Phys., 2000, 113, 9901–9904 CrossRef CAS.
- M. O. Speidel, Materialwiss. Werkstofftech., 2006, 37, 875–880 CrossRef CAS.
- S. Kappaganthu and Y. Sun, J. Cryst. Growth, 2004, 267, 385–393 CrossRef CAS.
- M. Lei and J. Liang, Surf. Eng., 2010, 26, 305–311 CrossRef CAS.
- N. Mingolo, A. P. Tschiptschin and C. E. Pinedo, Surf. Coat. Technol., 2006, 201, 4215–4218 CrossRef CAS.
- X. Zhang, A. Misra, R. Schulze, C. Wetteland, H. Wang and M. Nastasi, J. Mater. Res., 2004, 19, 1696–1702 CrossRef CAS.
- Z. J. Wu, E. J. Zhao, H. P. Xiang, X. F. Hao, X. J. Liu and J. Meng, Phys. Rev. B: Condens. Matter Mater. Phys., 2007, 76, 054115 CrossRef.
- K. Tanaka, K. Okamoto, H. Inui, Y. Minonishi, M. Yamaguchi and M. Koiwa, Philos. Mag. A, 1996, 73, 1475–1488 CAS.
- L. Zhu, L. Li, T. Cheng and D. S. Xu, J. Mater. Chem. A, 2015, 3, 5449–5456 RSC.
- W. Voigt, Lehrburch der Kristallphysik, 1928 Search PubMed.
- A. Reuss and Z. Angew, Math. Mech, 1929, 9, 49–58 CAS.
- R. Hill, Proc. Phys. Soc., 1952, 65, 349–354 CrossRef.
- D. Jiang and E. A. Carter, Phys. Rev. B: Condens. Matter Mater. Phys., 2003, 67, 214103 CrossRef.
- S. F. Pugh, Philos. Mag., 1954, 45, 823–843 CAS.
- P. Ravindran, L. Fast, P. A. Korzhavyi and B. Johansson, J. Appl. Phys., 1998, 84, 4891–4904 CrossRef CAS.
- I. Frantsevich, F. Voronov and S. Bokuta, Elastic Constants and Elastic Moduli of Metals and Insulators Handbook, Naukova Dumka, Kiev, 1983 Search PubMed.
- Y. Xie, H. T. Yu, T. F. Yi and Y. R. Zhu, ACS Appl. Mater. Interfaces, 2014, 6, 4033–4042 CrossRef CAS PubMed.
- M. Acet, H. Zähres and E. Wassermann, Phys. Rev. B: Condens. Matter Mater. Phys., 1994, 49, 6012–6017 CrossRef CAS PubMed.
- P. Marcus and V. Moruzzi, Phys. Rev. B: Condens. Matter Mater. Phys., 1999, 60, 369–372 CrossRef CAS.
- N. Medvedeva, D. Van Aken and J. E. Medvedeva, J. Phys.: Condens. Matter, 2010, 22, 316002 CrossRef CAS.
- S. Abrahams, L. Guttman and J. S. Kasper, Phys. Rev., 1962, 127, 2052–2055 CrossRef CAS.
- D. Boukhvalov, Y. N. Gornostyrev, M. Katsnelson and A. I. Lichtenstein, Phys. Rev. Lett., 2007, 99, 247205 CrossRef CAS.
- D. Guenzburger and D. E. Ellis, Phys. Rev. B: Condens. Matter Mater. Phys., 1995, 52, 13390–13398 CrossRef CAS.
- E. Khomenko, E. Shalyguina and N. G. Chechenin, J. Magn. Magn. Mater., 2007, 316, 451–453 CrossRef CAS.
- M. Miglierini and I. Škorvánek, Mater. Sci. Eng., A, 1991, 147, 101–106 CrossRef.
- N. Saegusa and A. H. Morrish, Phys. Rev. B: Condens. Matter Mater. Phys., 1982, 26, 305–314 CrossRef CAS.
- W. Tang, E. Sanville and G. Henkelman, J. Phys.: Condens. Matter, 2009, 21, 084204 CrossRef CAS PubMed.
- A. L. Allred, J. Inorg. Nucl. Chem., 1961, 17, 215–221 CrossRef CAS.
- S. C. Abrahams, L. Guttman and J. S. Kasper, Phys. Rev., 1962, 127, 2052–2055 CrossRef CAS.
- N. I. Medvedeva, D. V. Aken and J. E. Medvedeva, J. Phys.: Condens. Matter, 2010, 22, 316002 CrossRef CAS.
- A. A. Katanin, A. S. Belozerov and V. I. Anisimov, Phys. Rev. B, 2018, 98, 045138 CrossRef CAS.
Footnote |
| † Electronic supplementary information (ESI) available. See DOI: 10.1039/c9ra07314k |
| This journal is © The Royal Society of Chemistry 2020 |

