 Open Access Article
Creative Commons Attribution 3.0 Unported Licence
Chitosan-derived N-doped carbon catalysts with a metallic core for the oxidative dehydrogenation of NH–NH bonds†
Priyanka Raju Thombal ,
Raju S. Thombal
 and
Sung Soo Han
 *
*
School of Chemical Engineering, Yeungnam University, 280 Daehak-Ro, Gyeongsan, Gyeongbuk 38541, Republic of South Korea. E-mail: sshan@yu.ac.kr; Fax: +82-53-810-4686; Tel: +82-53-810-2773
First published on 2nd January 2020
Abstract
Sustainable metal-encased (Ni–Co/Fe/Cu)@N-doped-C catalysts were prepared from bio-waste and used for the oxidative dehydrogenation reaction. A unique combination of bimetals, in situ N doping, and porous carbon surfaces resulted in the formation of the effective “three-in-one” catalysts. These N-doped graphene-like carbon shells with bimetals were synthesized via the complexation of metal salts with chitosan and the subsequent pyrolysis at 700 °C. A well-developed thin-layer structure with large lateral dimensions could be obtained by using Ni–Fe as the precursor. Importantly, the Ni–Fe@N-doped-C catalyst was found to be superior for the dehydrogenation of hydrazobenzene under additive/oxidant-free conditions compared to the conventional and other synthesized catalysts. Characterizations by TEM and XPS accompanied by BET analysis revealed that the enhanced catalytic properties of the catalysts arose from their bimetals and could be attributed to the graphitic shell structure and graphitic N species, respectively.
Introduction
In the past decades, heterogeneous catalysts, including monometallic- and bimetallic-supported catalysts, have been widely utilized for numerous applications. Such catalysts often show distinct electronic and chemical properties from those of their parent metals, which offers the opportunity to obtain new catalysts with enhanced robustness. In 1960, for the first time, bimetallic catalysts started to gain considerable commercial interest for their use in hydrocarbon reforming due to their superior activities, which were unlike those of the monometallic catalysts.1–3 These unexpected properties of bimetallic catalysts have inspired many researchers to find suitable applications. Recently, bimetallic catalysts have been widely utilized in many catalytic4 and electrocatalytic applications.5,6Heteroatom-doped carbon materials bearing metals have emerged as promising and cost-effective alternatives for promoting organic reactions. These carbon materials can be synthesized by the pyrolysis of glucose, cellulose, β-cyclodextrin, and other biomass-derived supports.7–11 Due to their unique properties, such as high graphitized carbon, uniformly doped heteroatoms, and porous structures, such catalysts have been explored for a series of organic transformations including hydrogenation, oxidation, and acid/base-catalyzed reactions.12–15 However, the pyrolysis step involved in the preparation of carbocatalysts usually leads to the fusion of carbon nanoparticles, and this resulting aggregation blocks the tunnels of mass transfer and limits active site exposure.16,17 Moreover, obtaining well-graphitized carbon with efficient dopants is hard to achieve in practice.18 Therefore, it is important to precisely optimize the synergistically active metal sites and N-doped porous structures simultaneously over carbon-based catalysts for better exposure in dehydrogenation reactions.19–21
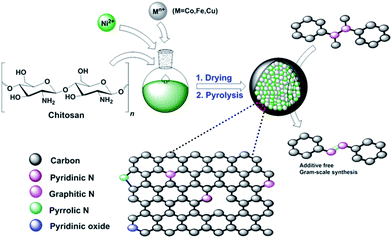
In 2010, Titirici and coworkers described the hydrothermal treatment of chitosan, followed by calcination, for the preparation of carbonaceous materials.22 Later, it was shown that chitosan could serve as an excellent precursor to generate N-doped graphene.23,24 Importantly, these biomass-derived products are inexpensive, sustainable, biodegradable, and non-toxic. Chitosan is mostly obtained from bio-waste generated from fishery plants, and it includes shrimp or crab shell-derived chitin.25 In this regard, the synthesis of ruthenium-cobalt nanoalloys encapsulated in nitrogen-doped graphene from the nanotubes of the Co3[Co(CN)6]2 precursor has been reported by Chen and coworkers.26 Based on the aforementioned efforts and our previous work,27 we became interested in preparing novel core–shell N-doped carbon materials with bimetallic nanocomposites as the catalyst. Herein, we report a straightforward synthesis of novel (Ni–M)@N-doped-C (M = Co, Fe, Cu) catalysts by a combination of non-precious transition metals with chitosan and subsequent pyrolysis (Scheme 1). Although the preparation of a carbonaceous monometallic cobalt catalyst from chitosan has already been reported,28 to the best of our knowledge, the synthesis of nickel-based bimetallic catalysts from chitosan has not been reported. It is noteworthy that due to the synergetic effect of the metal nanocomposites and N-doped carbon coating of these materials, they can be used as efficient bimetallic carbocatalysts in the oxidative dehydrogenation of NH–NH bonds.
Experimental
Materials and characterization
Chitosan, hydrazobenzene, NiCl2·6H2O, CoCl2·2H2O, FeCl3, CuCl2·2H2O, and solvents were purchased from Sigma Aldrich. All the chemicals were reagent grade and used as received without any purification. The synthesized catalysts were characterized using several extensive techniques. Scanning electron microscopy (SEM) images of all the catalysts were obtained on Hitachi S4600 equipped with an energy dispersive X-ray microanalysis (EDAX) detector. The wide-range X-ray diffraction (XRD) patterns were recorded on Panalytical X'Pert pro MPD using Cu-Kα radiation. The catalysts were scanned from 10 to 90° at a rate of 5° min−1. Raman spectra were obtained on a Horiba scientific Raman spectrometer system using a 532 nm wavelength laser. X-ray photoelectron spectroscopy (XPS) was conducted on a Thermo Fisher Scientific K-Alpha system. The specific surface area and the pore-size distributions were determined using Brunauer–Emmett–Teller (BET) nitrogen adsorption–desorption isotherms and the Barrett–Joyner–Halenda (BJH) method, respectively, with a Micromeritics 3-Flex surface characterization analyzer at 77 K. Transmission electron microscopy (TEM) images were acquired on an FEI Tecnai (F20 instrument) high-resolution microscope. The concentrations of the metal species were determined by inductively coupled plasma atomic emission spectrometry (ICP-AES) on a Perkin-Elmer Optima 8300 system.Catalyst preparation
The chitosan-based bimetallic materials were synthesized according to the following procedure: in a 500 mL round-bottomed flask provided with a magnetic stir bar, 1.5 gm of chitosan was suspended in 100 mL of water. Next, we added 250 mg (1![[thin space (1/6-em)]](https://www.rsc.org/images/entities/char_2009.gif) :
:![[thin space (1/6-em)]](https://www.rsc.org/images/entities/char_2009.gif) 1) of each NiCl2·6H2O and metal precursors (Co/Fe/Cu) into the above suspension solution. The pH was maintained around 9 by adding 25% aqueous ammonia solution and the mixture was stirred continuously for 24 h. Hereafter, the obtained solid was repeatedly washed with water to remove excess impurities and reactants. The solid was then separated by a centrifugation process (500 rpm, 5 min) and dried in vacuum at 60 °C overnight. Later, the dried sample was transferred into a tubular furnace for pyrolysis. The furnace was then flushed with argon and the sample was heated to 700 °C at a temperature gradient of 25 °C min−1 and the same temperature was held for 2 h. After that, the furnace was cooled down to room temperature. Argon was purged through the furnace constantly during the whole process. The obtained black material was washed with water and ethanol to remove impurities. The catalysts named as Ni–M@N-doped-C (M = Co/Fe/Cu) were obtained after drying the samples at 60 °C in an oven and then storing in a screw-capped vial at room temperature. For the preparation of the monometallic catalysts, the same procedure was followed using single metal precursors.
1) of each NiCl2·6H2O and metal precursors (Co/Fe/Cu) into the above suspension solution. The pH was maintained around 9 by adding 25% aqueous ammonia solution and the mixture was stirred continuously for 24 h. Hereafter, the obtained solid was repeatedly washed with water to remove excess impurities and reactants. The solid was then separated by a centrifugation process (500 rpm, 5 min) and dried in vacuum at 60 °C overnight. Later, the dried sample was transferred into a tubular furnace for pyrolysis. The furnace was then flushed with argon and the sample was heated to 700 °C at a temperature gradient of 25 °C min−1 and the same temperature was held for 2 h. After that, the furnace was cooled down to room temperature. Argon was purged through the furnace constantly during the whole process. The obtained black material was washed with water and ethanol to remove impurities. The catalysts named as Ni–M@N-doped-C (M = Co/Fe/Cu) were obtained after drying the samples at 60 °C in an oven and then storing in a screw-capped vial at room temperature. For the preparation of the monometallic catalysts, the same procedure was followed using single metal precursors.
Synthesis of azobenzene over the Ni–Fe@N-doped-C catalyst
Typically, calculated amounts of hydrazobenzene (1 mmol) and Ni–Fe@N-doped-C (5 wt%) in ethanol (3 mL) were placed in a 10 mL glass vial, and K2CO3 (1 mmol) was added to the mixture under an air atmosphere with magnetic stirring to initiate the reaction at 30 °C for 12 h. After the reaction was completed, the catalyst was separated using an external magnet and the crude mass was subjected to column chromatography. After each cycle, the catalyst was isolated from the solution by an external magnet, washed three times with water and acetone, dried under vacuum to remove the residual solvent, and then reused for another reaction cycle.Results and discussion
Properties of the Ni–M@N-doped-C catalysts
The surface morphology of the chitosan-derived bimetallic catalysts was initially probed by SEM. Fig. 1 exhibits the typical SEM images of the Ni–Co@N-doped-C, Ni–Fe@N-doped-C, and Ni–Cu@N-doped-C catalysts with different scale bars. The images show that the catalysts have an irregular particle-like structure and metal nanocomposites are equally embedded in the carbon structure. The core–shell morphology is clearly distinct in all the catalysts. The EDS results are shown in Fig. S1(a–c),† which provide the elemental distributions of the catalysts. A uniformly dispersed nature of both metals (Ni and Co/Cu/Fe) in all three pyrolyzed catalysts was observed.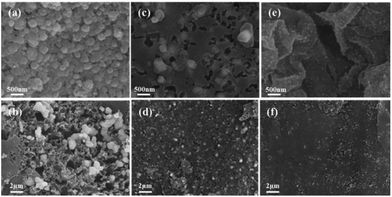 | ||
| Fig. 1 FE-SEM images of the CS-bimetallic nanocomposites: Ni–Co@N-doped-C (a and b), Ni–Fe@N-doped-C (c and d), and Ni–Cu@N-doped-C (e and f). | ||
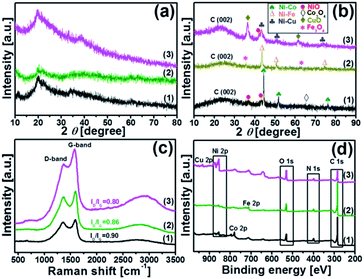
XRD analysis was carried out to understand the structure of the synthesized catalysts. Fig. 2(a and b) illustrate the XRD patterns of the chitosan-bimetallic catalysts before and after pyrolysis. Before pyrolysis, the XRD patterns exhibit a broad characteristic peak at 2θ = 20°, which belongs to chitosan. Peaks pertaining to the metal nanocomposites were not clearly observed in these patterns, which was possibly due to the low concentration of metals.29 After pyrolysis, the peak observed for chitosan at 2θ = 20° became weak, resulting in a new diffraction peak at 18–30° corresponding to the (002) plane of graphitic carbon.30 This transition of peaks suggests the decomposition of chitosan along with the conversion of carbon-rich biomass into graphitic carbon nanostructures in all the catalysts. Since nickel, copper, cobalt, and iron are neighbors in the periodic table, they have very close lattice parameters and apparently close standard identification peaks in the XRD database.31 The Ni–Co@N-doped-C catalyst shows diffraction peaks at 44.40°, 51.67°, and 76.08°; these are ascribed to the face-centered cubic structure of the Ni–Co alloy (PDF#01-074-5694), which can be indexed to the (111), (200), and (220) crystalline reflections, respectively. Additionally, the peaks with very less intensity observed at 37.10° and 43.30° can be ascribed to the NiO phase (PDF#00-047-1049) and the peak at 64.70° is ascribed to the Co3O4 phase (PDF#01-073-1701). The Ni–Fe@N-doped-C catalyst shows peaks at the 2θ values of 43.30°, 50.58°, and 74.45°, which are assigned to the face-centered cubic and monoclinic phases of the Ni–Fe crystallographic structure (PDF# 00-023-0297). On the other hand, the diffraction peaks at 35.63° and 62.88° can be indexed to the cubic phase crystallographic structure of Fe3O4 (PDF# 01-086-1344). As for the bimetallic catalyst Ni–Cu@N-doped-C, the diffraction peaks at 2θ of 43.46°, 50.58°, and 74.30° indicate the presence of a face-centered cubic structure of the Ni–Cu alloy (PDF# 00-047-1406). Along with this, the peaks at 36.38° and 61.52° confirm the CuO (PDF# 01-073-6023) phase, whereas a peak at 42.03° is obtained due to the NiO phase.32,33 The peaks observed in the XRD patterns confirmed the presence of metals/metal oxides in the synthesized monometallic Ni@N-doped-C and Fe@N-doped-C catalysts (for further details, see Fig. S2†).
Fig. 2c shows a typical Raman spectrum, which can be used to probe the graphitic carbon formation in the catalysts. All the three spectra of the synthesized catalysts consist of two prominent peaks at ∼1356 cm−1 for the D band and 1592 cm−1 for the G band, along with a wide band extending from about 2900 cm−1 due to the combination modes of the D and G bands. The D band indicates a defect-induced non-perfect crystalline structure, while the G band shows an in-plane vibration of the sp2 carbon atoms.34 The values of the intensity ratio ID/IG of different catalysts followed the sequence Ni–Co@N-doped-C (0.90) > Ni–Fe@N-doped-C (0.86) > Ni–Cu@N-doped-C (0.80). Herein, the first two catalysts presented a relatively high ID/IG value; this indicates the presence of abundant defects in the graphitic network of the catalyst, which can mostly affect the catalytic performance.
X-ray photoelectron spectroscopy (XPS) was carried out to determine the surface valence states of the characteristic elements in the synthesized bimetallic catalysts (Fig. 2d). The high-resolution XPS scans of the C 1s, O 1s, N 1s, Ni 2p, and Co 2p/Fe 2p/Cu 2p regions with curve-fitting spectra for the synthesized Ni–Co@N-doped-C, Ni–Fe@N-doped-C, and Ni–Cu@N-doped-C catalysts are illustrated in Fig. 3. The deconvoluted C 1s spectrum (Fig. 3a) of the three catalysts contains four peaks at different B.E. values. The C 1s peaks at B.E. of 283.5–284.5, 284.7–285.2, 286.1–287.0 and 288.6–289.7 eV are assigned to carbon atoms in the forms of C![[double bond, length as m-dash]](https://www.rsc.org/images/entities/char_e001.gif) C, C
C, C![[double bond, length as m-dash]](https://www.rsc.org/images/entities/char_e001.gif) N, C–O/C–N, and O–C
N, C–O/C–N, and O–C![[double bond, length as m-dash]](https://www.rsc.org/images/entities/char_e001.gif) O, respectively. The eminent peaks at B.E. of 283.5–284.5 eV indicate that most carbons in the bimetallic catalysts are aromatic, which coincides with the graphitic structure observed in the XRD patterns (Fig. 2b). The O 1s spectra of these three catalysts are shown in Fig. 3b and all of them contain four peaks regarding the various O functionalities; among these, the peaks at B.E. of 528.9–530.0 eV correspond to the lattice oxygen involved in the metal framework, such as Ni–O or Co–O/Fe–O/Cu–O bonds. The peaks at B.E. of 530.5–531.2 eV are assigned to C
O, respectively. The eminent peaks at B.E. of 283.5–284.5 eV indicate that most carbons in the bimetallic catalysts are aromatic, which coincides with the graphitic structure observed in the XRD patterns (Fig. 2b). The O 1s spectra of these three catalysts are shown in Fig. 3b and all of them contain four peaks regarding the various O functionalities; among these, the peaks at B.E. of 528.9–530.0 eV correspond to the lattice oxygen involved in the metal framework, such as Ni–O or Co–O/Fe–O/Cu–O bonds. The peaks at B.E. of 530.5–531.2 eV are assigned to C![[double bond, length as m-dash]](https://www.rsc.org/images/entities/char_e001.gif) O, while the peaks at B.E. of 531.1–533.3 eV correspond to the O–C–O bonds. At B.E. of 533.0–535.9 eV, peaks with lower intensities are obtained, which are ascribed to the O–C
O, while the peaks at B.E. of 531.1–533.3 eV correspond to the O–C–O bonds. At B.E. of 533.0–535.9 eV, peaks with lower intensities are obtained, which are ascribed to the O–C![[double bond, length as m-dash]](https://www.rsc.org/images/entities/char_e001.gif) O species in the catalysts. The N 1s spectrum (Fig. 3c) of the three catalysts comprises four deconvoluted peaks at different B.E. values. The peaks in the range of 398.0–398.4, 399.6–400.5, 400.7–402 and 401.4–405.8 eV can be attributed to pyridinic N, pyrrolic N, graphitic N, and pyridinic N-oxides, respectively.35 It could be clearly observed that pyridinic N and pyrrolic N were the dominant phases in all three catalysts. The second highest intensity was analyzed for the graphitic N moieties, while N-oxides were detected as minor components in all three catalysts. In the Ni 2p spectrum (Fig. 3d) of these three representative catalysts, the deconvoluted peaks at B.E. values in the range of 851.5–858.0 eV are due to Ni 2p3/2 and the peaks at 869.7–875.8 eV are due to Ni 2p1/2. The peaks located at 853.5–872.2 eV can be ascribed to metallic Ni, whereas the peaks obtained in the range of 861.1–879.7 eV are the satellite peaks of Ni2+.36 The high-resolution spectra of Co 2p, Fe 2p, and Cu 2p of the Ni–Co@N-doped-C, Ni–Fe@N-doped-C, and Ni–Cu@N-doped-C catalysts are presented in Fig. 3e. In the Co 2p spectra, the characteristic Co 2p3/2 and Co 2p1/2 peaks associated with spin–orbit splitting are observed. The peaks obtained at the B.E. values of 779.8 and 795.4 eV are ascribed to Co3+, while the peaks at 782.2 and 797.2 eV are attributed to Co2+. The binding energy of the Co 2p peaks in the range of 778.9–794.2 eV indicates the existence of metallic Co in the catalysts, whereas the satellite peaks of Co2+ are located in the range of 785.9–802.7 eV. This study of the Co 2p spectra of the catalyst disclosed the presence of metallic Co, Co3+, and Co2+ species, which affirmed the results from the XRD study. The deconvoluted spectrum of Fe 2p shows the first peak at 706.8 eV, corresponding to the presence of metallic Fe. Other prominent peaks at the binding energies of 710.3 (Fe 2p3/2) and 723.7 (Fe 2p1/2) eV account for the presence of Fe2+, whereas the peaks at the binding energy values of 712.3 and 725.8 eV are assigned to the Fe3+ species. The curve-fitting result of Cu 2p is depicted in Fig. 3e. The Cu 2p3/2 and Cu 2p1/2 peaks located at 932.0 and 952.1 eV can be due to metallic Cu, while the peak centered at 933.3 eV corresponds to Cu+. The binding energies of the peaks observed at 934.7 and 953.4 eV and the shakeup satellites at the B.E. values of 941.0–943.0 and 962.0 eV indicate the presence of the Cu2+ species on the catalyst surface.37–39 As evidenced by the XPS study, the synthesized catalysts contained metallic Ni–Co/Fe/Cu along with their oxides. The N species contents that play a vital role in the catalytic reactions are shown in Fig. 3f.
O species in the catalysts. The N 1s spectrum (Fig. 3c) of the three catalysts comprises four deconvoluted peaks at different B.E. values. The peaks in the range of 398.0–398.4, 399.6–400.5, 400.7–402 and 401.4–405.8 eV can be attributed to pyridinic N, pyrrolic N, graphitic N, and pyridinic N-oxides, respectively.35 It could be clearly observed that pyridinic N and pyrrolic N were the dominant phases in all three catalysts. The second highest intensity was analyzed for the graphitic N moieties, while N-oxides were detected as minor components in all three catalysts. In the Ni 2p spectrum (Fig. 3d) of these three representative catalysts, the deconvoluted peaks at B.E. values in the range of 851.5–858.0 eV are due to Ni 2p3/2 and the peaks at 869.7–875.8 eV are due to Ni 2p1/2. The peaks located at 853.5–872.2 eV can be ascribed to metallic Ni, whereas the peaks obtained in the range of 861.1–879.7 eV are the satellite peaks of Ni2+.36 The high-resolution spectra of Co 2p, Fe 2p, and Cu 2p of the Ni–Co@N-doped-C, Ni–Fe@N-doped-C, and Ni–Cu@N-doped-C catalysts are presented in Fig. 3e. In the Co 2p spectra, the characteristic Co 2p3/2 and Co 2p1/2 peaks associated with spin–orbit splitting are observed. The peaks obtained at the B.E. values of 779.8 and 795.4 eV are ascribed to Co3+, while the peaks at 782.2 and 797.2 eV are attributed to Co2+. The binding energy of the Co 2p peaks in the range of 778.9–794.2 eV indicates the existence of metallic Co in the catalysts, whereas the satellite peaks of Co2+ are located in the range of 785.9–802.7 eV. This study of the Co 2p spectra of the catalyst disclosed the presence of metallic Co, Co3+, and Co2+ species, which affirmed the results from the XRD study. The deconvoluted spectrum of Fe 2p shows the first peak at 706.8 eV, corresponding to the presence of metallic Fe. Other prominent peaks at the binding energies of 710.3 (Fe 2p3/2) and 723.7 (Fe 2p1/2) eV account for the presence of Fe2+, whereas the peaks at the binding energy values of 712.3 and 725.8 eV are assigned to the Fe3+ species. The curve-fitting result of Cu 2p is depicted in Fig. 3e. The Cu 2p3/2 and Cu 2p1/2 peaks located at 932.0 and 952.1 eV can be due to metallic Cu, while the peak centered at 933.3 eV corresponds to Cu+. The binding energies of the peaks observed at 934.7 and 953.4 eV and the shakeup satellites at the B.E. values of 941.0–943.0 and 962.0 eV indicate the presence of the Cu2+ species on the catalyst surface.37–39 As evidenced by the XPS study, the synthesized catalysts contained metallic Ni–Co/Fe/Cu along with their oxides. The N species contents that play a vital role in the catalytic reactions are shown in Fig. 3f.
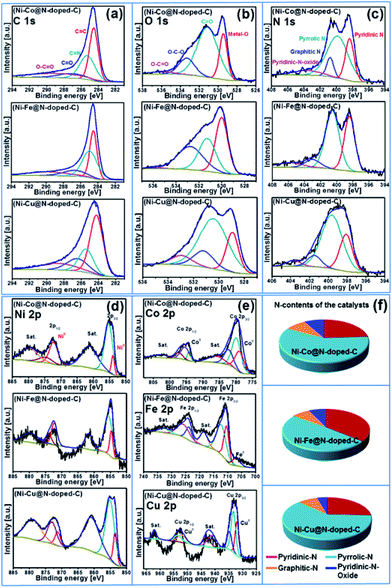 | ||
| Fig. 3 XPS spectra of (a) C 1s, (b) O 1s, (c) N 1s (d) Ni 2p, (e) Co 2p/Fe 2p/Cu 2p for the Ni–Co@N-doped-C, Ni–Fe@N-doped-C, and Ni–Cu@N-doped-C catalysts; (f) nitrogen contents of the catalysts. | ||
The N2 adsorption–desorption isotherms, surface area, pore-size distribution, and pore-volume curves of the Ni–Co@N-doped-C, Ni–Fe@N-doped-C, and Ni–Cu@N-doped-C catalysts were probed by BET measurements to substantiate the presence of mesopores in the catalysts (Fig. S3†). All the nanocomposites manifested typical type IV isotherms with an H3 hysteresis loop, which confirmed the presence of a mesoporous structure. The BJH pore-size distributions of the catalysts validated the existence of well-developed mesoporous structures of the chitosan-derived bimetallic catalysts. The BET surface area (SBET), pore volume (Vpore), and average pore diameter (ADpore) of the catalysts are shown in Table 1. The values displayed that the Ni–Fe@N-doped-C catalyst possessed the highest BET surface area (176.96 m2 g−1) and the largest pore volume (0.2441 cm3 g−1). All three catalysts displayed both narrow pore-size distributions centered at around ∼3.4–3.7 nm and broad pore-size distributions at around >10 nm. However, Ni–Fe@N-doped-C possessed a higher number of small and large pores compared to the other two catalysts, which apparently led to the high surface area and pore volume.40
| Catalyst | SBET (m2 g−1) | Vpore (cm3 g−1) | ADpore (nm) |
|---|---|---|---|
| Ni–Co@N-doped-C | 170.05 | 0.1629 | 12.6214 |
| Ni–Fe@N-doped-C | 176.96 | 0.2441 | 20.0551 |
| Ni–Cu@N-doped-C | 8.34 | 0.0134 | 10.2482 |
By accumulating the results from SEM and BET, the micro-structure of the synthesized catalyst was characterized by TEM analysis. The TEM and HR-TEM images of the Ni–Fe@N-doped-C catalyst (Fig. 4) show similar results to the morphologies observed in the SEM images (Fig. 1c and d). As revealed in the TEM study (Fig. 4a and b), the Ni–Fe bimetallic nanocomposites with irregular particles with a mean diameter of ∼52 nm were enclosed by N-doped carbon layers. The least number of hollow carbon spheres were also observed in the catalyst originating from the high-temperature carbonization process.41 Fig. 4c and d show the high-resolution TEM images centered on a single nanocomposite, where the crystal fringes of the core–shell are clearly seen with the d-spacings of 0.208 and 0.305 nm; these are in accordance with the (111) and (002) planes of the face-centered cubic (fcc) structure of metals (Ni/Fe) and graphitic carbon material, respectively. Mostly, carbon coatings with layers ∼6–11 along with ∼13–21 thick layers existed, and they were effective sites for the oxidation reaction. The acquired EDAX (Fig. 4e) analysis confirmed the presence of the C, N, O, Ni, and Fe elements in the synthesized nanocomposites. Besides, the images of elemental mapping from TEM show that C, Fe, N, and Ni (Fig. 4f–i) are homogenously distributed on the catalyst. From the inductively coupled plasma atomic emission spectrometry (ICP-AES) analysis of the Ni–Fe@N-doped-C catalyst, the concentrations of the Ni and Fe metals were found to be 12.99 wt% and 18.41 wt%, respectively.
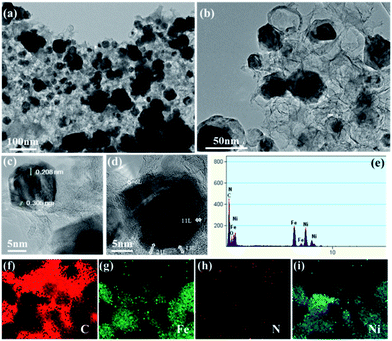 | ||
| Fig. 4 (a and b) TEM images; (c and d) HR-TEM images; (e) EDAX; (f–i) elemental mapping of C, Fe, N, and Ni of the Ni–Fe@N-doped-C catalyst, respectively. | ||
Catalytic activity of the synthesized bimetallic catalysts ((Ni–Co/Fe/Cu)@N-doped-C)
The synthesized bimetallic catalysts were tested for the oxidative dehydrogenation of hydrazobenzene to azobenzene (Table 2). To obtain the best optimized conditions, the reactions of hydrazobenzene were carried out in the presence of the three synthesized catalysts (10 wt%) in EtOH at room temperature under an open-air atmosphere (entries 1–3). The Ni–Fe@N-doped-C catalyst provided the highest yield (67%) over the other Ni–Cu@N-doped-C and Ni–Co@N-doped-C catalysts possibly due to its greater surface area and good pore-size distribution. On increasing the reaction temperature to 80 °C, the yield of azobenzene did not improve, and 20% of hydrazobenzene remained unreacted (entry 4). Importantly, decreasing the amount of Ni–Fe@N-doped-C to 5 wt% sufficiently produced a higher yield (entry 6, 69%). On the other hand, upon increasing the amount of the catalyst to 20 wt%, azobenzene was produced in a slightly lower yield (entry 5). The reactions using the monometallic Ni@N-doped-C and Fe@N-doped-C catalysts did not improve the yield of azobenzene (entries 7–8). Moreover, the reaction using 10 wt% of commercially available chitosan (CS) did not produce the azobenzene product at all due to the absence of either carbon surfaces or metal ions, which are responsible for the dehydrogenation reaction (entry 9). Additionally, reactions with other carbon-based catalysts were performed to get better insights into the reaction parameters (entries 10–12). The reaction in the presence of graphite flakes, activated carbon, and carbon nanotubes (CNT) produced azobenzene in lower yields, suggesting an important role of the metal ions in this reaction.| Entry | Catalyst | Temp [°C] | Recovered hydrazobenzene [%] | Azobenzene yield [%] |
|---|---|---|---|---|
| a Reaction conditions: 1 mmol hydrazobenzene, 10 wt% catalyst, 3 mL EtOH, 30 °C for 12 h under open air.b 20 wt% of catalyst was used.c 5 wt% of catalyst was used. CS = chitosan, CNT = carbon nanotubes. | ||||
| 1 | Ni–Co@N-doped-C | 30 | 40 | 51 |
| 2 | Ni–Cu@N-doped-C | 30 | 38 | 49 |
| 3 | Ni–Fe@N-doped-C | 30 | 25 | 67 |
| 4 | Ni–Fe@N-doped-C | 80 | 20 | 63 |
| 5b | Ni–Fe@N-doped-C | 30 | 15 | 66 |
| 6c | Ni–Fe@N-doped-C | 30 | 19 | 69 |
| 7c | Ni@N-doped-C | 30 | 39 | 41 |
| 8c | Fe@N-doped-C | 30 | 45 | 33 |
| 9 | CS | 30 | 99 | 00 |
| 10 | Flake graphite | 30 | 51 | 31 |
| 11 | Activated carbon | 30 | 45 | 46 |
| 12 | CNT | 30 | 67 | 30 |
Furthermore, the effects of solvents and bases were studied using 5 wt% Ni–Fe@N-doped-C at room temperature (Table 3). The reaction of hydrazobenzene in different solvents produced azobenzene in 15–50% yields. Among these, PEG-400, ethylene glycol, THF, and t-BuOH were better solvents (entries 3–4, 6–7). However, azobenzene was produced in lower yields when other solvents such as γ-valerolactone (GVL), H2O, CH3CN, and DCM were used (entries 1–2, 5, and 8). Interestingly, the addition of a base dramatically increased the yield (entries 9–11). The addition of 1 eq. of bases such as t-BuOK, K2CO3, or CS2CO3 afforded azobenzene in higher yields (72–99%); in particular, K2CO3 provided a quantitative yield with 100% selectivity and conversion of hydrazobenzene (entry 10). To verify the role of air in this reaction, when the reaction was carried out under a nitrogen atmosphere, the yield of azobenzene decreased to 56% (entry 12). This result revealed the importance of air as oxygen from the air is responsible for aerobic oxidation. In this context, Gozin and coworkers previously reported the oxidative dehydrogenation reaction using H2O2 as an external oxidant.19
| Entry | Solvent | Base [eq.] | Recovered hydrazobenzene [%] | Azobenzene yield [%] |
|---|---|---|---|---|
| a Reaction conditions: 1 mmol hydrazobenzene, 5 wt% Ni–Fe@N-doped-C, 3 mL solvent, base, 30 °C for 12 h under open air.b Under N2 atmosphere. | ||||
| 1 | GVL | None | 51 | 35 |
| 2 | H2O | None | 60 | 26 |
| 3 | PEG-400 | None | 41 | 50 |
| 4 | Ethylene glycol | None | 38 | 49 |
| 5 | CH3CN | None | 55 | 39 |
| 6 | THF | None | 43 | 49 |
| 7 | t-BuOH | None | 45 | 42 |
| 8 | DCM | None | 68 | 15 |
| 9 | EtOH | t-BuOK (1) | 21 | 72 |
| 10 | EtOH | K2CO3 (1) | 00 | 99 |
| 11 | EtOH | CS2CO3 (1) | 11 | 81 |
| 12b | EtOH | K2CO3 (1) | 38 | 56 |
Moreover, the oxidative dehydrogenation reactions of different hydrazobenzenes were further investigated with 5 wt% Ni–Fe@N-doped-C catalyst under optimal conditions and the obtained data are listed in Table 4. It was found that all the electron-donating or electron-withdrawing group-bearing hydrazobenzenes could be efficiently transformed to azobenzenes with excellent selectivity and yields (entries 1–6).
To demonstrate the large-scale applicability, we carried out a gram-scale reaction of hydrazobenzene and obtained 1.66 g of azobenzene in a 91% yield (for details, see ESI, Fig. S4†). The recycling experiments of the Ni–Fe@N-doped-C catalyst were also studied. The reaction was performed under optimized reaction conditions (1 mmol scale). After completing the reaction, the catalyst was magnetically separated from the reaction mixture (Fig. S4†) and washed with water and acetone 3–4 times. The collected catalyst was further dried at 60 °C for 24 h. The spent catalyst was used for the next cycle under optimized reaction conditions. The catalyst could be recycled in seven successive runs, sustaining the selectivity of the reactant and the yield of azobenzene. Only a little decrease in the conversion of hydrazobenzene from 99% to 95% was observed upon the seventh reuse (Scheme 2a). After the seventh recycle, the SEM image of Ni–Fe@N-doped-C shows no significant change in the morphology and structure (Scheme 2b). The metal concentration in the reused Ni–Fe@N-doped-C catalyst was found to be 10.29 wt% for Ni and 14.62 wt% for Fe by ICP-AES analysis.
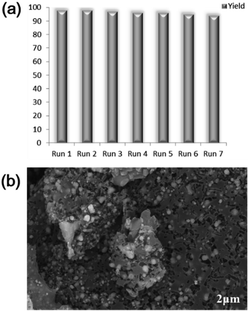 | ||
| Scheme 2 (a) Reusability of Ni–Fe@N-doped-C; (b) SEM image of reused Ni–Fe@N-doped-C after the 7th run. | ||
The efficiency of the synthesized catalyst was studied by comparing it with previously reported catalysts. In this context, Drug et al. reported the oxidation reaction of hydrazobenzene by using a TiCl3/HBr catalytic system (Table 5, entry 1),19 whereas Sahoo et al. reported the dual transition-metal-catalysed synthesis of azobenzene (entry 2).20 In addition, the report by Du et al. showed the electrochemical dehydrogenation of hydrazine compounds using a Pt electrode (entry 3).42 In another report, reduced graphene oxide was utilized for the dehydrogenation reaction (entry 4).43 However, these methods have certain limitations, such as toxicity, non-reusability, the use of noble metals or additives, and high catalyst loading. In this study, the catalytic activity of the reusable Ni–Fe@N-doped-C catalyst was proven to be better than that of previously reported catalysts.
Reaction mechanism
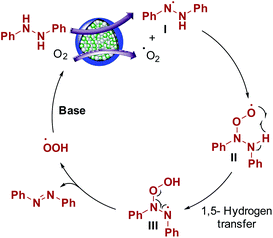
Aerobic oxidation reactions involve the generation of radicals over carbon catalysts.44,45 Wen, Su, and coworkers have reported alkene radical generation over a carbon catalyst under aerobic conditions.46 According to our observations and previous reports, we assumed that the reaction mechanism proceeded through the formation of radicals and proposed the possible reaction mechanism (Scheme 3). Hydrazobenzene was activated on the graphitic layer surface to form nitrogen radicals (I), and O2 was activated on the carbon adjacent to graphitic N. The electron transfer from adjacent carbon atoms to O2 to form O2 radical was possible due to graphitic N atoms and metallic species.44,47 Then, these two radicals interacted with each other to form a peroxy radical intermediate II and the subsequent radical transfer on to the adjacent nitrogen generated another radical intermediate III. Finally, deoxygenation occurred to form azobenzene as the final product with the elimination of a peroxy radical. Finally, in the presence of a base, the peroxy radical was converted to O2 to complete the catalytic cycle. In general, the graphitic layered structure, N-species, bimetals, and base are equally critical for this transformation.Conclusions
Environmentally friendly and sustainable bimetallic Ni–M (M = Co/Fe/Cu) nanocomposites encased by N-doped mesoporous carbons using naturally renewable bio-waste (chitosan) were introduced. The synthesized catalysts were composed of mixed phases of metallic, metal oxide, and N-doped carbon layers. The Ni–Fe@N-doped-C catalyst possessed a large surface areawith mesoporous structure and exhibited good catalytic activity in the dehydrogenation of hydrazobenzene reactions compared with the conventional catalysts. When Ni–Fe@N-doped-C was the paragon catalyst, a high yield of azobenzene (99%) could be obtained in EtOH as a solvent. The catalyst was reused for seven cycles without a prominent loss of catalytic activity. The research hence emphasizes a new aspect for the synthesis of non-noble metal-based N-doped carbon catalysts and their application in the large-scale dehydrogenation of hydrazobenzene.Conflicts of interest
There are no conflicts to declare.Acknowledgements
This work is supported by the National Research Foundation of Korea (NRF) funded by the Ministry of Science and Technology (NRF-2017R1D1A3B03031234). This research is supported by the Yeungnam University Research Grant (2019).Notes and references
- J. H. Sinfelt, Acc. Chem. Res., 1977, 10, 15–20 CrossRef CAS.
- J. H. Sinfelt, Bimetallic Catalysts: Discoveries, Concepts, and Applications, John Wiley and Sons, New York, 1983 Search PubMed.
- J. H. Sinfelt, A. E. Barnett, and G. W. Dembinski, US pat., US3442973, 1969.
- C. H. Bartholomew, and R. J. Farrauto, Fundamentals of Industrial Catalytic Processes, Wiley Interscience, Hoboken, NJ, 2006 Search PubMed.
- V. R. Stamenkovic, B. Fowler, B. S. Mun, G. Wang, P. N. Ross, C. A. Lucas and N. M. Markovic, Science, 2007, 315, 493–497 CrossRef CAS.
- J. Zhang, K. Sasaki, E. Sutter and R. R. Adzic, Science, 2007, 315, 220–222 CrossRef CAS PubMed.
- H. Yang, R. Nie, W. Xia, X. Yu, D. Jin, X. Lu, D. Zhou and Q. Xia, Green Chem., 2017, 19, 5714–5722 RSC.
- B. Zhang, J. Song, G. Yang and B. Han, Chem. Sci., 2014, 5, 4656–4660 RSC.
- S. Suganuma, K. Nakajima, M. Kitano, D. Yamaguchi, H. Kato, S. Hayashi and M. Hara, Solid State Sci., 2010, 12, 1029–1034 CrossRef CAS.
- R. S. Thombal and V. H. Jadhav, RSC Adv., 2016, 6, 30846–30851 RSC.
- R. S. Thombal and V. H. Jadhav, Appl. Catal., A, 2015, 499, 213–216 CrossRef CAS.
- S. Navalon, A. Dhakshinamoorthy, M. Alvaro, M. Antonietti and H. Garcia, Chem. Soc. Rev., 2017, 46, 4501–4529 RSC.
- P. Tang, G. Hu, M. Li and D. Ma, ACS Catal., 2016, 6, 6948–6958 CrossRef CAS.
- D. R. Dreyer, S. Park, C. W. Bielawski and R. S. Ruoff, Chem. Soc. Rev., 2010, 39, 228–240 RSC.
- F. Hu, M. Patel, F. Luo, C. Flach, R. Mendelsohn, E. Garfunkel, H. He and M. Szostak, J. Am. Chem. Soc., 2015, 137, 14473–14480 CrossRef CAS.
- W. Zhang, Z.-Y. Wu, H.-L. Jiang and S.-H. Yu, J. Am. Chem. Soc., 2014, 136, 14385–14388 CrossRef CAS PubMed.
- Z. Yao, H. Nie, Z. Yang, X. Zhou, Z. Liu and S. Huang, Chem. Commun., 2012, 48, 1027–1029 RSC.
- K. Chizari, A. Vena, L. Laurentius and U. Sundararaj, Carbon, 2014, 68, 369–379 CrossRef CAS.
- E. Drug and M. Gozin, J. Am. Chem. Soc., 2007, 129, 13784–13785 CrossRef CAS PubMed.
- M. K. Sahoo, K. Saravanakumar, G. Jaiswal and E. Balaraman, ACS Catal., 2018, 8, 7727–7733 CrossRef CAS.
- L. Wang, A. Ishida, Y. Hashidoko and M. Hashimoto, Angew. Chem., Int. Ed., 2017, 56, 870–873 CrossRef CAS PubMed.
- L. Zhao, N. Baccile, S. Gross, Y. Zhang, W. Wei, Y. Sun, M. Antonietti and M.-M. Titirici, Carbon, 2010, 48, 3778–3787 CrossRef CAS.
- T. X. Wu, G. Z. Wang, X. Zhang, C. Chen, Y. X. Zhang and H. J. Zhao, Chem. Commun., 2015, 51, 1334–1337 RSC.
- A. Primo, P. Atienzar, E. Sanchez, J. M. Delgado and H. Garcia, Chem. Commun., 2012, 48, 9254–9256 RSC.
- X. Chen, H. Yang and N. Yan, Chem.–Eur. J., 2016, 22, 13402–13421 CrossRef CAS PubMed.
- J. Su, Y. Yang, G. Xia, J. Chen, P. Jiang and Q. Chen, Nat. Commun., 2017, 8, 14969 CrossRef PubMed.
- P. R. Thombal and S. S. Han, Biofuel Res. J., 2018, 20, 886–893 CrossRef.
- B. Sahoo, A. E. Surkus, M. M. Pohl, J. Radnik, M. Schneider, S. Bachmann, M. Scalone, K. Junge and M. A. Beller, Angew. Chem., Int. Ed., 2017, 56, 11242–11247 CrossRef CAS PubMed.
- R. B. N. Baig and R. S. Varma, Green Chem., 2013, 15, 1839–1843 RSC.
- A. Zhu, P. Tan, L. Qiao, Y. Liu, Y. Ma, X. Xiong and J. Pan, Inorg. Chem. Front., 2017, 4, 1748–1756 RSC.
- N. A. M. Barakat, M. Alajami, Z. K. Ghouri and S. Al-Meer, Int. J. Electrochem. Sci., 2018, 13, 4693–4699 CrossRef CAS.
- S. Premlatha and G. N. K. Ramesh Bapu, J. Electroanal. Chem., 2018, 822, 33–42 CrossRef CAS.
- B. Ali, S. M. Tasirin, P. Aminayi, Z. Yaakob, N. T. Ali and W. Noori, Nanomaterials, 2018, 8, 1053–1080 CrossRef PubMed.
- L. J. Konwar, A. Samikannu, M.-A. Paivi and J.-P. Mikkola, Catal. Sci. Technol., 2018, 8, 2449–2459 RSC.
- L. Hu, F. Peng, D. Xia, H. He, C. He, Z. Fang, J. Yang, S. Tian, V. K. Sharma and D. Shu, ACS Sustainable Chem. Eng., 2018, 6, 17391–17401 CrossRef CAS.
- Y. Zhang, H. Yang, Q. Chi and Z. Zhang, ChemSusChem, 2019, 12, 1246–1255 CrossRef CAS PubMed.
- H. Cheng, Y. Z. Su, P. Y. Kuang, G. F. Chen and Z. Q. Liu, J. Mater. Chem. A, 2015, 3, 19314–19321 RSC.
- X. Huang, X. Wu, Y. Niu, C. Dai, M. Xu and W. Hu, Catal. Sci. Technol., 2019, 9, 711–717 RSC.
- Z. Jin, C. Liu, K. Qi and X. Cui, Sci. Rep., 2017, 7, 39695 CrossRef CAS PubMed.
- J. Yun, J. Jun, J. Lee, J. Ryu, K. Lee, H. Yu and J. Jang, RSC Adv., 2017, 7, 20694–20699 RSC.
- S. Li, A. Pasc, V. Fierro and A. Celzard, J. Mater. Chem. A, 2016, 4, 12686–12713 RSC.
- K. S. Du and J. M. Huang, Green Chem., 2019, 21, 1680–1685 RSC.
- L. S. Bai, X. M. Gao, X. Zhang, F. F. Sun and N. Ma, Tetrahedron Lett., 2014, 55, 4545–4548 CrossRef CAS.
- D. S. Su, G. D. Wen, S. C. Wu, F. Peng and R. Schlogl, Angew. Chem., Int. Ed., 2017, 129, 936–964 CrossRef PubMed.
- H. Yu, F. Peng, J. Tan, X. W. Hu, H. J. Wang, J. Yang and W. X. Zheng, Angew. Chem., Int. Ed., 2011, 50, 3978–3982 CrossRef CAS PubMed.
- G. Wen, Q. Gu, Y. Liu, R. Schlogl, C. Wang, Z. Tian and D. S. Su, Angew. Chem., Int. Ed., 2018, 57, 16898–16902 CrossRef CAS PubMed.
- X. X. Yang, Y. H. Cao, H. Yu, H. Y. Huang, H. J. Wang and F. Peng, Catal. Sci. Technol., 2017, 7, 4431–4436 RSC.
Footnote |
| † Electronic supplementary information (ESI) available. See DOI: 10.1039/c9ra08146a |
| This journal is © The Royal Society of Chemistry 2020 |

