 Open Access Article
Antimicrobial activity of multifaceted lactoferrin or graphene oxide functionalized silver nanocomposites biosynthesized using mushroom waste and chitosan
Sundos Suleman Ismail Abdallaa,
Haliza Katas *a,
Jie Yee Chana,
Pavitra Ganasana,
Fazren Azmia and
Mohd Fauzi Mh Busrab
aCentre for Drug Delivery Research, Faculty of Pharmacy, Universiti Kebangsaan Malaysia, Kuala Lumpur Campus, Jalan Raja Muda Abdul Aziz, Kuala Lumpur, 50300, Malaysia. E-mail: haliza.katas@ukm.edu.my; Fax: +60-3-26983271; Tel: +60-3-92897971
bTissue Engineering Centre, UKM Medical Centre, 56000, Cheras, Kuala Lumpur, Malaysia
First published on 30th January 2020
Abstract
Hybrid nanoparticles designed to exert multiple mechanisms of antibacterial action offer a new approach to the fight against pathogenic resistant bacteria. In this study, nanomaterials with the dual actions of antibacterial and anti-biofilm activities were developed using silver nanoparticles (AgNPs) functionalized with either lactoferrin (LTF) or graphene oxide (GO). AgNPs were synthesized using mushroom waste as a reducing agent and chitosan (CS) as a stabilizing agent, prior to their surface functionalization with either GO (AgGO) or LTF (Ag-LTF). The AgNPs exhibited a surface plasmon resonance (SPR) band at 430 nm, as determined by UV-vis spectroscopy, whereas the absorption of AgGO and Ag-LTF occurred at 402 and 441 nm, respectively. Particle size analysis of AgNPs, AgGO, and Ag-LTF revealed sizes of 121.5 ± 10.5, 354.0 ± 1.6, and 130.8 ± 1.2 nm, respectively. All AgNPs, Ag-LTF, and AgGO inhibited selected Gram-positive bacteria and Gram-negative bacteria with comparable antibacterial performance, as determined by the agar diffusion method. Despite the absence of antibacterial activity by GO and LTF, a synergistic effect of AgGO and Ag-LTF was observed as they had a greater activity against P. aeruginosa. Moreover, Ag-LTF did not affect cell viability and migration rate of cells, suggesting the non-toxicity of Ag-LTF. In conclusion, AgNPs, Ag-LTF, and AgGO possess antibacterial activity, which may offer an alternative for future antibacterial agents.
Introduction
Many cases of infection are due to biofilm forming microbes, of which the Gram-positive bacterium Staphylococcus aureus and the Gram-negative Pseudomonas aeruginosa are the most common ones.1 Nowadays, the emergence of antibiotic-resistant bacteria and the growing incidence of hospital-acquired bacterial infections has led to the resurgence of silver nanoparticles (AgNPs). AgNPs, which are between 1 and 100 nm in diameter, have become a focus in the field of research and subsequently, been commercialized. The ability to exhibit antibacterial and anti-biofilm activities has also been well established throughout history.2However, the increasing demand for the development of AgNPs must be met by a biosynthetic method rather than a chemical method, to reduce hazardous waste generated. Spent mushroom substrate (SMS), a compost of mushroom fungi, is known to synthesize metal nanoparticles.3 As the production of SMS now occurs in excess and it represents a waste management problem, therefore, there is a need to find an alternative use for SMS demand.4 Furthermore, the combination of silver ions with biological compounds is a good approach to reduce the interaction of silver ions with human cells and to conserve the antimicrobial properties.
Chitosan, a natural cationic polysaccharide, is used in metal–chitosan nanocomposites for biomedical applications owing to its biodegradability and antibacterial properties. Chitosan is also used as a stabilizing agent to protect AgNPs from agglomeration5 and to improve biocompatibility of metal nanoparticles. Moreover, the addition of chitosan as a reducing agent to produce AgNPs could enhance antibacterial effect and produce greater activity compared with pure chitosan.6
Several studies suggested that graphene oxide (GO) possesses antibacterial activity against many types of microorganisms,7,8 whereas AgNPs functionalized with GO (AgGO) exhibit enhanced antibacterial and anti-biofilm properties.9–11 GO is a sheet of sp2-bonded single-carbon-atom-thick graphene that has been chemically modified with carboxylic and carbonyl groups (oxygen functional groups) at the edges of the sheet, whereas epoxy and hydroxyl groups on the basal plane.12 Lactoferrin (LTF) is an iron-binding protein that was shown to exhibit good anti-biofilm activity through the inhibition of formation and destruction of existing biofilms.13 Therefore, the functionalization of AgNPs with LTF (Ag-LTF) is expected to enhance the anti-biofilm activity of AgNPs. The synergistic effect of both components may prevent the development of resistance to these new agents by microorganisms.
In present study, AgNPs were prepared using SMS as a reducing agent and chitosan as a stabilizing agent, with the addition of GO or LTF to form AgGO and Ag-LTF, respectively. The antibacterial and anti-biofilm activities of AgNPs, AgGO, and Ag-LTF against Gram-positive and Gram-negative bacteria were investigated using different methods, including the microbroth dilution method and the crystal violet assay. Furthermore, safety of the nanocomposites on living cells was assessed by determining the cytotoxicity effect and cell migration on normal human fibroblast cells (NHFs).
Materials and methods
Materials
SMS of Pleurotus ostreatus (oyster mushroom) was a gift from Lignas Bio Synergy Plt., Selangor, Malaysia. Silver nitrate (AgNO3) (ACS reagent grade) was procured from Sigma Aldrich, Ireland. Human lactoferrin (LTF) was obtained from Sigma-Aldrich (USA). Low molecular weight (LMW: 50–190 kDa) chitosan, 75–85% deacetylated, was purchased from Sigma Aldrich (Ireland). Glacial acetic acid (GAA) was purchased from R&M Chemicals, UK. Distilled water was produced in the laboratory using Hamilton WCS/85 Cabinet Water Still. GO water dispersion (4 mg mL−1) was procured from Graphenea (San Sebastián, Spain).To determine the antibacterial and anti-biofilm activities, four bacterial strains (Staphylococcus aureus, Pseudomonas aeruginosa, Bacillus sp., and Escherichia coli) were obtained from Microbiology Laboratory of Faculty Pharmacy, Universiti Kebangsaan Malaysia. All bacterial strains were maintained in broth prior to testing. Mueller–Hinton Broth (MHB) and Mueller–Hinton agar (MHA) were purchased from Difco Laboratory of Becton Dickinson Company, USA. Ciprofloxacin HCl was purchased from Sigma Aldrich, Ireland. Dulbecco's phosphate buffered saline (D-PBS) (−) without calcium chloride and magnesium chloride was purchased from Nacalai Tesque, Japan. Crystal violet was obtained from Ajax Finechem Laboratory of Thermo Fisher Scientific, Auckland, New Zealand, and 70% ethanol was procured from J-Kollin Chemicals, UK.
Water extraction of SMS (WESMS)
SMS powder (20 g) was soaked in 100 mL of distilled water at a ratio of 1![[thin space (1/6-em)]](https://www.rsc.org/images/entities/char_2009.gif) :
:![[thin space (1/6-em)]](https://www.rsc.org/images/entities/char_2009.gif) 5 (w/v). The mixture was then stirred continuously for 30 min at 60 °C using a magnetic stirrer. The solid residues were then removed from the solution and the solution was centrifuged at 10
5 (w/v). The mixture was then stirred continuously for 30 min at 60 °C using a magnetic stirrer. The solid residues were then removed from the solution and the solution was centrifuged at 10![[thin space (1/6-em)]](https://www.rsc.org/images/entities/char_2009.gif) 000 rpm (4 °C) for 15 min (Allegra 64R from Beckman Coulter, Ireland). The supernatant was collected and filtered using Whatman 150 mm filter paper. The filtered extract was obtained and made to a final concentration of 0.1 g mL−1. The extract was used as a reducing agent for the preparation of AgNPs.
000 rpm (4 °C) for 15 min (Allegra 64R from Beckman Coulter, Ireland). The supernatant was collected and filtered using Whatman 150 mm filter paper. The filtered extract was obtained and made to a final concentration of 0.1 g mL−1. The extract was used as a reducing agent for the preparation of AgNPs.
Constituent analysis of WESMS
The phytochemical constituents of WESMS were analyzed by liquid chromatography-mass spectrometry (LC-MS) on a PerkinElmer Flexar FX-15 UHPLC system coupled to Sciex 3200 hybrid trap triple quadrupole tandem mass spectrometer (UHPLC-MSMS model https://doi.org//1031491/K, Waltham, Massachusetts, USA). The extracts were filtered through a 0.45 μm nylon syringe filter prior to LC-MS analysis. The separation was achieved using a Phenomenex Synergy RP C18 column (100 Å, 100 mm × 3 μm × 2.0 mm). The run time was approximately 15 min, with a back pressure of approximately 18![[thin space (1/6-em)]](https://www.rsc.org/images/entities/char_2009.gif) 000 psi. The mobile phases comprised (A) 0.1% formic acid in deionized water and (B) 0.1% formic acid in acetonitrile, and the injection volume was 20 μL. The MS conditions were set as follows: the scan was carried out in the mass ranges of 100–1200 and 100–1500 m/z, with a source temperature of 500 °C in negative and positive ionization mode. The eluent was split and approximately 0.8 mL min−1 was introduced into the mass detector. Analyst® TF 1.5.2 software (Sciex) was used for data acquisition and analysis.
000 psi. The mobile phases comprised (A) 0.1% formic acid in deionized water and (B) 0.1% formic acid in acetonitrile, and the injection volume was 20 μL. The MS conditions were set as follows: the scan was carried out in the mass ranges of 100–1200 and 100–1500 m/z, with a source temperature of 500 °C in negative and positive ionization mode. The eluent was split and approximately 0.8 mL min−1 was introduced into the mass detector. Analyst® TF 1.5.2 software (Sciex) was used for data acquisition and analysis.
Preparation of AgNPs
A volume of 5 mL WESMS (0.1 g mL−1) was mixed with 1 mL of 0.01 M silver nitrate solution (0.017% w/v). The reaction was performed at room temperature for 3 days on standing. The color of the solution turned from yellow into reddish brown and the reaction was continued until color change was no longer detected, which indicated the formation of AgNPs.Functionalization of AgNPs
![[thin space (1/6-em)]](https://www.rsc.org/images/entities/char_2009.gif) 000 rpm for 15 min using a benchtop centrifuge (Allegra 64R, Beckman Coulter, Ireland).
000 rpm for 15 min using a benchtop centrifuge (Allegra 64R, Beckman Coulter, Ireland).Stabilization of AgNPs, Ag-LTF, and AgGO with chitosan (chitosan-capping)
A volume of 5 mL chitosan solution (0.09% w/v, in 1% GAA) was added into the AgNPs, Ag-LTF, and AgGO nanocomposites. The mixtures were sonicated for 10 min, stirred at 500 rpm for 2 h, and washed three times with distilled water by centrifugation (15![[thin space (1/6-em)]](https://www.rsc.org/images/entities/char_2009.gif) 000 rpm for 15 min) to remove excess unreacted reactants.
000 rpm for 15 min) to remove excess unreacted reactants.
UV-vis spectrophotometry
The formation of chitosan stabilized AgNPs, AgGO and Ag-LTF as well as GO was analyzed using a UV-vis spectrophotometer (Shimadzu 180, Centurion Scientific, New Delhi). The scan range was set at 200–800 nm at a scan speed of 480 mm min−1. Baseline correction was conducted by using distilled water as blank reference. Analysis was conducted on the spectra and a graph of absorbance versus wavelength was obtained and recorded.Particle size, polydispersity index (PDI), and zeta potential
The mean particle size (Z-average), PDI, and zeta potential (surface charge) of freshly prepared AgNPs, Ag-LTF, and AgGO were characterized using a Malvern Zetasizer Nano ZS (Malvern Instruments, UK). All measurements for particle size were performed at 25 °C with a detection of angle of 90°. Samples were measured in triplicate and the data are presented as mean ± standard deviation (SD).Morphology analysis
Morphological analysis of AgNPs, AgGO and Ag-LTF was conducted using a transmission electron microscope (TEM) (Philips, CM12, USA). For the analysis, drops of sample dispersion were placed on the grid and allowed to dry at room temperature (25 °C ± 2 °C) for 1 min. The sample was then viewed under TEM at different magnifications.Fourier transform infrared spectroscopy (FT-IR) analysis
FTIR analysis of AgNPs, SMS, Ag-LTF, AgGO, GO and LTF were conducted in the range of 4000–400 cm−1 by using an FT-IR spectrophotometer (PerkinElmer 100 Spectrum, Waltham, MA, USA). The spectra were acquired using 32 scans and a 4 cm−1 resolution.Anti-bacterial assays
In this experiment, ciprofloxacin HCl and distilled water were used as the positive and negative controls, respectively. For sample testing, approximately 70 μL of uncapped AgNPs, chitosan stabilized (AgNPs, Ag-LTF and AgGO), LTF, and GO was loaded into separate wells by using a micropipette. The lid was then placed onto the plate and the plate was sealed with parafilm to avoid contamination. The plates were incubated at 37 °C for 24 h in an incubator (Memmert, Schwabach, Germany). The diameter of zone of inhibition (mm) was measured using an electronic digital Vernier caliper (Mitutoyo Absolute, Digimatic, Japan). The measurements were made in triplicate.
Cytotoxicity studies
Statistical analysis
The obtained data are presented as the mean ± standard deviation (SD). The data were analyzed by ONE-way ANOVA followed by Tukey's post hoc test. Analyses were computed using GraphPad Prism 6. Values of p < 0.05 was considered to indicate a statistically significant difference between the samples tested.Results and discussion
Preparation mechanism
The phytochemical analysis using LC-MS revealed the presence of fatty acids derivatives and phenolic compounds in WESMS (Fig. 1(A)). As shown in previous studies, these constituents (Fig. 1(B)), such as decanoic acid derivatives14 and vanillic acid15,16 could act as reducing agents in the biosynthesis of AgNPs.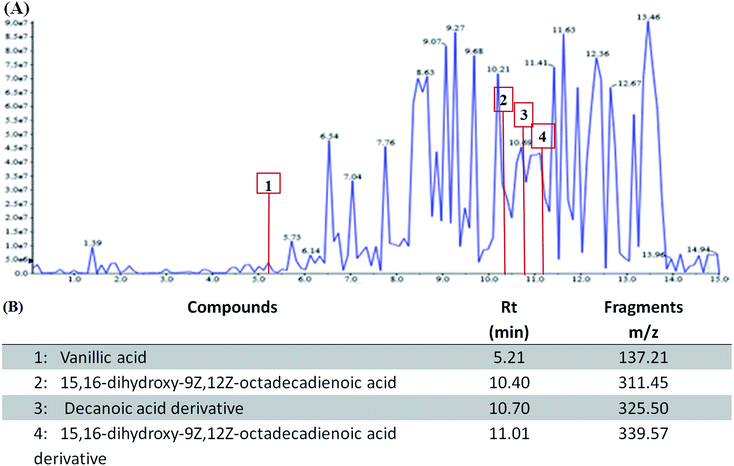 | ||
| Fig. 1 Liquid chromatography-mass spectrometry (LC-MS) analysis of constituents in WESMS (A) and (B) identified compounds found in WESMS. | ||
Formation and characterization of AgNPs, Ag-LTF, and AgGO
The color of reaction mixture changed from yellowish to reddish-brown, indicated the formation of AgNPs (Fig. 2(A)). The color change resulted from the excitation of surface plasmon vibrations in the nanoparticles.17 The biomolecules in the SMS extract reduced the silver ions into AgNPs. The formation of AgNPs was confirmed by the characteristic plasmon resonance band at 430 nm (Fig. 2(B(a))). It is reported that the absorption for wavelength ranges above 400 nm is due to the longitudinal plasmon vibrations.18,19 In addition, spherical nanoparticles were observed at a peak of approximately 420–450 nm, which was confirmed by TEM analysis (Fig. 3) and a previous study.20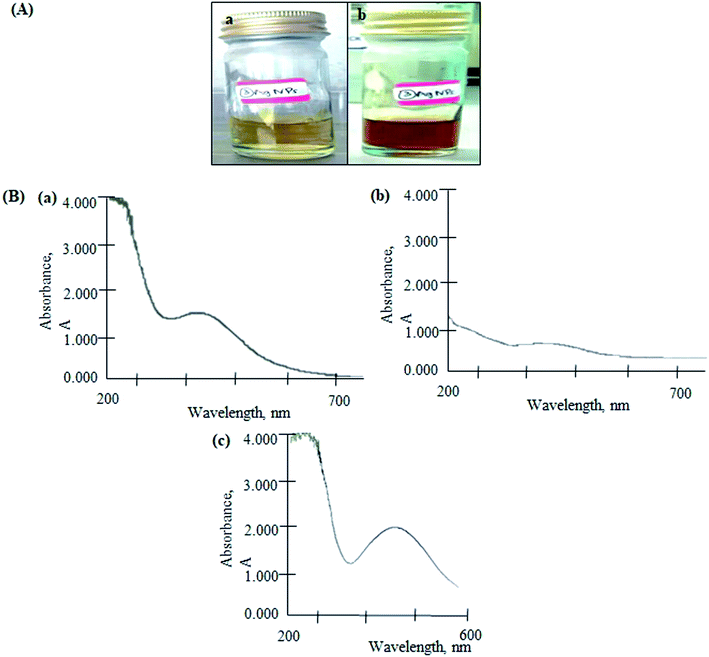 | ||
| Fig. 2 (A) Colour changes in the reaction mixture of SMS and silver (Ag) solution from yellow (a) to reddish-brown (b) and (B) UV-vis spectrum of AgNPs (a), AgGO (b) and Ag-LTF (c). | ||
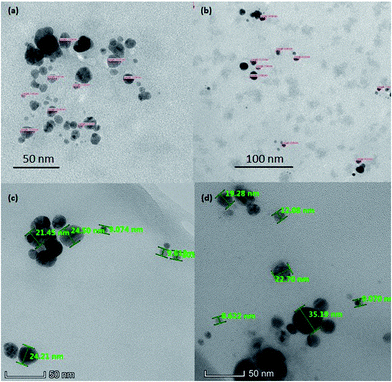 | ||
| Fig. 3 TEM image of AgNPs (a), chitosan-stabilized AgNPs (b), AgGO (c) and Ag-LTF (d) at 60k×, 100k×, and 310k× respectively. | ||
For the AgGO, the GO suspension was added into the AgNPs solution. This formed a GO nanocomposite impregnated with biosynthesized AgNPs via an ex situ process (AgGO). The UV-vis absorption spectrum of the raw GO sample showed a characteristic band at 223 nm, which indicated the electronic π–π* transitions of C–C aromatic bonds.21 The absorbance of AgGO was attributed to the surface plasmon resonance peak at 402 nm of AgNPs (Fig. 2(B(c))). This phenomenon occurred when the incident light interacted with the valence electrons in the outer band of AgNPs, leading to the oscillation of electrons along with the frequency of the electromagnetic source.22 This indicated the presence of AgNPs in the AgGO nanocomposite, which was similar to the results of a previous study.23 Finally, the absorption spectrum of Ag-LTF was measured at 441 nm (Fig. 2(B(c))); as the wavelength was above 400 nm and this confirmed the presence of AgNPs.
Particle size, PDI, and zeta potential
The particle size of different nanocomposites was measured by dynamic light scattering (DLS) technique and the results are presented in Table 1. The particle size of chitosan-stabilized AgNPs (121.5 ± 10.5 nm) was significantly larger (as in Table 1) than the uncapped AgNPs (83.0 ± 22.2 nm), indicating the successful coating of chitosan on their surface (p < 0.05). The uncapped AgNPs were prepared using 0.1% w/v WESMS as the particle size was inversely proportional to WESMS concentration. The particle size was ranged between 80 and 500 nm by varying WESMS concentration from 0.1 to 0.2% w/v and it remained unchanged after reducing to 0.05% w/v (data is not shown). In contrast, the particle size of surface functionalized nanocomposites with LTF (Ag-LTF) was unchanged when the nanocomposites were capped with chitosan (113.2 ± 0.7 to 132.4 ± 3.21 nm). However, the particle size of AgGO was larger, even prior to capping with chitosan and significantly increased after capping (324.5 ± 0.50 to 354.5 ± 1.55 nm, respectively, p < 0.05). This was expected owing to the large size of GO (308 ± 86 nm). The analysis of the uniformity of these nanocomposites showed that PDI values were in the range of 0.24 ± 0.01 to 0.50 ± 0.01, indicating a moderate dispersity with a narrow size distribution.24| Particle size (nm) ± SD | PDI ± SD | Zeta potential (mV) ± SD | |
|---|---|---|---|
| Without capping with chitosan | |||
| AgNPs | 83.0 ± 22.2 | 0.35 ± 0.05 | −11.23 ± 0.74 |
| Ag-LTF | 113.2 ± 0.7 | 0.32 ± 0.01 | −9.96 ± 1.53 |
| AgGO | 324.5 ± 1.6 | 0.46 ± 0.11 | −11.56 ± 1.50 |
![[thin space (1/6-em)]](https://www.rsc.org/images/entities/char_2009.gif) |
|||
| Capping with chitosan | |||
| AgNPs | 121.5 ± 10.5 | 0.29 ± 0.04 | +60.83 ± 1.25 |
| Ag-LTF | 132.4 ± 3.2 | 0.24 ± 0.01 | +55.13 ± 0.86 |
| AgGO | 354.5 ± 1.6 | 0.50 ± 0.01 | +52.76 ± 1.26 |
The resultant AgNPs had a negative zeta potential (−9.96 ± 1.53 to −11.56 ± 1.50 mV) and, when capped with chitosan, had a positive surface charge (+52.76 ± 1.26 to +60.8 ± 1.25 mV), which was attributed to the presence of protonated amino groups in the structure of chitosan. The surface of GO is negatively charged due to ionization of functional groups like carboxylic acid and phenolic hydroxyl groups that attributed to the negative charge of AgGO. Ionization of similar functional groups may also explain the negative charge of Ag-LTF. The higher zeta potential value of chitosan-stabilized nanocomposites indicated the electrostatic stability of the system.25 These results also suggested that chitosan was an efficient capping agent to stabilize the nanocomposites and provided a strong positive charge that ensured the particles were kept away from each other, which reduced the tendency for AgNPs to aggregate.
Morphology
The morphology of AgNPs appeared to be spherical, as shown in Fig. 3. The particle size of AgNPs, chitosan-stabilized AgNPs, AgGO and Ag-LTF ranged from 4 to 15 nm, 7 to 14 nm, 9 to 24 and 10 to 35 nm, respectively, similar to those reported previously (5–50 nm).25 The particles capped with chitosan were well dispersed, with no obvious aggregates observed. In contrast, uncapped AgNPs were moderately dispersed, with some aggregates present. The particle size measured by DLS was larger than by TEM. This observation commonly occurs because DLS is a more sensitive method that can measure large and small particles as well as aggregates in a solution, whereas TEM may measure certain particles only due to possibility of biasness during sample preparation.26 In addition, in this study, the use of chitosan as a capping agent may have increased the hydrodynamic diameter relative to the size of the inorganic core, as shown previously.27FT-IR analysis
FT-IR analysis was conducted to identify the possible chemical interactions for the formation of AgNPs synthesized using WESMS and chitosan (Fig. 4(A)). The broad absorption band between 3500–3000 cm−1 corresponded to the overlap of O–H and N–H stretching vibrations for chitosan,28 whereas the band at 1638 cm−1 appears to be the residual N-acetyl group (C![[double bond, length as m-dash]](https://www.rsc.org/images/entities/char_e001.gif) O stretching of amide I). In contrast, the broad band at 3352 cm−1 corresponds to the OH-stretching of the alcohols and phenols in WESMS, as the constituent analysis revealed that phenolic compounds were also present (Fig. 1). Moreover, the bands at 2234 and 1636 cm−1 corresponded to the C
O stretching of amide I). In contrast, the broad band at 3352 cm−1 corresponds to the OH-stretching of the alcohols and phenols in WESMS, as the constituent analysis revealed that phenolic compounds were also present (Fig. 1). Moreover, the bands at 2234 and 1636 cm−1 corresponded to the C![[double bond, length as m-dash]](https://www.rsc.org/images/entities/char_e001.gif) N and C
N and C![[double bond, length as m-dash]](https://www.rsc.org/images/entities/char_e001.gif) O stretching of the nitrile and amide, respectively, owing to the presence of proteins in SMS.29 Similarly, the FTIR spectrum of biosynthesized AgNPs showed a broad absorption band between 3309 and 1639 cm−1, which corresponded to N–H and O–H stretching, as well as the intramolecular vibrations. The presence of WESMS and the chitosan coating on the AgNPs contributed to the well-stabilized nanocomposites.30 Such modifications of band have been reported previously with different extracts and these modifications were shown to be influenced by the constituent biomolecules.31,32
O stretching of the nitrile and amide, respectively, owing to the presence of proteins in SMS.29 Similarly, the FTIR spectrum of biosynthesized AgNPs showed a broad absorption band between 3309 and 1639 cm−1, which corresponded to N–H and O–H stretching, as well as the intramolecular vibrations. The presence of WESMS and the chitosan coating on the AgNPs contributed to the well-stabilized nanocomposites.30 Such modifications of band have been reported previously with different extracts and these modifications were shown to be influenced by the constituent biomolecules.31,32
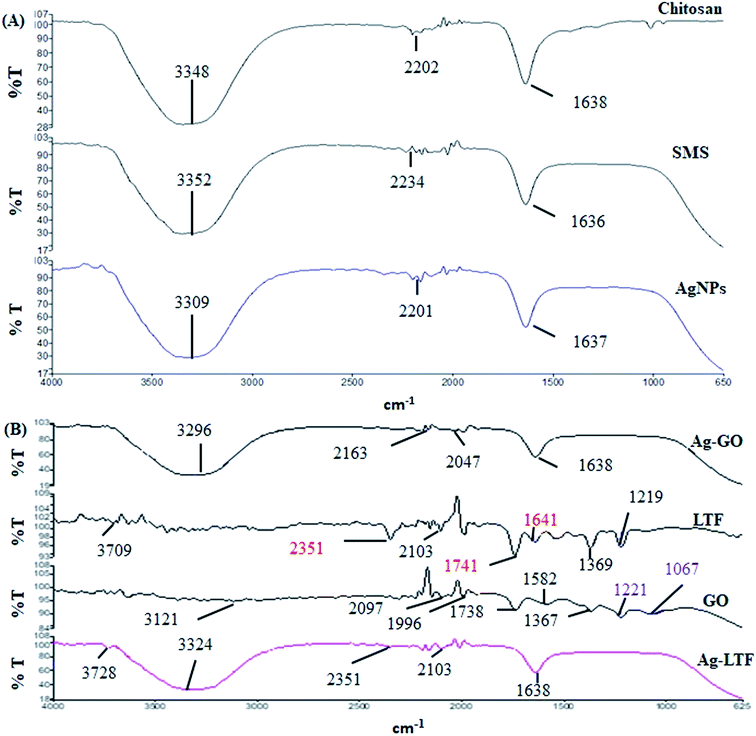 | ||
| Fig. 4 FTIR analysis of different nanocomposites and their single components: (A) chitosan stabilized AgNPs and (B) surface functionalized AgNPs capped with chitosan. | ||
The FT-IR spectra of AgGO, GO, LTF and Ag-LTF are shown in Fig. 4(B). The bands at 2097 and 1740 cm−1 indicate the presence of the O–C![[double bond, length as m-dash]](https://www.rsc.org/images/entities/char_e001.gif) O and C
O and C![[double bond, length as m-dash]](https://www.rsc.org/images/entities/char_e001.gif) O functional groups in GO, and the band at 1996 cm−1 corresponded to C–H bending of aromatic compounds. The bands at 1367 and 1221 cm−1 were attributed to the presence of C–OH, and the band at 1067 cm−1 corresponded to the C–O (epoxy) groups of GO.33 Apart from a band at 2097 cm−1, the AgGO spectrum showed the elimination of bands at 1996, 1738, 1221, and 1067 cm−1, which indicated the interaction between Ag+ and carboxylate groups on the edge of the GO sheets. These interactions might involve the formation of a coordination bond, simple electrostatic attraction, and the reduction of GO.34 The appearance of bands at 3296 and 1638 cm−1 indicated the presence of chitosan after capping.
O functional groups in GO, and the band at 1996 cm−1 corresponded to C–H bending of aromatic compounds. The bands at 1367 and 1221 cm−1 were attributed to the presence of C–OH, and the band at 1067 cm−1 corresponded to the C–O (epoxy) groups of GO.33 Apart from a band at 2097 cm−1, the AgGO spectrum showed the elimination of bands at 1996, 1738, 1221, and 1067 cm−1, which indicated the interaction between Ag+ and carboxylate groups on the edge of the GO sheets. These interactions might involve the formation of a coordination bond, simple electrostatic attraction, and the reduction of GO.34 The appearance of bands at 3296 and 1638 cm−1 indicated the presence of chitosan after capping.
LTF exhibits absorption bands at 3709 cm−1 (N–H stretching), 2351 cm−1, 2103 cm−1 (C–H bending), and 1741 cm−1 (C–O stretching). The absorption band observed at 1641 cm−1, which corresponded to the absorption band of amide I, was assigned to the stretching vibration of histidine. The bands at 1369 and 1219 cm−1 were assigned to aspartic acid (in the presence of metal ions) and tyrosine.35 The addition of LTF to AgNPs reduced (2351 and 2103 cm−1) and eliminated (2351, 2103, 1741, 1641, 1369 and 1219 cm−1) certain absorption bands. However, the bands at 3709 and 1641 cm−1 were slightly shifted (to 3728 and 1638 cm−1, respectively). Similar to AgGO, the appearance of a broad band between 3500 and 3000 cm−1 that corresponded to the overlap of N–H and O–H stretching indicated the presence of chitosan in the nanocomposites.
Antibacterial activity
In this study, the agar well diffusion and microbroth dilution tests were used to determine the antibacterial activity of nanocomposites and their individual components (Table 2 and Fig. 5). Uncapped AgNPs and chitosan-stabilized nanocomposites (AgNPs, Ag-LTF, and AgGO) exhibited antibacterial activity, whereas GO and LTF exerted no antibacterial effects. A similar result was reported by De Faria et al.,36 who showed no inhibition for all bacterial strains tested for GO. A more recent study showed that GO caused a minor damage to bacteria, owing to its negative charge that could not interact well with the bacterial membrane.37 However, other contrasting findings reported that GO could inhibit bacteria in a concentration-dependent manner.38–40 These contradictory findings may be attributable to the different physiochemical characteristics for each particular nanoparticle formulation. Physiochemical characteristics, such as the size and thickness of the sheets, oxidation ratio and dispersibility will depend on the source compounds and the oxidation and exfoliation processes.36| Sample (1 mg mL−1) | Zone of inhibition (mm) | |||
|---|---|---|---|---|
| S. aureus | Bacillus sp. | P. aeruginosa | E. coli | |
| a Positive control – ciprofloxacin; “—” zone of inhibition of bacteria unsubstantiated; “*” statistically different from the positive control (p < 0.05). | ||||
| Uncapped AgNPs | *12.5 ± 0.2 | *10.7 ± 0.8 | 12.3 ± 1.1 | *9.5 ± 0.6 |
| AgNPs | *12.9 ± 0.1 | *12.8 ± 0.6 | *13.0 ± 1.1 | *13.4 ± 0.3 |
| AgGO | *12.0 ± 0.0 | *12.2 ± 0.3 | *13.0 ± 0.8 | *13.1 ± 0.4 |
| Ag-LTF | *13.5 ± 0.9 | *11.9 ± 1.0 | 12.9 ± 1.3 | *14.0 ± 1.2 |
| GO | — | — | — | — |
| LTF | — | — | — | — |
| Positive control | 28.0 ± 1.0 | 28.3 ± 1.1 | 10.7 ± 0.3 | 36.7 ± 0.6 |
| WESMS | — | — | — | — |
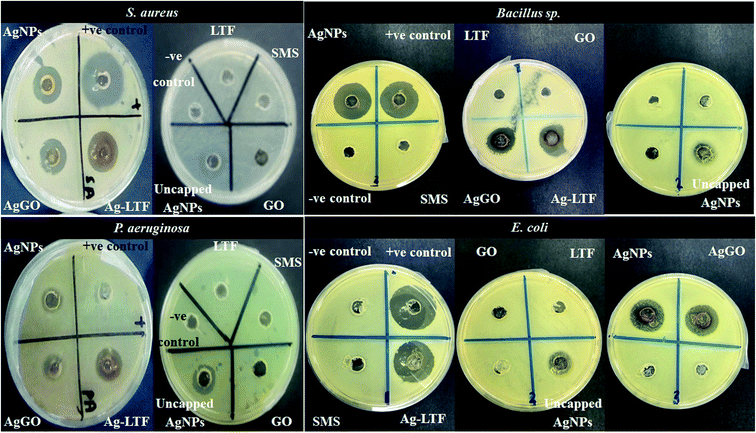 | ||
| Fig. 5 Zone inhibition of AgNPs, AgGO and Ag-LTF and their single components as determined by agar well diffusion method against selected bacterial strains. | ||
In general, all nanocomposites showed comparable antibacterial activities against Gram-positive and Gram-negative bacteria. Unexpectedly, these nanocomposites were more effective against P. aeruginosa and the activity was higher than the positive control. The antibacterial activities of AgNPs have been well established.17,41,42 Studies have reported that the antibacterial effects are due to the electrostatic attraction between positively charged Ag+ ions and the negatively charged cell membrane of microorganisms.43
Other mechanisms proposed involved the uptake of free Ag+ ions, followed by depletion of ATP production and DNA replication, the generation of reactive oxygen species (ROS), and the direct damage of AgNPs to cell membranes.44 Silver nanoclusters packed with daptomycin was developed as a new strategy to combat infection.45 In this study, ultra-small AgNPs were conjugated with daptomycin through an amide linkage. AgNPs were demonstrated to generate ROS, which in turn oxidized the bacteria lipid bilayer and caused further damage to the cell membrane, allowing more nanoclusters to enter the bacteria and leading to their high killing effect.
Moreover, owing to the physical difference between Gram-positive and Gram-negative bacteria, in which the former bacteria has a thicker peptidoglycan layer at the outer cell, many studies have reported that AgNPs demonstrated greater antibacterial properties against thinner layer of Gram-negative bacteria.12,46,47 A study by Anthony et al.48 showed that biosynthesized AgNPs using pine mushroom (Tricholoma matsutake) were more effective in killing Gram-negative bacteria (E. coli) than Gram-positive bacteria (B. subtilis) as determined by agar well diffusion method and plate count technique.
However, the results of this study showed that AgNPs had similar antibacterial effects against both Gram-positive and Gram-negative bacteria. This may have been a result of the addition of chitosan, which enhanced the antibacterial effect against Gram-positive bacteria. A study by Lima et al.26 reported that AgNPs made with chitosan exhibited the same potency towards S. aureus and P. aeruginosa. A few mechanisms have been postulated, such as the greater susceptibility of Gram-positive bacteria to the antimicrobial effect of chitosan, or a dependence on the bacterial cell membrane composition. The S. aureus cell membrane consists mainly of negatively charged phosphatidylglycerol, cardiolipin, and positively charged lysyl-phosphatidylglycerol (LPG); the latter accounts for 14–38% of the total phospholipid content, which may make it more susceptible to the action of chitosan.49
As the agar well diffusion method is not able to generate MIC value and it is hard to examine the susceptibility of fastidious and slow-growing bacteria,50 the microbroth dilution assay was also conducted (Fig. 6). AgNPs and Ag-LTF effectively inhibited Gram-positive and Gram-negative bacteria, with a MIC value of 32 μg mL−1. For AgGO, the MIC obtained was 125 μg mL−1 against all bacteria, except for Bacillus sp., in which the lowest concentration was 250 μg mL−1. The results contradicted previous studies, which showed a synergistic effect between GO and AgNPs.51 Studies reported that GO was the substrate that aided the mechanical immobilization,51 whereas AgNPs on the GO sheets killed bacteria.52,53 However, a study by Marta et al.,54 reported that the significant antibacterial activity of AgGO with chitosan was not related to the enhancement of the effects of GO, but instead to the unique physical and chemical characteristics of these nanocomposites, which, when applied in combination, produced a synergistic action to yield a suitable nanointerface for the interaction with bacteria cells through a capture and killing process. Furthermore, the relative amounts of GO and AgNPs need to be balanced.55 Hence, further research is needed to determine the appropriate design of nanocomposites, in terms of particle size and concentration, to obtain synergistic antibacterial effects.
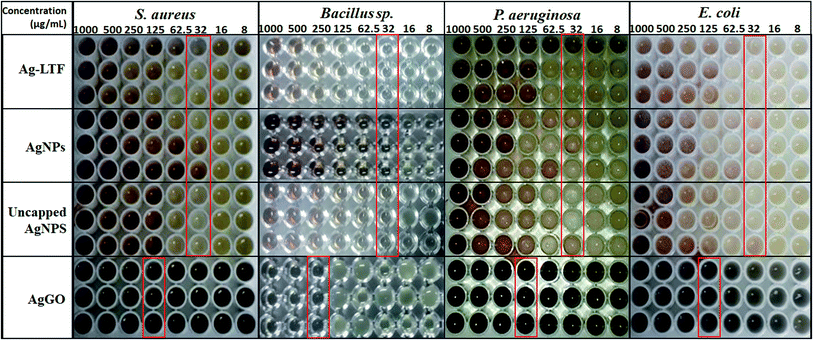 | ||
| Fig. 6 MIC of Ag-LTF, AgNPs, uncapped AgNPs and AgGO against selected bacterial strains as determined by microbroth dilution assay. | ||
Several studies reported that biosynthesized AgNPs displayed an obvious size-dependent antibacterial activity. The activity was enhanced with smaller size particles.56–59 A study by Lu et al.59 compared the biostatic effects of three different sizes of AgNPs (5, 15 and 55 nm) against five anaerobic oral pathogenic bacteria (S. mutans, S. sanguis, S. mitis, A. actinomycetemcomitans, F. nuceatum and aerobic bacteria E. coli). The results demonstrated that the antibacterial property depends on the size of particles which the smallest AgNPs had the highest activity. In this study, a relationship between particle size and antibacterial activity could not been seen clearly. This could be due to the fact that the effect might not be entirely depending on the particle size. Other factors may play a more important role, for example, the synergistic action of AgNPs, chitosan and anti-biofilm agents as one entity.
Anti-biofilm potential
In this study, those nanocomposites capped with chitosan were tested and the results of biofilm inhibition against S. aureus and P. aeruginosa are shown in Table 3. All nanocomposites exhibited anti-biofilm activity and this was attributed to the ability of chitosan to alter the physical characteristics of bacterial cells. Many anti-biofilm polysaccharides may involve in aiding bacterial gene expression as they act as signaling molecules, resulting in disruption of biofilm or induction of cell motility for the spreading of cells from biofilms.60,61 In addition, the activity was also attributed to the ability of Ag+ ions to interfere and regulate extracellular polymeric substances (EPS). For example, a cluster of 15 genes controls the formation of EPS by P. aeruginosa and the inhibition of proteins by AgNPs can potentially prevent the synthesis of EPS.62 The inhibition of proteins can be achieved by the cationic Ag+ ion that causes coagulation of matrix proteins in the biofilm via charge neutralization.63| Sample (125 μg mL−1) | Percent (%) of biofilm inhibition | |
|---|---|---|
| S. aureus | P. aeruginosa | |
| AgNPs | 53.8 ± 3.6 | 34.2 ± 11.0 |
| AgGO | 37.8 ± 6.5 | 68.5 ± 7.0 |
| Ag-LTF | 59.1 ± 5.2 | 68.4 ± 2.5 |
| GO | 0.0 ± 0.0 | 1.0 ± 1.7 |
| LTF | 45.7 ± 6.0 | 40.2 ± 6.5 |
| Positive control (ciprofloxacin) | 54.9 ± 16.5 | 58.2 ± 13.7 |
| WESMS | — | — |
In this study, Ag-LTF exhibited the strongest anti-biofilm activity and it was greater than ciprofloxacin, which confirmed the synergistic effects of AgNPs, LTF, and chitosan when in nanocomposite formulations. Unexpectedly, the antibiofilm activity of Ag-LTF and AgGO exhibited greater inhibition of P. aeruginosa than S. aureus, despite the absence of any anti-biofilm effect of GO towards all the bacteria strains tested. A study by Kulshrestha et al.64 reported a similar finding, in which AgGO nanocomposites were biosynthesized using a flower extract of Legistromia speciosa (L.) Pers that exhibited better anti-biofilm activity against Gram-negative than Gram-positive bacteria. The findings also suggested that AgGO inhibited biofilm of Gram-negative bacteria by producing ROS while, suppressing the expression of genes involved in biofilm formation for Gram-positive bacteria.
This has been attributed to different mechanisms, in which GO hinders the adhesion and penetration the biofilm matrix,65 and the Ag+ ion is able to inhibit protein which then disrupts the synthesis of EPS that build up the biofilm. In this study, the antimicrobial effect of chitosan could be overwhelmed by the AgGO, resulting in the greater anti-bacterial effect on Gram-negative bacteria. Some advantages of this system have been proposed. These include the attachment of AgNPs onto the GO sheet, which may increase the biocompatibility of the material and decrease the toxicological effects related to metallic nanoparticles. In addition, the immobilization of AgNPs onto GO sheets may prevent the mobility of nanoparticles and reduce their agglomeration.66 However, AgNPs inhibited S. aureus to a greater extent than P. aeruginosa, which was in accordance with a study by Pérez-Díaz et al.,67 who reported that a chitosan gel with AgNPs exhibited a stronger effect on methicillin-resistant S. aureus than on P. aeruginosa.
In this study, the morphology of P. aeruginosa treated with Ag-LTF was also viewed using SEM. Untreated bacterial cells and exposed to ciprofloxacin were used as negative and positive control, respectively. SEM micrographs revealed that biofilm-produced bacterial cells had damaged and undergone morphological changes (as indicated by an arrow) after 24 h exposure to ciprofloxacin and AgLTF as compared to negative control (Fig. 7). It is well documented that antibiotics can affect bacteria in ways other than the expected bactericidal action, including induction of morphological changes.68,69 Morphological dissimilarity of AgNPs was also reported by Patil et al.70
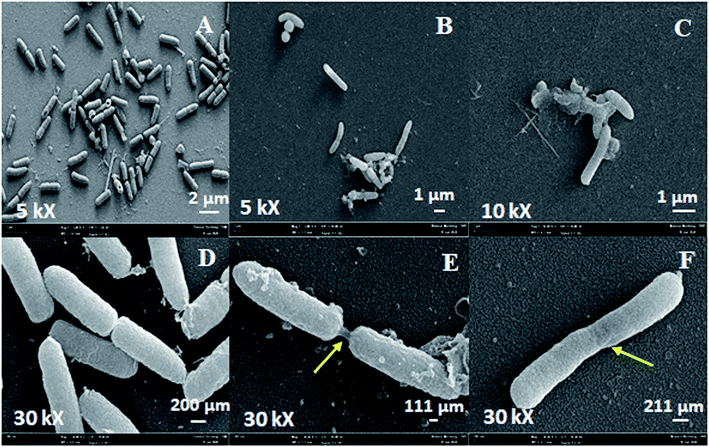 | ||
| Fig. 7 SEM micrograph of P. aeruginosa biofilm bacteria at 24 h for untreated ((A) and (B)), after exposure to ciprofloxacin ((c) and (D)) and Ag-LTF ((E) and (F)). | ||
Cytotoxicity effects and cell migration
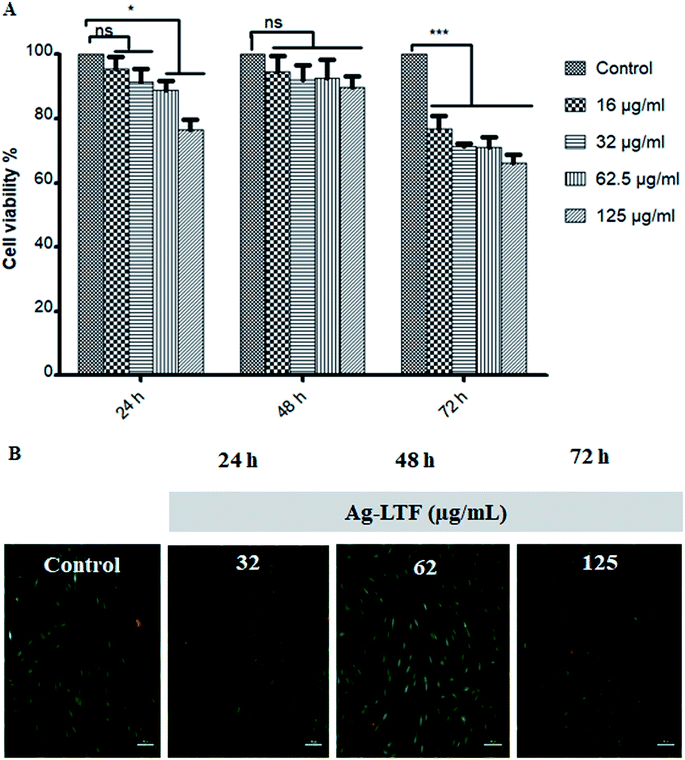
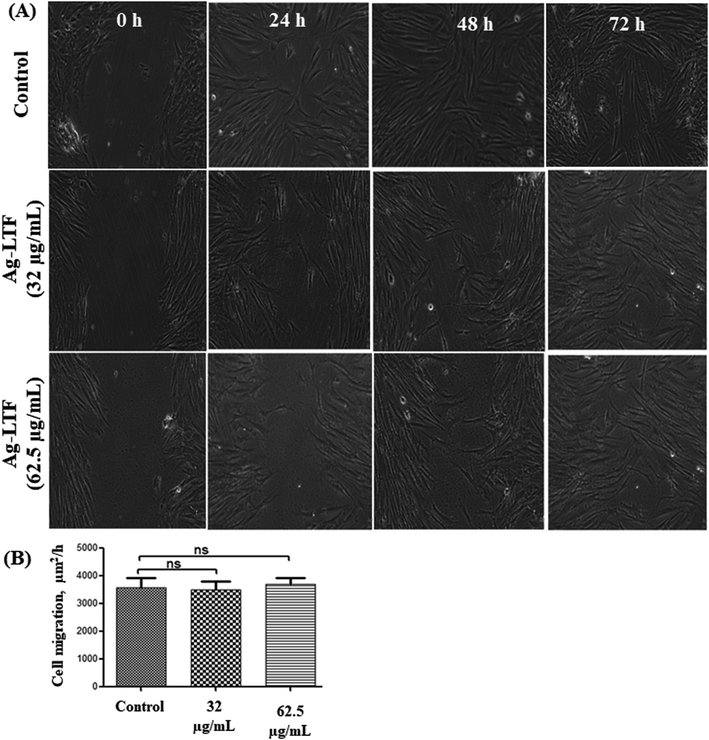
Cytotoxic effect of Ag-LTF on HDFs is shown in Fig. 8(A). A reduction in cell viability was observed as Ag-LTF concentration was increased from 16 to 125 μg mL−1 at 24, 48 and 72 h incubation. The results indicated that the cytotoxicity effect of Ag-LTF is a dose- and time-dependent due to the loss of cell viability was also observed after a longer exposure to Ag-LTF samples. In general, Ag-LTF was non-cytotoxic for up to 24 h of exposure, even at the highest concentration tested. A study by Ullah et al.37 also demonstrated that AgNPs-GO composites decorated with tobramycin were tolerated by human embryonic kidney cells (HEK 293 cell line) up to 160 μg mL−1. Similar findings were observed for biosynthesized AgGO using a flower extract of Legistromia speciosa (L.) Pers on HEK 293 cell line. The AgGO were relatively non-toxic at antibacterial concentration of these nanoparticles.64 Cytotoxic effects of AgNPs on HDFs and normal human epidermal keratinocytes (NHEK) were reported previously by which AgNPs were reported to be safe as a topical agent for wound healing up to 25 μg mL−1.71 The cytotoxicity effects of Ag-LTF was further investigated using LIVE/DEAD™ Cell Viability Assay. The control and cells treated with Ag-LTF did not show the presence of dead cells (stained red) as shown in Fig. 8(B). These results are in correspondence with the results of alamarBlue™ assay, suggesting the non-toxicity of Ag-LTF after 24 h exposure.Cell migration is also an important factor in determining any detrimental effect of a substance on mammalian cells. Thus, scratch assay was performed to measure the rate of cell migration of Ag-LTF, in comparison to non-treated cells (indicating the natural rate of cell migration). After 72![[thin space (1/6-em)]](https://www.rsc.org/images/entities/char_2009.gif) h exposure, the cells migrated towards the provisional gap as shown in Fig. 9(A). The migration analysis showed that HDFs treated with Ag-LTF at 32 and 62.5 μg mL−1 had a comparable rate of cell migration as compared to the control group, suggesting that Ag-LTF did not affect the cell migration, therefore may not be causing adverse effect on the mammalian cells during healing (Fig. 9(B)).
h exposure, the cells migrated towards the provisional gap as shown in Fig. 9(A). The migration analysis showed that HDFs treated with Ag-LTF at 32 and 62.5 μg mL−1 had a comparable rate of cell migration as compared to the control group, suggesting that Ag-LTF did not affect the cell migration, therefore may not be causing adverse effect on the mammalian cells during healing (Fig. 9(B)).
Conclusions
In this study, WESMS was shown to be a potential reducing agent, and the use of chitosan as a capping or stabilizing agent did not affect the antibacterial activity of the prepared nanocomposites and, indeed, may even have enhanced the activity. Chitosan-stabilized Ag-LTF possessed stronger antibacterial activity against P. aeruginosa and greater anti-biofilm activity against both Gram-positive and Gram-negative bacteria compared with the positive control. Despite the better antibacterial properties of AgNPs compared with AgGO, further optimization of AgGO activity should be considered owing to its high anti-biofilm activity against Gram-negative bacteria. In addition, the successful anti-biofilm activity of Ag-LTF and AgGO against S. aureus and P. aeruginosa was shown, with greater activity for the latter bacteria by both nanocomposites. Cytotoxicity studies conducted also showed that the Ag-LTF was non-toxic and had lower risk to cause adverse effects on the living cells. These findings also warrant further studies including mechanism of antibacterial action to ensure their efficacy for clinical application.Conflicts of interest
The are no conflicts to declare. The authors alone are responsible for the content and writing of this article.Acknowledgements
The authors acknowledge the financial support received from Universiti Kebangsaan Malaysia, Malaysia [AP-2017-008/3]. The authors wish to thank JGS Revolution Cell for sponsoring morphological analysis of nanocomposites.Notes and references
- H. S. Joo and M. Otto, Chem. Biol., 2012, 19, 1503 CrossRef CAS PubMed.
- K. Chaloupka, Y. Malam and A. M. Seifalian, Trends Biotechnol., 2010, 28, 580 CrossRef CAS PubMed.
- N. Vigneshwaran, A. A. Kathe, P. V. Varadarajan, R. P. Nachane and R. H. Balasubramanya, Langmuir, 2007, 23, 7113 CrossRef CAS PubMed.
- C.-W. Phan and V. Sabaratnam, Appl. Microbiol. Biotechnol., 2012, 96, 863 CrossRef CAS PubMed.
- S. Akmaz, E. Dilaver Adıgüzel, M. Yasar and O. Erguven, Adv. Mater. Sci. Eng., 2013, 690918 Search PubMed.
- S. W. Ali, S. Rajendran and M. Joshi, Carbohydr. Polym., 2011, 83, 438 CrossRef CAS.
- I. E. M. Carpio, C. M. Santos, X. Wei and D. F. Rodrigues, Nanoscale, 2012, 4, 4746 RSC.
- J. Chen, H. Peng, X. Wang, F. Shao, Z. Yuan and H. Han, Nanoscale, 2014, 6, 1879 RSC.
- M. R. Das, R. K. Sarma, R. Saikia, V. S. Kale, M. V. Shelke and P. Sengupta, Colloids Surf., B, 2011, 83, 16 CrossRef CAS PubMed.
- J. Ma, J. Zhang, Z. Xiong, Y. Yong and X. S. Zhao, J. Mater. Chem., 2011, 21, 3350 RSC.
- W.-P. Xu, L.-C. Zhang, J.-P. Li, Y. Lu, H.-H. Li, Y.-N. Ma, W.-D. Wang and S.-H. Yu, Mater. Chem., 2011, 21, 4593 RSC.
- S. W. Chook, C. H. Chia, S. Zakaria, M. K. Ayob, K. L. Chee, H. M. Neoh and N. M. Huang, Adv. Mater. Sci. Res., 2012, 364, 439 CAS.
- H. Kamiya, T. Ehara and T. Matsumoto, J. Infect. Chemother., 2012, 18, 47 CrossRef CAS PubMed.
- G. S. Kiran, A. Sabu and J. Selvin, J. Biotechnol., 2010, 148, 221 CrossRef CAS PubMed.
- H. Zamani and A. Moradshahi, Mol. Biol. Res. Commun., 2013, 2, 47 CAS.
- N. Ahmad, S. Sharma, M. K. Alam, V. N. Singh, S. F. Shamsi, B. R. Mehta and A. Fatma, Colloids Surf., B, 2010, 81, 81 CrossRef CAS.
- V. Sabaratnam, Mater. Lett., 2016, 186, 21 Search PubMed.
- D. Balaji, S. Basavaraja, R. Deshpande, D. B. Mahesh, B. Prabhakar and A. Venkataraman, Colloids Surf., B, 2009, 68, 88 CrossRef CAS PubMed.
- P. Khanna, D. Kulkarni and R. K. Beri, J. Nanopart. Res., 2008, 10, 1059 CrossRef CAS.
- S. Poulose, T. Panda, P. P. Nair and T. Theodore, J. Nanosci. Nanotechnol., 2014, 14, 2038 CrossRef CAS PubMed.
- J. Li and C. Y. Liu, Eur. J. Inorg. Chem., 2010, 1244 CrossRef CAS.
- D. D. Evanoff Jr and G. Chumanov, ChemPhysChem, 2005, 6, 1221 CrossRef PubMed.
- K. Chandraker, R. Nagwanshi, S. Jadhav, K. K. Ghosh and M. L. Satnami, Spectrochim. Acta, Part A, 2017, 181, 47 CrossRef CAS PubMed.
- S. Bhattacharjee, J Control Release, 2016, 235, 337 CrossRef CAS PubMed.
- M. J. Haider and M. S. Mehdi, Int. J. Appl. Sci. Eng. Res., 2014, 5, 381 Search PubMed.
- D. D. S. Lima, B. Gullon, A. Cardelle-Cobas, L. M. Brito, K. A. Rodrigues, P. V. Quelemes, J. Ramos-Jesus, D. D. Arcanjo, A. Plácido and K. Batziou, J. Bioact. Compat. Polym., 2017, 32, 397 CrossRef CAS.
- A. P. De Aragão, T. M. De Oliveira, P. V. Quelemes, M. L. G. Perfeito, M. C. Araújo, J. D. a. S. Santiago, V. S. Cardoso, P. Quaresma, J. R. De Souza De Almeida Leite and D. A. Da Silva, Arabian J. Chem., 2016 DOI:10.1016/j.arabjc.2020.01.009.
- C. Branca, G. D'Angelo, C. Crupi, K. Khouzami, S. Rifici, G. Ruello and U. Wanderlingh, Polymer, 2016, 99, 614 CrossRef CAS.
- Z. Lou, Y. Sun, X. Zhou, S. A. Baig, B. Hu and X. Xu, Geoderma, 2017, 307, 30 CrossRef CAS.
- H. Katas, L. C. Sin, A. Y. H. N. Azlan, F. Buang and M. F. M Busra, Saudi Pharm. J., 2019, 27, 283–292, DOI:10.1016/j.jsps.2018.11.010.
- A. Haider and I.-K. Kang, Adv. Mater. Sci. Eng., 2015, 165257 Search PubMed.
- H. J. Prabu and I. Johnson, Karbala International Journal of Modern Science, 2015, 1, 237 CrossRef.
- S. Gurunathan, J. Han and J. H. Kim, Colloids Surf., B, 2013, 111, 376 CrossRef CAS PubMed.
- D. Bao, P. Zhang and J. Qi, J. Colloid Interface Sci., 2011, 360, 463 CrossRef PubMed.
- G. Duca, L. Anghel and R. V. Erhan, Chem. J. Mold., 2018, 13, 111 CAS.
- A. F. De Faria, A. C. M. De Moraes, P. D. Marcato, D. S. T. Martinez, N. Durán, A. G. S. Filho, A. Brandelli and O. L. Alves, J. Nanopart. Res., 2014, 16, 2110 CrossRef.
- S. Ullah, A. Ahmad, F. Subhan, A. Jan, M. Raza, A. U. Khan, A. U. Rahman, U. A. Khan, M. Tariq and Q. Yuan, J. Photochem. Photobiol., B, 2018, 183, 342 CrossRef CAS PubMed.
- W. Hu, C. Peng, W. Luo, M. Lv, X. Li, D. Li, Q. Huang and C. Fan, ACS Nano, 2010, 4, 4317 CrossRef CAS PubMed.
- K. Krishnamoorthy, N. Umasuthan, R. Mohan, J. Lee and S.-J. Kim, J. Mater. Chem. B, 2012, 4, 6892 Search PubMed.
- X. Wu, S. Tan, Y. Xing, Q. Pu, M. Wu and J. X. Zhao, Colloids Surf., B, 2017, 157, 1 CrossRef CAS.
- V. K. Sharma, R. A. Yngard and Y. Lin, Adv. Colloid Interface Sci., 2009, 145, 83 CrossRef CAS PubMed.
- G. M. Sulaiman, W. H. Mohammed, T. R. Marzoog, A. A. Al-Amiery, A. A. Kadhum and A. B. Mohamad, Asian Pac. J. Trop. Biomed., 2013, 3, 58 CrossRef CAS PubMed.
- P. Dibrov, J. Dzioba, K. K. Gosink and C. C. Hase, Antimicrob. Agents Chemother., 2002, 46, 2668 CrossRef CAS PubMed.
- C. Marambio-Jones and E. M. V. Hoek, J. Nanopart. Res., 2010, 12, 1531 CrossRef CAS.
- K. Zheng, M. I. Setyawati, T.-P. Lim, D. T. Leong and J. Xie, ACS Nano, 2016, 10, 7934 CrossRef CAS PubMed.
- J. S. Kim, E. Kuk, K. N. Yu, J.-H. Kim, S. J. Park, H. J. Lee, S. H. Kim, Y. K. Park, Y. H. Park and C.-Y. Hwang, Nanomedicine, 2007, 3, 95 CrossRef CAS PubMed.
- L. B. Din, R. Mie, M. W. Samsudin, A. Ahmad and N. Ibrahim, Malaysian J. Anal. Sci., 2015, 19, 369 Search PubMed.
- K. J. P. Anthony, M. Murugan, M. Jeyaraj, N. K. Rathinam and G. Sangiliyandi, J. Ind. Eng. Chem., 2014, 20, 2325 CrossRef CAS.
- A. Peschel, R. W. Jack, M. Otto, L. V. Collins, P. Staubitz, G. Nicholson, H. Kalbacher, W. F. Nieuwenhuizen, G. Jung and A. Tarkowski, J. Exp. Med., 2001, 193, 1067 CrossRef CAS.
- T. D. Wilkins and T. Thiel, Antimicrob. Agents Chemother., 1973, 3, 350 CrossRef CAS.
- S. W. Chook, C. H. Chia, S. Zakaria, M. K. Ayob, N. M. Huang, H. M. Neoh and R. Jamal, RSC Adv., 2015, 5, 26263 RSC.
- L. D. Renner and D. B. Weibel, MRS Bull., 2011, 36, 347 CrossRef CAS PubMed.
- J. Tang, Q. Chen, L. Xu, S. Zhang, L. Feng, L. Cheng, H. Xu, Z. Liu and R. Peng, ACS Appl. Mater. Interfaces, 2013, 5, 3867–3874, DOI:10.1021/am4005495.
- B. Marta, M. Potara, M. Iliut, E. Jakab, T. Radu, F. Imre-Lucaci, G. Katona, O. Popescu and S. Astilean, Colloids Surf., A, 2015, 487, 113 CrossRef CAS.
- T. T. T. Vi, S. Rajesh Kumar, B. Rout, C.-H. Liu, C.-B. Wong, C.-W. Chang, C.-H. Chen, D. W. Chen and S. J. Lue, Nanomaterials, 2018, 8, e163 CrossRef PubMed.
- A. PanáčEk, L. Kvitek, R. Prucek, M. Kolář, R. VečEřová, N. Pizúrová, V. K. Sharma, T. NevěčNá and R. Zbořil, J. Phys. Chem. B, 2006, 110, 16248 CrossRef PubMed.
- G.-A. Martínez-Castañon, N. Nino, F. Martínez-Gutiérrez, J. R. Martinez and F. Ruiz, J. Nanopart. Res., 2008, 10, 1343 CrossRef.
- L. Espinosa-Cristóbal, G. Martínez-Castañón, R. Martínez-Martínez, J. Loyola-Rodriguez, N. Patino-Marin, J. Reyes-Macias and F. J. M. L. Ruiz, Mater. Lett., 2009, 63, 2603 CrossRef.
- Z. Lu, R. Kaifeng, J. Li, H. Yang and R. Chen, J. Mater. Sci.: Mater. Med., 2013, 24, 1465 CrossRef CAS.
- E. Karatan and P. Watnick, Microbiol. Mol. Biol. Rev., 2009, 73, 310 CrossRef CAS.
- Y. Kim and S. H. Kim, Biochem. Biophys. Res. Commun., 2009, 379, 324 CrossRef CAS PubMed.
- F. Martinez-Gutierrez, L. Boegli, A. Agostinho, E. M. Sánchez, H. Bach, F. Ruiz and G. James, Biofouling, 2013, 29, 651 CrossRef CAS PubMed.
- C.-Y. Loo, P. M. Young, R. Cavaliere, C. B. Whitchurch, W.-H. Lee and R. Rohanizadeh, Drug Dev. Ind. Pharm., 2014, 40, 719 CrossRef CAS.
- S. Kulshrestha, S. Qayyum and A. U. Khan, Microb. Pathog., 2017, 103, 167 CrossRef CAS.
- M. Di Giulio, R. Zappacosta, S. Di Lodovico, E. Di Campli, G. Siani, A. Fontana and L. Cellini, Antimicrob. Agents Chemother., 2018, 62, e00547 CrossRef PubMed.
- A. F. De Faria, D. S. T. Martinez, S. M. M. Meira, A. C. M. De Moraes, A. Brandelli, A. G. S. Filho and O. L. Alves, Colloids Surf., B, 2014, 113, 115 CrossRef PubMed.
- M. Pérez-Díaz, E. Alvarado-Gomez, M. Magaña-Aquino, R. Sánchez-Sánchez, C. Velasquillo, C. Gonzalez, A. Ganem-Rondero, G. Martínez-Castañon, N. Zavala-Alonso and F. Martinez-Gutierrez, Mater. Sci. Eng., C, 2016, 60, 317 CrossRef PubMed.
- Z. Yao, D. Kahne and R. Kishony, Mol. Cell, 2012, 48, 705 CrossRef CAS PubMed.
- L. Gomes, L. Silva, M. Simões, L. Melo and F. Mergulhão, J. Biomed. Mater. Res., Part A, 2015, 103, 1414 CrossRef CAS PubMed.
- V. Patil, S. Mahajan, M. Kulkarni, K. Patil, C. Rode, A. Coronas and G.-R. Yi, Chemosphere, 2019, 243, 125302 CrossRef PubMed.
- A. Galandáková, J. Franková, N. Ambrožová, K. Habartova, V. Pivodova, B. Zálešák, K. Šafářová, M. Smekalova and J. Ulrichova, Hum. Exp. Toxicol., 2016, 35, 946 CrossRef PubMed.
| This journal is © The Royal Society of Chemistry 2020 |


