 Open Access Article
The effects of different factors on the removal mechanism of Pb(II) by biochar-supported carbon nanotube composites
Yuewei Yang†
*,
Fengfei Sun† ,
Jing Li,
Junfeng Chen and
Meizhen Tang
School of Life Science, Qufu Normal University, Qufu 273165, China. E-mail: yangyuewei@163.com
First published on 5th February 2020
Abstract
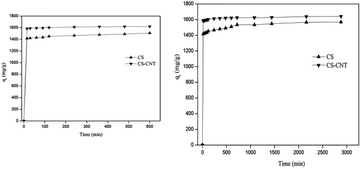
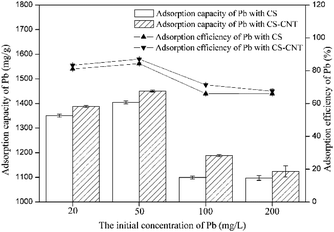
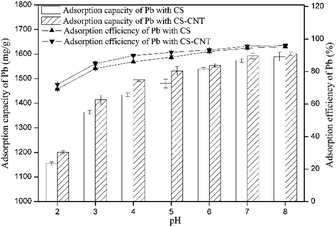
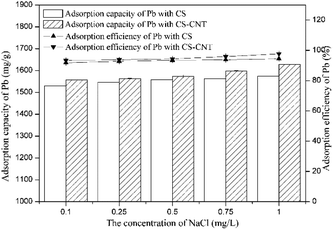
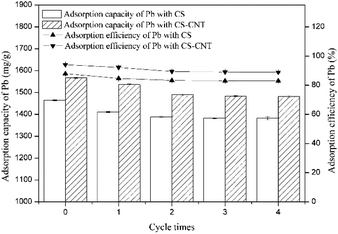
Herein, biochar-supported nanomaterials were synthesized using a mixture of chestnut shells and carbon nanotubes via slow pyrolysis at 600 °C for 1 h. Then, the adsorption ability of chestnut shell-carbon nanotubes (CS-CNTs) towards the removal of aqueous Pb(II) was tested. The removal capacity of Pb(II) by CS-CNT was 1641 mg g−1, which was significantly higher than that by the biochar of chestnut shells (CSs) (1568 mg g−1), which demonstrated that the sorption capacity could be improved by the carbon nanotubes. The factors studied here indicated that the adsorption was rapid in the initial 15 min under the conditions of the Pb(II) concentration of 50 mg L−1 and the pH value of 5, and the values reached 1417 mg g−1 and 1584 mg g−1. The adsorption rate and capacity increased on increasing the concentration of NaCl. The sorption reaction was consistent with the Langmuir model, indicating a mono-layer adsorption behavior. The adsorption process can also be defined via the pseudo-second-order model, suggesting that the adsorption of Pb(II) might be controlled by chemisorption. After carrying out four cycles of adsorption–desorption experiments, the adsorption rates of CS and CS-CNT remained at 82.92% and 88.91%, respectively, indicating that the biochar samples had stable and excellent sorption ability for heavy metals and huge application value. Thus, this study would provide a promising sorbent for the treatment and remediation of metal contaminants.
1. Introduction
With the rapid development of modern industries and agriculture, the presence of lead (Pb) in the aquatic environment has become a major concern for researchers worldwide. Because of their toxicity, persistence and non-degradation, heavy metals tend to accumulate in living organisms; this poses a serious threat to the living organisms and human health and gradually affects the entire ecosystem.1,2 The removal of Pb(II) from wastewater has become an urgent problem in environmental protection. Therefore, the development of scientific and effective methods to deal with the wastewater polluted by Pb(II) has become a research hotspot.Several methods, such as advanced oxidation, biological treatment, electrochemical technologies, and adsorption, have been widely used to remove heavy metals from wastewater.3–6 The adsorption technology is a preferred approach because of its safety, efficiency, and economic feasibility; moreover, it can be performed using low-cost sorbents in the adsorption process.7 Biochar is the most popular sorbent in the sorption process, and many studies have been carried out on biochar. Biochar, which can be produced by the oxygen-restricted pyrolysis of biological organic materials8,9 and has numerous environmental benefits and wide application potential, has attracted considerable attention from many researchers.10 It is not only a stable porous carbon material but also a low-cost sorbent with a high specific surface area and abundant surface functional groups; due to these properties, biochar is widely applied for increasing soil fertility and adsorption performance to alleviate environmental pollution and reduce environmental risks.11–15 As an economical, green and efficient sorbent, biochar has been widely used in the study of heavy metal adsorption.16 However, it has been found that biochar easily causes secondary pollution during the adsorption of heavy metals.17,18 With the further development of biochar, the preparation of biochar composites with excellent adsorption performance by modifying and loading other materials on its surface has become a current research focus.
Similar to biochar, carbon nanotubes (CNTs), characterized by large specific surface areas and layered hollow structures are promising new adsorbents that have unique mechanical, electrical and thermal properties.19 Previous studies have shown that carbon nanotubes have excellent binding affinity to heavy metals in aqueous solutions;20–22 however, the application of carbon nanotubes in the removal of heavy metals is limited due to the poor solubility of these nanotubes and their tendency to aggregate into bundles. Hence, novel techniques have been developed to stabilize carbon nanotubes in order to improve their capacity for application in the removal of heavy metals. Several studies have demonstrated that biochar can be used as a carrier to provide both pore space and surface sites to stabilize and distribute carbon nanotubes.23–25 In addition, recent studies have proposed to combine biochar with nanomaterials, which can produce “engineered biochars” that would feature unique physicochemical properties and enhanced sorption capacities for the removal of heavy metals.26 Since both biochar and nanomaterials have significant adsorption capacity, the biochar-supported nanocomposites are prospective sorbents for contaminants and can provide a new prospect for water treatment and environmental protection.
Thus, the objectives of our research are as follows: (i) to produce biochar-supported nanomaterials by an impregnation method and evaluate the potentials of nanocomposites as functional sorbents for the removal of heavy metals; (ii) to utilize Pb(II) as a model metal pollutant to examine the effect of underlying influencing factors, such as initial Pb(II) concentration, solution pH, ionic strength, utilization times of the biochar samples, reaction time and temperature, on the adsorption reaction; and (iii) to obtain insights into the mechanism of the reaction of Pb(II) with biochar-supported nanocomposites by mathematical models and characterization tools.
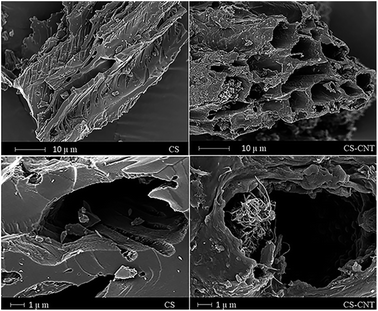
In the previous studies on the sorption of Pb(II) on biochar-supported CNT composites published until now, the raw materials of biochar vary, including sugar beet, animal waste residues and sweetgum biomass.27,28 In this paper, biochar and biochar-supported nanocomposites were prepared through the slow pyrolysis of chestnut shells pre-treated with CNTs, and this study investigated the effects of different factors on the sorption of Pb(II) with biochar samples, which has not been reported so far. Moreover, biochar and biochar-supported nanocomposites were characterized by scanning electron microscopy (SEM), Fourier transform infrared spectroscopy (FTIR) and X-ray diffraction (XRD). Simultaneously, various mathematical models were used to simulate the adsorption process and contribute to the analysis of sorptive mechanism. This paper not only investigates the efficiency of the adsorption of Pb(II) on the composites, but also provides experimental basis and theoretical support for the application of biochar and its composites in treating heavy metal pollution.
2. Materials and methods
2.1 Materials
Chestnut shells were obtained from Qufu city, China, and its chemical components were phenois, organic acids, sugar, polysaccharides or glycosides, iactanes, coumarins, sterol or triterpene, tannins and flavonoids.29,30 After being washed with distilled water, the feedstock was naturally air-dried and crushed to powder for biochar production. The carbon nanomaterials multi-walled CNTs (MWCNTs, purity > 95%, Beijing, China) with the diameters of 10–20 nm were used. Lead nitrate was purchased from Tianjin Kaitong Chemical Reagent Co., Ltd. (Tianjin, China). The chemical reagents used in this study were of analytical grade.2.2 Preparation of the sorbents
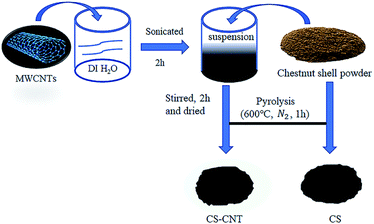
As shown in Fig. 1, the carbon nanomaterial-biochar nanocomposites are prepared by the impregnation method. First, a nanomaterial suspension was prepared by mixing 3 g of CNT with 200 mL of deionized (DI) water, and the suspension was stirred and sonicated for 2 h in an ultrasonicator (SB-5200-DT) for the preparation of biochar-based nanocomposites. Second, 20 g chestnut shell feedstock was added to the abovementioned suspension and thoroughly dip-coated for 2 h, followed by drying in an oven at 70 °C for 48 h. Finally, the nanocomposites produced via slow pyrolysis for 1 h at 600 °C in a tube furnace (LTKC-6-12) under N2 protection were obtained. In addition, feedstock without carbon nanomaterials was used to produce pristine biochar under the same pyrolysis conditions (i.e., 600 °C for 1 h in an N2 environment). The pristine biochar and biochar nanocomposites were marked as CS and CS-CNT, respectively. The biochar sorbents were washed several times with distilled water to remove potential impurities, oven-dried, and stored in containers for subsequent use. The physicochemical properties of CS and CS-CNT are presented in Table 1.| Sample | Content (%) | Surface area (m2 g−1) | Pore volume (cm3 g−1) | ||||
|---|---|---|---|---|---|---|---|
| C | H | O | N | Ash | |||
| CS | 83.15 | 2.28 | 8.71 | 0.89 | 4.97 | 193.52 | 0.077 |
| CS-CNT | 85.89 | 1.63 | 5.53 | 0.64 | 6.31 | 231.60 | 0.09 |
| Ash composition (wt%) | ||||||||
|---|---|---|---|---|---|---|---|---|
| Sample | CaO | MgO | SiO2 | MnO | Al2O3 | Fe2O3 | Na2O | ZnO |
| CS | 54.99 | 27.37 | 3.77 | 1.69 | 0.99 | 0.42 | 0.02 | 0.25 |
| CS-CNT | 46.04 | 20.28 | 7.11 | 1.2 | 6.43 | 5.83 | 0.80 | 0.28 |
2.3 Characterization
The Brunauer–Emmett–Teller (BET) method was applied to measure the specific surface area and pore volume of the biochar samples by a surface area and porosity analyzer (Kubo, China). A Fourier transform infrared (FTIR) spectrometer (NEXUS-470, America) produced by Thermo Nicolet Corporation was used to detect surface functional groups in the wavenumber range from 4000 to 400 cm−1. A scanning electron microscope (SEM; Sigma 500 VP, Carl Zeiss AG, Germany) was used to examine the morphology and structure of the samples. The crystalline structures of the biochar samples were characterized by an X-ray diffractometer (X'pert3, PANalytical, The Netherlands).2.4 Adsorption experiments
A stock solution of Pb (500 mg L−1) was prepared for subsequent dilution to expected concentrations in the batch experiments conducted to investigate the adsorption of Pb(II). Sorption experiments for each biochar sample were carried out by mixing 0.03 g of the sorbent with 30 mL of Pb(II) (50 mg L−1) solutions in 100 mL polyethylene plastic bottles at room temperature (22 ± 1 °C) for 24 h. These vessels were rotated at 200 rpm in a mechanical shaker (WH-782, Shanghai Jinghua Technology Instrument Co., Ltd., Shanghai, China). The initial pH of the solution was adjusted by HCl (1 or 0.1 M) and/or NaOH (1 or 0.1 M). Control experiments were performed to investigate the effects of initial Pb(II) concentration (20–200 mg L−1), solution pH (2–8), ionic strength (0.1–1 mol L−1), utilization times (0–4) of the biochar samples, reaction kinetics (0–48 h), and reaction isotherms (288–308 K) on the removal of Pb(II).After the reaction, the suspensions were immediately filtered through 0.22 μm pore size nylon membrane (GE cellulose nylon membrane) filters for later analyses. All treatments were repeated three times, and the results were reported according to average values. The residual Pb(II) concentrations in the filtrates were determined using a flame atomic absorption spectrophotometer (Shimadzu AA-7000). Moreover, in this study, the Langmuir and Freundlich isotherm models were applied to describe the sorption behavior. The equations are described as follows:31,32
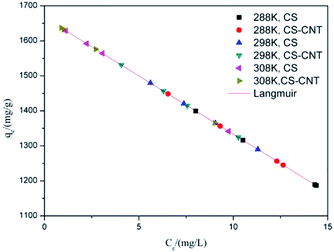
Here, Ce (mg L−1) is the equilibrium concentration of the adsorbate in the solution, qe (mg g−1) is the amount of the metal adsorbed at equilibrium, qm (mg g−1) is the maximum monolayer adsorption capacity, KL (L mg−1) is the Langmuir constant, and KF (mg g−1) and n are the Freundlich constants.
Moreover, two different models were used to simulate the adsorption kinetics in this study. The equations of the two models are as follows:33
Here, qt (mg g−1) and qe (mg g−1) are the amounts of Pb(II) sorbed at time t and at equilibrium, respectively; k1 (10−3/min) and k2 (10−4 g mg−1 min−1) are the rate constants of the pseudo-first-order adsorption and pseudo-second-order adsorption, respectively.
3. Results and discussion
3.1 Characterization of biochar
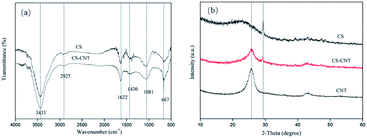
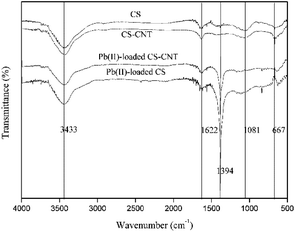
![[double bond, length as m-dash]](https://www.rsc.org/images/entities/char_e001.gif) O group stretching, C
O group stretching, C![[double bond, length as m-dash]](https://www.rsc.org/images/entities/char_e001.gif) C stretching of the aromatic carbons in biochar samples or COO– group stretching, Si–O–Si stretching, and C–O asymmetric stretching, respectively.35–38 As observed for all samples, the spectra of CS and CS-CNT show a stronger band at around 3433 cm−1, which is attributed to the hydroxyl (OH) stretching.39
C stretching of the aromatic carbons in biochar samples or COO– group stretching, Si–O–Si stretching, and C–O asymmetric stretching, respectively.35–38 As observed for all samples, the spectra of CS and CS-CNT show a stronger band at around 3433 cm−1, which is attributed to the hydroxyl (OH) stretching.39
The crystal structures of the biochar samples and carbon nanotubes were characterized by XRD. As seen in Fig. 3(b), there is a diffraction peak at around 25° in the XRD pattern of CS-CNT, which is due to the hexagonal graphite structure40 and is related to the successful attachment of carbon nanotubes to biochar. The intensity of this peak decreased after the CNTs were supported by biochar, which demonstrated the presence of a turbostratic carbon structure with randomly oriented graphitic carbon layers.41 Besides, there is a similar peak at around 28° in the XRD patterns of both the CS and CS-CNT samples; the sharp peak represents the formation of turbostratic graphite crystallites.42,43
3.2 Effects of different conditions on Pb(II) removal
| Type | Temperature (K) | Langmuir model | Freundlich model | ||||
|---|---|---|---|---|---|---|---|
| qm | kL | R2 | KF | 1/n | R2 | ||
| CS | 288 | 990.10 | 0.404 | 0.998 | 2554.24 | −0.286 | 0.988 |
| 298 | 1143.81 | 0.735 | 0.997 | 2082.24 | −0.195 | 0.975 | |
| 308 | 1294.44 | 2.631 | 0.998 | 1690.03 | −0.094 | 0.873 | |
| CS-CNT | 288 | 1078.13 | 0.569 | 0.998 | 2244.26 | −0.231 | 0.984 |
| 298 | 1214.36 | 1.050 | 0.997 | 1915.11 | −0.154 | 0.954 | |
| 308 | 1334.65 | 4.131 | 0.999 | 1643.15 | −0.077 | 0.885 | |
As shown in Table 3, the Pb(II) sorption kinetics can better fit the pseudo-second-order model than the pseudo-first-order model, the R2 values are between 0.99 and 1.0, and Qe is nearly equal to the equilibrium value. Pb(II) ions passed into the internal surface of the biochar samples via liquid-film controlled diffusion. Hence, the adsorption of Pb(II) on CS and CS-CNT might be controlled by chemisorption including complexation, electrostatic attraction, and cation exchange.47 Previous studies have demonstrated that both the biochar matrix and the carbon nanoparticles of the nanocomposites contribute to the sorption of heavy metals from aqueous solutions, which may complicate the sorption process and mechanism.48 In addition, the functional groups on the internal and outer surfaces of the biochar samples may bind Pb(II) ions via “π–π dispersion interactions” and “donor–acceptor effect”.49
| Sorbents | Equilibrium value | Pseudo first-order | Pseudo second-order | ||||
|---|---|---|---|---|---|---|---|
| k1 | qt | R2 | k2 | qe | R2 | ||
| CS | 1568.25 | 1.9 | 171.90 | 0.97403 | 0.454 | 1572.33 | 0.99989 |
| CS-CNT | 1641.26 | 1.3 | 151.05 | 0.95243 | 1.38 | 1640.42 | 0.99998 |
3.3 Mechanisms
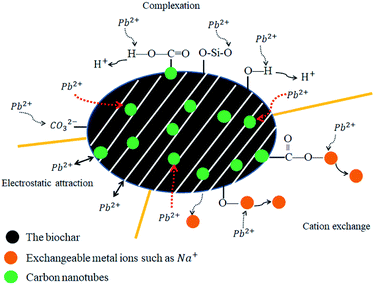
The results of this study showed that the combination of carbon nanotubes with biochar could effectively improve the sorption capacity of Pb(II) in an aqueous environment. Previous studies have also demonstrated that other nanocomposites such as sand-coated carbon nanomaterials show excellent adsorption ability for heavy metals.60,61 However, other previous studies have shown that both the biochar matrix and the carbon nanoparticles of the nanocomposites contribute to the adsorption of heavy metals, which may complicate the adsorption process and mechanism.25The FTIR spectra obtained before and after the sorption of Pb(II) on CS and CS-CNT are presented in Fig. 10. After Pb(II) adsorption, the band intensity of –OH (3433 cm−1) decreased and the Si–O–Si bending band (1081 cm−1) almost disappeared, indicating that Pb(II) adsorbed on CS and CS-CNT through complexation with oxygen-containing functional groups. On the other hand, a new band at 1394 cm−1 representing the covalent Pb–CO3 bond appeared in the spectra of CS and CS-CNT after the adsorption of Pb(II).62 As shown in Fig. 11, the possible mechanisms of Pb(II) removal by biochar-supported nanocomposites include complexation with oxygen-containing functional groups of the sorbents, cation exchange, and electrostatic attraction with the surface of the biochar samples.23,63,64 In addition, several studies have shown that the functional groups, such as hydroxyl groups (–COOH) and hydroxyl groups (–OH), on the biochar samples can form strong complexes with Pb(II) by the “π–π dispersion interactions” and “donor–acceptor effect”.19,49,65 Herein, the adsorption capacity of CS-CNT was higher than that of CS.
4. Conclusions
Herein, novel nanocomposites were successfully prepared via the direct pyrolysis of the chestnut shells pre-treated with corresponding carbon nanomaterials and used for the adsorption of Pb(II). Compared with pristine biochar, the biochar-supported nanomaterials had the highest specific surface area and porosity, which were advantageous to the adsorption process.CS-CNT could efficiently remove Pb(II) from water under the conditions of the Pb(II) concentration of 50 mg L−1 and the pH value of 5. The adsorption process was fast in the initial 15 min and reached equilibrium at about 12 h. The higher concentration of NaCl had a positive effect on Pb(II) removal; this may be due to the binding sites provided by Na+ and Cl−. With respect to the adsorption isotherms of Pb(II) on the biochar samples, the Langmuir model could better stimulate the sorption process. CS and CS-CNT with a high correlation coefficient value (0.997–0.9997) exhibited a mono-layer adsorption behavior. The adsorption process could be well-defined via the pseudo-second-order model (0.99–1.0). The adsorption of Pb(II) on CS and CS-CNT might be controlled by chemisorption including complexation, electrostatic attraction, and cation exchange. The adsorption–desorption experimental results indicate that CS-CNT has stable and excellent sorption ability for heavy metals and huge application value. These carbon nanomaterials are promising sorbents for the treatment and remediation of metal contaminants.
Conflicts of interest
There are no conflicts of interest to declare.Acknowledgements
This research was supported by the National Natural Science Fund of China (no. 31672314 and no. 31700433).References
- X. Huang, H. Zhao, G. Zhang, J. Li, Y. Yang and P. Ji, Chemosphere, 2020, 242, 125148 CrossRef PubMed.
- A. Naeem, M. T. Saddique, S. Mustafa, Y. Kim and B. Dilara, J. Hazard. Mater., 2009, 168, 364–368 CrossRef CAS PubMed.
- Y. Zhou, X. Liu, L. Tang, F. Zhang, G. Zeng, X. Peng, L. Luo, Y. Deng, Y. Pang and J. Zhang, J. Hazard. Mater., 2017, 333, 80–87 CrossRef CAS.
- Y. Zhou, F. Zhang, L. Tang, J. Zhang, G. Zeng, L. Luo, Y. Liu, P. Wang, B. Peng and X. Liu, Sci. Rep., 2017, 7, 43831 CrossRef.
- F. Fu and Q. Wang, J. Environ. Manage., 2011, 92, 407–418 CrossRef CAS.
- M. I. Inyang, B. Gao, Y. Ying, Y. Xue, A. Zimmerman, A. Mosa, P. Pullammanappallil, S. O. Yong and X. Cao, Crit. Rev. Environ. Sci. Technol., 2016, 46, 406–433 CrossRef CAS.
- Z. Yu, Z. Chang, Z. Zheng, H. Liang, X. Li, Z. Yang, M. Chi and G. Zeng, Appl. Surf. Sci., 2017, 403, 413–425 CrossRef CAS.
- C. H. Cheng, J. Lehmann, J. E. Thies, S. D. Burton and M. H. Engelhard, Org. Geochem., 2006, 37, 1477–1488 CrossRef CAS.
- A. Demirbas, J. Anal. Appl. Pyrolysis, 2004, 72, 243–248 CrossRef CAS.
- L. Beesley and M. Marmiroli, Environ. Pollut., 2011, 159, 474–480 CrossRef CAS PubMed.
- H. M. S. K. Herath, M. Camps-Arbestain and M. Hedley, Geoderma, 2013, 209–210, 188–197 CrossRef CAS.
- M. Ahmad, A. U. Rajapaksha, J. E. Lim, Z. Ming, N. Bolan, D. Mohan, M. Vithanage, S. L. Sang and S. O. Yong, Chemosphere, 2014, 99, 19–33 CrossRef CAS PubMed.
- Z. Liu, X. Chen, J. Yan, Q. Li, J. Zhang and Q. Huang, Catena, 2014, 123, 45–51 CrossRef CAS.
- T. Wang, C. E. Stewart, C. Sun, Y. Wang and J. Zheng, Catena, 2018, 162, 29–39 CrossRef.
- J. Shi, H. Han and C. Xu, Sci. Total Environ., 2019, 697, 134052 CrossRef CAS PubMed.
- K. Wang, Y. Sun, J. Tang, J. He and H. Sun, Chemosphere, 2020, 241, 125044 CrossRef CAS.
- T. R. Bridle and D. Pritchard, Water Sci. Technol., 2004, 50, 169–175 CrossRef CAS.
- E. B. Ledesma, N. D. Marsh, A. K. Sandrowitz and M. J. Wornat, Energy Fuels, 2002, 16, 1331–1336 CrossRef CAS.
- G. P. Rao, C. Lu and F. Su, Sep. Purif. Technol., 2007, 58, 224–231 CrossRef CAS.
- L. Ouni, A. Ramazani and S. T. Fardood, Front. Chem. Sci. Eng., 2019, 13, 274–295 CrossRef CAS.
- A. A. Farghali, H. A. A. Tawab, S. A. A. Moaty and R. Khaled, J. Nanostruct. Chem., 2017, 7, 101–111 CrossRef CAS.
- S. A. Kosa, G. Al-Zhrani and M. A. Salam, Chem. Eng. J., 2012, 181–182, 159–168 CrossRef CAS.
- M. Inyang, B. Gao, A. Zimmerman, M. Zhang and H. Chen, Chem. Eng. J., 2014, 236, 39–46 CrossRef CAS.
- M. Zhang, B. Gao, Y. Yao, Y. Xue and M. Inyang, Sci. Total Environ., 2012, 435–436, 567–572 CrossRef CAS.
- M. Inyang, B. Gao, A. Zimmerman, Y. Zhou and X. Cao, Environ. Sci. Pollut. Res., 2015, 22, 1868–1876 CrossRef CAS.
- N. Jiang, Y. Xu, Y. Dai, W. Luo and L. Dai, J. Hazard. Mater., 2012, 215–216, 17–24 CrossRef CAS.
- M. I. Inyang, MPhil thesis, Dissertations & Theses - Gradworks, 2013.
- T. Liu, B. Gao, J. Fang, B. Wang and W. X. Cao, RSC Adv., 2016, 6(29), 24314–24319 RSC.
- G. Vázquez, J. González-Alvarez, J. Santos, M. S. Freire and G. Antorrena, Ind. Crops Prod., 2009, 29, 364–370 CrossRef.
- Z. De-yi, G. Wen-hai, H. Cheng-wen, G. X. feng and L. Chun-long, Shaanxi Forest Science and Technology, 2003, 2, 1–3 Search PubMed.
- N. Velmurugan, G. Hwang, M. Sathishkumar, T. K. Choi, K.-J. Lee, B.-T. Oh and Y.-S. Lee, J. Environ. Sci., 2010, 22, 1049–1056 CrossRef CAS.
- G. Ghanizadeh, G. Asgari, A. M. S. Mohammade and M. T. Ghaneian, Fresenius Environ. Bull., 2012, 21, 1296–1302 CAS.
- X. Wang, L. Chen, S. Xia, J. Zhao, J.-M. Chovelon and N. J. Renault, Miner. Eng., 2006, 19, 968–971 CrossRef CAS.
- T. Liu, B. Gao, J. Fang, W. Bing and X. Cao, RSC Adv., 2016, 6, 24314–24319 RSC.
- H. Yuan, T. Lu, Y. Wang, H. Huang and Y. Chen, J. Anal. Appl. Pyrolysis, 2014, 110, 277–284 CrossRef CAS.
- Q. Wang, B. Wang, X. Lee, J. Lehmann and B. Gao, Sci. Total Environ., 2018, 634, 188–194 CrossRef CAS.
- H. Omar R, Environ. Sci. Technol., 2011, 45, 5550 CrossRef.
- P. S. Kumar, S. Ramalingam, V. Sathyaselvabala, S. D. Kirupha, A. Murugesan and S. Sivanesan, Korean J. Chem. Eng., 2012, 29, 756–768 CrossRef CAS.
- S. V. Novais, M. D. O. Zenero, M. S. C. Barreto, C. R. Montes and C. E. P. Cerri, Sci. Total Environ., 2018, 633, 825–835 CrossRef CAS PubMed.
- X. W. Zengsheng Zhang, Y. Wang, S. Xia, L. Chen, Y. Zhang and J. Zhao, J. Environ. Sci., 2013, 25, 1044–1053 CrossRef.
- L. C. A. Oliveira, R. V. R. A. Rios, J. D. Fabris, V. Garg, K. Sapag and R. M. Lago, Carbon, 2002, 40, 2177–2183 CrossRef CAS.
- A. A. Al-Joubori and C. Suryanarayana, J. Mater. Sci., 2018, 53, 7877–7890 CrossRef CAS.
- S. Shi, J. Yang, S. Liang, M. Li, Q. Gan, K. Xiao and J. Hu, Sci. Total Environ., 2018, 628–629, 499–508 CrossRef CAS.
- W. Du, J. Sun, Y. Zan, Z. Zhang, J. Ji, M. Dou and F. Wang, RSC Adv., 2017, 7, 46629–46635 RSC.
- J. Xu, Z. Cao, Y. Zhang, Z. Yuan, Z. Lou, X. Xu and X. Wang, Chemosphere, 2018, 195, 351–364 CrossRef CAS.
- R. Kumar, M. A. Khan and N. Haq, Crit. Rev. Environ. Sci. Technol., 2014, 44, 1000–1035 CrossRef CAS.
- R. Shi, Y. Li, J. Yin and S. Yang, Chin. J. Environ. Eng., 2014, 8, 3428–3432 CAS.
- I. Mandu, G. Bin, Z. Andrew, Z. Yanmei and C. Xinde, Environ. Sci. Pollut. Res., 2014, 22, 1868–1876 Search PubMed.
- M. Vithanage, S. S. Mayakaduwa, I. Herath, S. O. Yong and D. Mohan, Chemosphere, 2016, 150, 781–789 CrossRef CAS PubMed.
- R. Sitko, E. Turek, B. Zawisza, E. Malicka, E. Talik, J. Heimann, A. Gagor, B. Feist and R. Wrzalik, Dalton Trans., 2013, 42, 5682 RSC.
- Y. Xiao, Y. Xue, F. Gao and A. Mosa, J. Taiwan Inst. Chem. Eng., 2017, 80, 114–121 CrossRef CAS.
- D. Kołodyńska, R. Wnętrzak, J. J. Leahy, M. H. B. Hayes, W. Kwapiński and Z. Hubicki, Chem. Eng. J., 2012, 197, 295–305 CrossRef.
- Z. Ying, C. Bo, L. Zhao, L. Sun, G. Yan, J. Li, Y. Fan, Z. Ying, C. Bo and L. Zhao, Appl. Surf. Sci., 2017, 427 Search PubMed.
- X. Liu, D. Lai and Y. Wang, J. Hazard. Mater., 2019, 361, 37–48 CrossRef CAS.
- M. Campinas and M. J. Rosa, J. Colloid Interface Sci., 2006, 299, 520–529 CrossRef CAS PubMed.
- Y. S. Al-Degs, M. I. El-Barghouthi, A. H. El-Sheikh and G. M. Walker, Dyes Pigm., 2008, 77, 16–23 CrossRef CAS.
- H. J. Cui, M. K. Wang, M. L. Fu and E. Ci, J. Soils Sediments, 2011, 11, 1135 CrossRef CAS.
- B. Wang, J. Lehmann, K. Hanley, R. Hestrin and A. Enders, Chemosphere, 2015, 138, 120–126 CrossRef CAS PubMed.
- A. Bogusz, P. Oleszczuk and R. Dobrowolski, Environ. Geochem. Health, 2019, 41, 1663–1674 CrossRef CAS.
- V. Datsyuk, M. Kalyva, K. Papagelis, J. Parthenios, D. Tasis, A. Siokou, I. Kallitsis and C. Galiotis, Carbon, 2008, 46, 833–840 CrossRef CAS.
- W. Gao, M. Majumder, L. B. Alemany, T. N. Narayanan, M. A. Ibarra, B. K. Pradhan and P. M. Ajayan, ACS Appl. Mater. Interfaces, 2011, 3, 1821–1826 CrossRef CAS PubMed.
- T. Zhang, X. Zhu, L. Shi, J. Li and Y. Li, Bioresour. Technol., 2017, 235, 185–192 CrossRef CAS PubMed.
- V. K. Gupta, S. Agarwal and T. A. Saleh, J. Hazard. Mater., 2011, 185, 17–23 CrossRef CAS PubMed.
- V. K. Gupta, I. Tyagi, S. Agarwal, O. Moradi and A. Garshasbi, Crit. Rev. Environ. Sci. Technol., 2016, 46, 93–118 CrossRef CAS.
- G. Zhao, J. Li, X. Ren, C. Chen and X. Wang, Environ. Sci. Technol., 2011, 45, 10454–10462 CrossRef CAS PubMed.
Footnote |
| † The two authors contributed equally. |
| This journal is © The Royal Society of Chemistry 2020 |

