 Open Access Article
Transport properties of polycrystalline SnTe prepared by saturation annealing†
Dorra Ibrahima,
Shantanu Misra a,
Sylvie Migot
 a,
Jaafar Ghanbaja
 a,
Anne Dauscher
 a,
Bernard Malaman
 a,
Christopher Semprimoschnigb,
Christophe Candolfi
 *a and
Bertrand Lenoir
 *a
*a
aInstitut Jean Lamour, UMR 7198 CNRS – Université de Lorraine, 2 allée André Guinier-Campus ARTEM, BP 50840, 54011 Nancy Cedex, France. E-mail: christophe.candolfi@univ-lorraine.fr; bertrand.lenoir@univ-lorraine.fr
bEuropean Space Agency, ESTEC, P. O. Box 299, Keplerlaan 1, 2200 AG Noordwijk, The Netherlands
First published on 6th February 2020
Abstract
Because the binary chalcogenide SnTe is an interesting Pb-free alternative to the state-of-the-art thermoelectric material PbTe, significant efforts were devoted to the optimization of its thermoelectric properties over the last few years. Here, we show that saturation-annealing treatments performed at 823, 873 or 973 K under Sn-rich conditions provide a successful strategy to prepare polycrystalline samples with a controlled concentration of Sn vacancies. Both scanning transmission electron microscopy and Mössbauer spectroscopy demonstrate the absence of Sn-rich areas at the grain boundaries in the saturation-annealed samples. Transport property measurements, performed over a wide range of temperatures (5–800 K), show that this technique enables achieving thermoelectric performances at 800 K similar to those obtained using Sn self-compensation. The three saturation annealing temperatures result in comparable transport properties across the entire temperature range due to similar hole concentrations ranging between 1.0 and 1.5 × 1020 cm−3 at 300 K. As equally observed in samples prepared by other synthetic routes, the temperature dependence of the Hall mobility evidences that charge transport is strongly affected by point-defect scattering caused by the random distribution of Sn vacancies.
Introduction
Devices based on thermoelectric effects enable solid-state conversion of heat into electricity and vice versa.1,2 The conversion efficiency is mostly governed by the dimensionless thermoelectric figure of merit ZT = α2T/ρκ.1,2 Achieving high efficiency at an operating absolute temperature T thus requires materials that simultaneously possess a high thermopower or Seebeck coefficient α, low electrical resistivity ρ and low total thermal conductivity κ. Chalcogenide semiconductors are an historically important class of thermoelectric materials for which, high ZT values have been obtained and optimized through band structure engineering or reduction of the heat transport by nanostructuration.2–10 Among them, PbTe has been continuously investigated over the last few decades and remains one of the best thermoelectric materials for mid-temperature thermoelectric applications in power generation.As a Pb-free analogue to PbTe, SnTe has been for a long time overlooked due to its inherent off-stoichiometry associated with Sn vacancies that result in highly-degenerate transport properties and poor thermoelectric performances.11–33 As in most chalcogenide semiconductors, this defect chemistry depends sensitively on the conditions employed during the growth process and post-treatments, should the samples be in single-crystalline or polycrystalline form.34–37 A careful control of the defect concentration is pivotal in ensuring good reproducibility and meaningful comparison of the transport data between different series of samples.
Saturation annealing is the experimental tool of choice to control deviations from the ideal stoichiometry in semiconductors and to systematically probe the maximum deviation at a given temperature. In addition, this technique allows avoiding the presence of secondary phases which may have a detrimental impact on the transport properties. While this strategy has been widely applied on most state-of-the-art thermoelectric materials in single-crystalline form such as Bi2Te3 or PbTe,2,38–41 this approach has been only scarcely considered on polycrystalline compounds for which the presence of grain boundaries can prevent diffusion of the elements. Here, we demonstrate that this technique can be successfully applied on polycrystalline SnTe. Varying the saturation annealing temperature from 973 down to 823 K under Sn-rich conditions enables controlling the Sn vacancy concentration and hence, the transport properties. In particular, samples with hole concentrations equivalent to those achieved by intentionally introducing Sn excess can be obtained, but without the presence of elemental Sn at the grain boundaries, as demonstrated by scanning transmission electron microscopy and Mössbauer spectroscopy.
Experimental section
Synthesis
Polycrystalline samples of SnTe were first prepared by powder metallurgy. Prior to use, Sn (shots, 99.999%, Alfa Aesar) and Te (powder, 99.999%, 5N+) elements were purified to eliminate oxides. Sn was washed in successive baths of diluted hydrochloric acid and a distilled water–ethanol mixture. Te was purified at 773 K under inert atmosphere in a sealed silica tube. Stoichiometric quantities of these purified elements were loaded into silica tubes sealed under secondary vacuum, heated at 1133 K in 10 h in a rocking furnace and dwelt at this temperature for 5 h. The tubes were then quenched in room-temperature water.The obtained ingots were ground into fine powders before being consolidated by spark plasma sintering in graphite dies at 773 K for 5 min under a pressure of 65 MPa. The experimental density of the cylindrical pellets was determined by weight and dimensions to be higher than 95% of the theoretical density from X-ray diffraction data. Subsequently, the cylindrical pellets were cut with a diamond wire saw into cylinders (10 mm in diameter and 1 mm thickness) and parallelepiped-shaped samples (1.5 × 2 × 7 mm3).
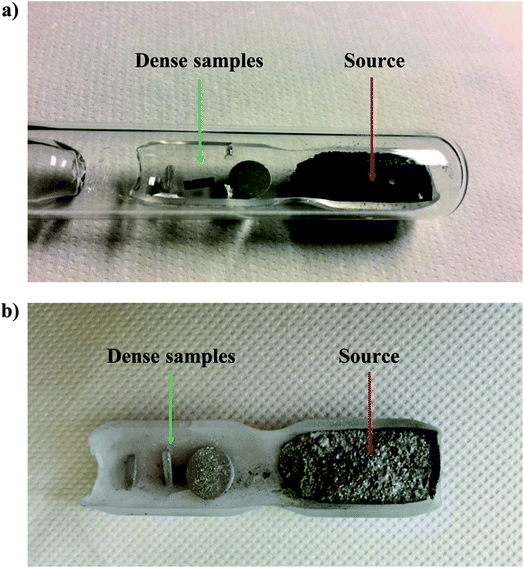
The saturation annealing process was carried out by placing these cut samples in a silica sample holder of 5 cm long on one end while a powdered source was placed on the other end. This sample holder was then placed in a silica tube sealed under secondary vacuum (Fig. 1). The composition of the source used here (Sn55Te45) was chosen to probe the Sn-rich solidus line according to the Sn–Te binary phase diagram. The source was synthesized by a direct reaction of the elements at high temperature in sealed silica tubes. During the saturation-annealing process, the solid, liquid and gaseous phases are all present. According to the Gibbs phase rule under constant temperature and pressure, the variance or degree of freedom of this system F = C − P + 2, where C is the number of components and P is the number of phases, is equal to 1 (C = 2 and P = 3 in the present case). Subjecting the samples to this annealing process at a fixed temperature thus determines their final chemical composition which will correspond to the composition of the solidus on the Sn-rich side of the phase diagram. This technique allows mass exchange between the source and the samples in the vapor phase and can be used to fix the defect concentration which remains constant and homogeneous within the samples. This annealing procedure was performed at 823, 873 and 973 K in a horizontal furnace. The duration of this process has been estimated by considering the self-diffusion profile of Sn in SnTe,42,43 yielding saturation times of 21, 10 and 7 days at 823, 873 and 973 K, respectively.
Structural and chemical characterizations
Power X-ray diffraction was performed at 300 K on a Bruker D8 Advance diffractometer. Lattice parameters were inferred from Rietveld refinements against the PXRD data using Fullprof (Fig. S1–S3 in the ESI†).44High-resolution transmission electron microscopy (HRTEM) and scanning transmission electron microscopy (STEM) experiments were carried out using a JEOL ARM 200F – cold FEG TEM/STEM microscope with an accelerating voltage of 200 keV equipped with double Cs-correctors. The observed thin slice of a sample saturation-annealed at 973 K was prepared by the dual ion beam (FIB) – scanning electron microscope system using the in situ lift-out technique. STEM images were taken in high-angle annular dark-field (HAADF) and annular bright-field (ABF) modes.
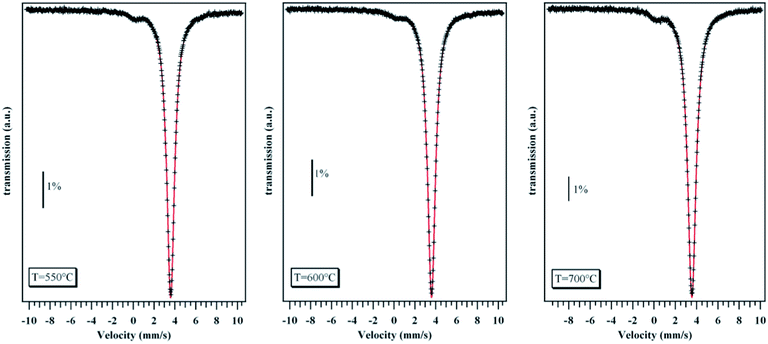
119Sn Mössbauer spectra were recorded at 4.2 K for the three saturation-annealed samples, in order to exalt the response of a possible Sn0 occurrence, in transmission geometry with a spectrometer operating in the constant-acceleration mode. The polycrystalline absorber with natural abundance of 119Sn used for these experiments had a thickness of 10 mg cm−2. The source Ba119SnO3 with a nominal strength of 10 mCi was kept at 300 K to collect the Mössbauer spectra. A palladium foil of 0.5 mm in thickness was used as a critical absorber for Sn X-rays. The velocity was calibrated at 300 K against a 12 μm thick Fe foil. The 119Sn isomer shifts IS reported herein are referred to BaSnO3 at 300 K. The Mössbauer spectra were fitted by a least-squares method assuming Lorentzian-like peak shapes.
Transport properties measurements
Prior to measurements, the surfaces of the samples were slightly polished to remove the shiny crystals that appear during the saturation-annealed process. Hall effect measurements were performed between 5 and 300 K on the saturation-annealed, bar-shaped samples using a five-probe configuration and the AC transport option of a physical property measurement system (PPMS, Quantum Design). Five copper wires were attached onto the samples using silver paint. The transverse electrical resistivity ρxy was measured under magnetic fields μ0H ranging between −1 and +1 T. The Hall resistivity ρH was derived via the expression ρH = [ρxy(+μ0H) − ρxy(−μ0H)]/2 used to dismiss magnetoresistive contributions by taking the antisymmetric part of ρxy under magnetic field reversal. The Hall hole concentrations pH and Hall mobilities μH were inferred from the Hall coefficient RH, determined as the slope of the magnetic field dependence of the Hall resistivity, using the single-band formulas pH = 1/RHe and μH = RH/ρ where e is the elementary charge. Electrical resistivity, thermopower and thermal conductivity were simultaneously measured in the same temperature range and on the same bar-shaped samples using the thermal transport option of the PPMS. Ohmic and thermal contacts were realized by gluing copper bars with conducting silver epoxy.High-temperature measurements (300–800 K) of the electrical resistivity and thermopower were performed using a ZEM-3 apparatus (Ulvac-Riko) on other bar-shaped samples. The thermal diffusivity a was measured on the circular annealed pellets (∼10 mm diameter, ∼1 mm thickness) up to the same temperature with a Netzsch laser flash instrument (LFA 467) under continuous argon flow. The measured thermal diffusivity was used to calculate the total thermal conductivity κ via the formula κ = aCpd where Cp is the specific heat and d is the experimental density. Cp was estimated using the Dulong–Petit law 3NR where N is the number of atoms per formula unit and R is the gas constant. The temperature-dependence of the density was not taken into account in the present case.
Results and discussion
Phase purity of saturation-annealed samples
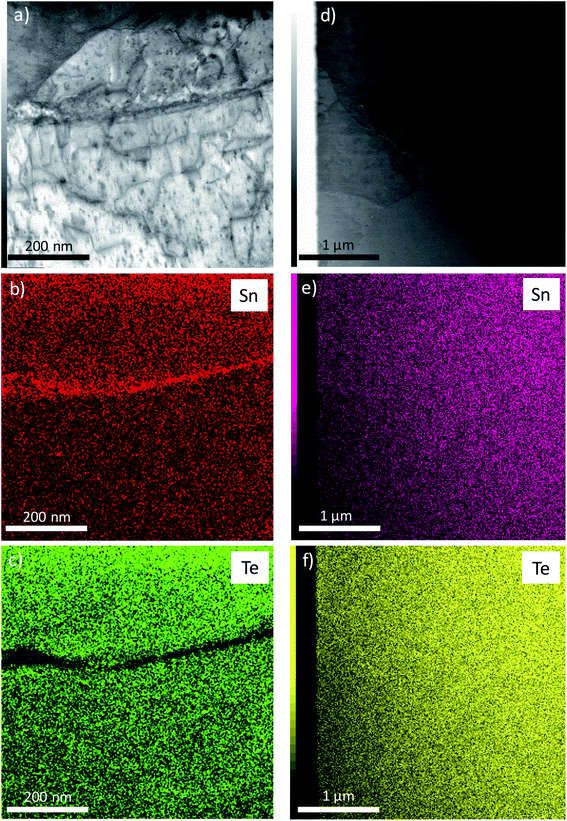
In polycrystalline SnTe samples prepared by conventional melt-quenching or slow cooling, STEM experiments clearly evidenced the presence of excess Sn located at the grain boundaries, the presence of which is undetectable by scanning electron microscopy.45 Unlike these samples, STEM images taken on a thin slice of the sample saturation-annealed at 973 K demonstrate that both Sn and Te are homogeneously distributed with no obvious traces of elemental Sn at the grain boundaries (Fig. 2).Because HRTEM experiments were conducted on one thin slice, we further tried to unveil the possible presence of elemental Sn by 119Sn Mössbauer spectroscopy which is a bulk-sensitive probe. As shown in Fig. 3, the Mössbauer spectra measured at 4.2 K on the three saturation-annealed samples do not show any evident signal of elemental Sn0, in contrast to the spectrum collected on a Sn1.03Te sample prepared by melt-quenching where a slight but detectable asymmetry of the main peak was a clear indication of the presence of a Sn0 phase.45 This absence is a strong evidence that mass exchange between the samples and the source has occurred during the saturation annealing process. These results demonstrate that this method is equally applicable to control the stoichiometry of polycrystalline SnTe without resorting to additional Sn in the nominal composition, the excess of which is located at the grain boundaries.
Transport properties
Fig. 4a and b show the temperature dependence of the electrical resistivity and thermopower of the three samples saturation-annealed at 823, 873 and 973 K. For comparison purposes, the data measured on a SnTe sample prepared by melt-quenching (MQ) have been added.45 While all the samples show similar ρ(T) data characteristic of degenerate p-type semiconductors below 300 K, significant differences emerge at higher temperatures. Above 500 K, the ρ values of the three annealed samples exhibit a steeper rise in temperature compared to the MQ sample. In prior studies, this high-temperature behavior has been attributed to the second, heavy-hole valence band that starts contributing to the transport.11–15 Because this behavior appears in samples with the lowest hole concentrations, these results suggest that the annealing process led to a decrease in the hole concentration, regardless of the annealing temperature. The different annealing temperatures are, however, not equivalent as revealed by the data of the sample annealed at 973 K that are slightly below those of the two other samples which do not show any differences to within experimental uncertainty. This slight but noticeable difference indicates that the concentration of Sn vacancies depends on the annealing temperature, in agreement with the boundaries of the single-phase region determined in prior studies (see below).34,35,46–49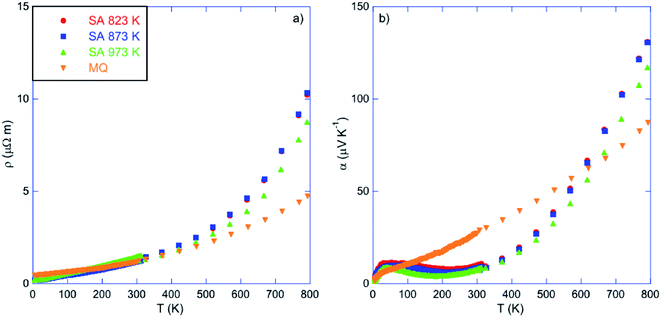 | ||
| Fig. 4 Temperature dependence of (a) the electrical resistivity ρ and (b) thermopower α of the samples annealed at 823, 873 and 973 K. For comparison purposes, data collected on a sample prepared by melt-quenching (MQ) have been added (ref. 45). The color-coded symbols are similar in both panels. | ||
These conclusions hold true when considering the evolution of the thermopower in Fig. 4b. While the MQ sample shows a quasi-linear temperature dependence consistent with a diffusive regime in a strongly degenerate system, the α(T) curves of the annealed samples display more complex variations with temperature. Our prior study has shown that this complex evolution of α(T) is strongly sensitive to the synthesis conditions used, or equivalently, to the hole concentration.45 In particular, the maximum in α that exists in all samples near 35 K has been attributed to a phonon-drag contribution, similarly to what has been observed in PbTe.50,51 Interestingly, the behavior of α(T) below 300 K in the saturation annealed samples differs from that observed in polycrystalline SnTe prepared by conventional synthesis routes.45 The phonon-drag peak near 35 K is followed by a decrease in the α values upon further heating up to about 200–250 K where α(T) starts increasing again with temperature. The strong superlinear variation observed above 250 K likely reflects the temperature-dependent density-of-states effective mass of holes which varies with temperature up to 800 K.16 Both the low-temperature peak α value and the temperature at which α(T) reaches its minimum are sensitive to the annealing temperature, as evidenced by clear differences between the samples annealed at 873 and 973 K.
The marked differences in the electronic transport between the MQ and the annealed samples suggests that the concentration of Sn vacancies is drastically reduced by annealing under Sn-rich conditions. This is confirmed by Hall effect measurements indicating that the hole concentration pH decreases from 1.4 to 1.1 × 1020 cm−3 at 300 K with decreasing the annealing temperature (Table 1 and Fig. 5a). These values are one order of magnitude lower than that measured in the MQ sample (1.1 × 1021 cm−3 at 300 K), confirming the strong reduction in the Sn vacancy concentration. Thus, the saturation annealing process provides a reliable method to control precisely the chemical potential in SnTe through the Sn vacancy concentration, achieved over a large temperature window ranging from 823 up to 973 K.
| Sample | pH (cm−3) | δ (Sn1−δTe) | Composition | at% Te | ath (Å) | aexp (Å) |
|---|---|---|---|---|---|---|
| SnTe MQ | 1.10 × 10²¹ | 0.0176 | Sn0.9824Te | 50.88 | — | 6.3120 |
| SA 823 K | 1.09 × 10²⁰ | 0.0034 | Sn0.9966Te | 50.16 | 6.3221 | 6.3262 |
| SA 873 K | 1.12 × 10²⁰ | 0.0035 | Sn0.9965Te | 50.17 | 6.3218 | 6.3258 |
| SA 973 K | 1.38 × 10²⁰ | 0.0044 | Sn0.9956Te | 50.22 | 6.3200 | 6.3247 |
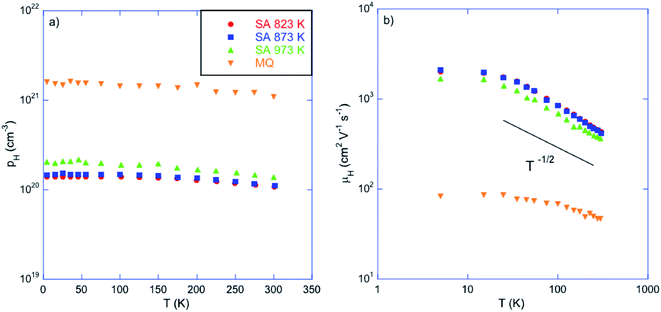 | ||
| Fig. 5 (a) Hall hole concentration pH and (b) Hall mobility μH as a function of temperature for the samples annealed at 823, 873 and 973 K. For comparison purposes, data collected on a sample prepared by melt-quenching (MQ) have been added (ref. 45). The color-coded symbols are similar in both panels. | ||
The temperature dependence of the hole mobility μH, shown in Fig. 5b, confirms the physical picture that emerged from data collected on samples prepared by various synthesis techniques.45 The μH data vary with temperature above 15 K following a T−1/2 law indicating that hole transport is limited by alloy scattering as a result of the random distribution of Sn vacancies within the samples. The absence of elemental Sn in the annealed samples demonstrates that this behavior is not affected by impurities and thus, is an intrinsic characteristic of SnTe. The smoother variation observed in the MQ sample has been attributed to the possible influence of electron–electron scattering shown to play a role in heavily-doped PbTe compounds.50
If we make the reasonable assumption that each Sn vacancy provides two holes and that the Hall factor rH is close to unity in the range of hole concentrations measured in the present case,34,35,45 the pH values can be used to estimate the deviations from the ideal 1![[thin space (1/6-em)]](https://www.rsc.org/images/entities/char_2009.gif) :
:![[thin space (1/6-em)]](https://www.rsc.org/images/entities/char_2009.gif) 1 stoichiometry by applying successively the two relations
1 stoichiometry by applying successively the two relations  and [VSn] = Sδ. In these relations, [VSn] is the concentration of Sn vacancies, S = 1.58 × 1022 cm−3 is the number of Sn sites in the crystal structure and δ represents the deviation from the ideal stoichiometry when considering the chemical formula Sn1−δTe. The results, gathered in Table 1, are in agreement with the relation proposed by Brebrick (ref. 51) that relates the percentage of Te, y, in the chemical formula to the lattice parameter a = 6.3278 Å − 3.54(y − 0.5) where y = 1/(2 − δ). Moreover, the very good agreement with the deviations in the phase diagram determined by various authors (ref. 47–49; Fig. 6) shows that saturation annealing provides a direct access to the maximum deviation at the annealing temperature considered. Furthermore, the pH values are also consistent with the literature data obtained on similarly post-treated single crystals (Fig. 7).52 This further demonstrates that saturation annealing is also effective in polycrystalline SnTe despite the presence of grain boundaries that may have prevented diffusion of the elements from the surface towards the core of the bulk samples.
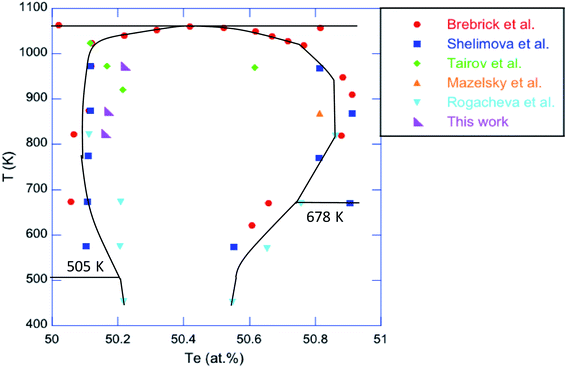 | ||
| Fig. 6 Portion of the Sn–Te phase diagram showing the deviations from the ideal stoichiometry in SnTe determined by various authors (ref. 47–49) and in this work. | ||
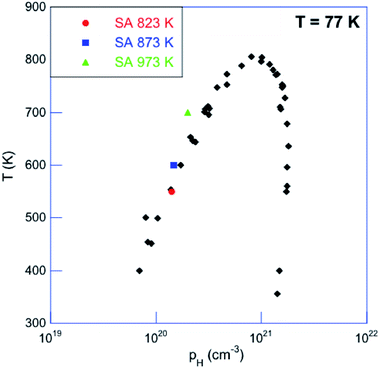 | ||
| Fig. 7 Saturation-annealing temperature as a function of the Hall hole concentration pH measured at 77 K. The literature data obtained on single crystals treated by saturation annealing on both the Sn-rich and Te-rich sides of the solidus line are shown in black (ref. 52). | ||
Fig. 8 shows the temperature dependence of the total thermal conductivity of all the samples. The monotonic increase in the κ values observed in the MQ sample is significantly influenced by saturation annealing. In the three annealed samples, a well-defined Umklapp peak dominates the low-temperature data near 30 K. The magnitude of this peak trends with the Sn vacancy concentration estimated from pH, the lowest pH values being synonymous with the highest peak value. The sensitivity of the Umklapp peak to the vacancy concentration is not restricted to the annealed samples and has been also observed in other SnTe samples irrespective of the synthesis technique employed.45 These variations are due to the Sn vacancies that act as efficient point-defect scattering centers which directly affects the phonon transport at low temperatures. This is confirmed by a fit of the low-temperature κL(T) data to the Debye–Callaway model (Fig. 9; the equations used can be found in the ESI†) which shows that the parameter A describing point-defect scattering scales as δ(1 − δ) (see Table 2 for the values of the fitting parameters).
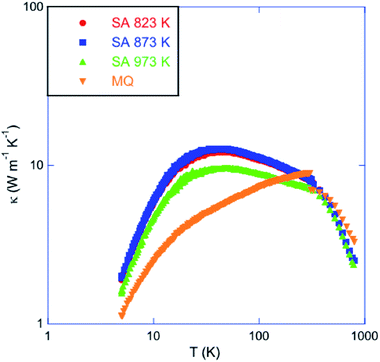 | ||
| Fig. 8 Temperature dependence of the total thermal conductivity κ of the samples treated at 823, 873 and 973 K. For comparison purposes, data collected on a sample prepared by melt-quenching (MQ) have been added (ref. 45). | ||
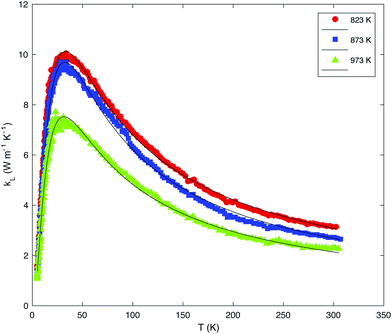 | ||
| Fig. 9 Fit of the lattice thermal conductivity κL of the saturation-annealed samples to the Debye–Callaway model represented as a solid black curve. κL has been obtained by subtracting the electronic contribution κe estimated using the Wiedemann–Franz law κe = LT/ρ. The temperature-dependence of the Lorenz number has been calculated assuming a single-parabolic band model which provides a reasonable approximation below 300 K for these compounds (see ref. 45). | ||
| Sample | L (μm) | A (10−42 s3) | B (10−18 s K−1) |
|---|---|---|---|
| SnTe (MQ) | 1.5 | 42 | 1.3 |
| SA 823 K | 1.8 | 7.3 | 5.8 |
| SA 873 K | 1.5 | 6.8 | 7.0 |
| SA 973 K | 1.5 | 10 | 8.5 |
Fig. 10 shows the evolution of the ZT values as a function of temperature. The peak ZT value achieved in this series (0.55 at 800 K) is similar for the three annealed samples to within experimental uncertainty and slightly higher than that obtained in the MQ sample for which a maximum value of 0.4 is obtained at 800 K. The saturation annealing method thus yields samples with thermoelectric performances comparable to those achieved by introducing excess Sn in the nominal composition (maximum ZT of 0.65 at 800 K),11,33 but without the presence of elemental Sn at the grain boundaries.
 | ||
| Fig. 10 Dimensionless thermoelectric figure of merit ZT as a function of temperature of the samples annealed at 823, 873 and 973 K. For comparison purposes, data collected on a sample prepared by melt-quenching (MQ) have been added (ref. 45). | ||
Conclusion
We reported on the successful control of the hole concentration in polycrystalline SnTe by subjecting samples to saturation-annealing treatments at 823, 873 and 973 K. The absence of elemental Sn in the annealed samples, evidenced by a combination of STEM and Mössbauer spectroscopy, demonstrates the effectiveness of the saturation-annealing method in polycrystalline samples to carefully control the stoichiometry of the material without introducing excess Sn during the synthesis process. Transport properties measurements performed on the three annealed samples are consistent with a significant reduction in the Sn vacancy concentration that directly controls the hole concentration. The absence of elemental Sn in these samples further confirm that several important traits observed in samples prepared by conventional methods such as the phonon-drag contribution to the thermopower below 100 K or the transport limited by alloy scattering are not side effects of impurities but are intrinsic to polycrystalline SnTe. Of note, the peak ZT values achieved in the annealed samples are comparable to those obtained by intentionally introducing excess Sn in the nominal composition. Although this last strategy appears as more straightforward than saturation annealing to produce SnTe samples with optimum thermoelectric properties, the careful control of the defect concentration offered by this technique enables probing the phase boundaries at a given temperature. This technique, widely employed in the past decades to control and optimize the thermoelectric properties of state-of-the-art thermoelectric materials, should be applicable in SnTe samples substituted by various elements and more generally, is an essential tool to obtain reliable and reproducible results on chalcogenide semiconductors.Conflicts of interest
There are no conflicts of interest to declare.Acknowledgements
The authors thank the financial support of the European Space Agency under NPI contract no. 40001134346/15/NL/RA and of the Région Lorraine under the contract DPR-NT No. 2015-9337.References
- H. J. Goldsmid, in Thermoelectric Refrigeration, Springer, New York, 1964 Search PubMed.
- Thermoelectrics and its Energy Harvesting, ed. D. M. Rowe, CRC Press, 2012 Search PubMed.
- J. P. Heremans, V. Jovovic, E. S. Toberer, A. Saramat, K. Kurosaki, A. Charoenphakdee, S. Yamanaka and G. J. Snyder, Science, 2008, 321, 554 CrossRef CAS PubMed.
- J.-S. Rhyee, K. H. Lee, S. M. Lee, E. Cho, S. I. Kim, E. Lee, Y. S. Kwon, J. H. Shim and G. Kotliar, Nature, 2009, 459, 965 CrossRef CAS PubMed.
- J.-B. Vaney, J. Carreaud, G. Delaizir, A. Pradel, A. Piarristeguy, C. Morin, E. Alleno, J. Monnier, A. P. Gonçalves, C. Candolfi, A. Dauscher and B. Lenoir, Adv. Electron. Mater., 2015, 1, 1400008 CrossRef.
- J.-B. Vaney, J. Carreaud, G. Delaizir, A. Piarristeguy, A. Pradel, E. Alleno, J. Monnier, E. B. Lopes, A. P. Gonçalves, A. Dauscher, C. Candolfi and B. Lenoir, J. Mater. Chem. C, 2016, 4, 2329 RSC.
- B. Wiendlocha, J.-B. Vaney, C. Candolfi, A. Dauscher, B. Lenoir and J. Tobola, Phys. Chem. Chem. Phys., 2018, 20, 12948 RSC.
- T.-R. Wei, G. Tan, X. Zhang, C.-F. Wu, J.-F. Li, V. P. Dravid, G. J. Snyder and M. G. Kanatzidis, J. Am. Chem. Soc., 2016, 138, 8875 CrossRef CAS PubMed.
- G. Dennler, R. Chmielowski, S. Jacob, F. Capet, P. Roussel, S. Zastrow, K. Nielsch, I. Opahle and G. K. H. Madsen, Adv. Energy Mater., 2014, 4, 1301581 CrossRef.
- J. Shen, Z. Chen, S. Lin, L. Zheng, W. Li and Y. Pei, J. Mater. Chem. C, 2016, 4, 209 RSC.
- G. Tan, L.-D. Zhao, F. Shi, J. W. Doak, S.-H. Lo, H. Sun, P. Wang, C. Wolverton, V. P. Dravid, C. Uher and M. G. Kanatzidis, J. Am. Chem. Soc., 2014, 136, 7006 CrossRef CAS PubMed.
- G. Tan, F. Shi, S. Hao, H. Chi, L.-D. Zhao, C. Uher, C. Wolverton, V. P. Dravid and M. G. Kanatzidis, J. Am. Chem. Soc., 2015, 137, 5100 CrossRef CAS PubMed.
- G. Tan, F. Shi, S. Hao, H. Chi, T. P. Bailey, L.-D. Zhao, C. Uher, C. Wolverton, V. P. Dravid and M. G. Kanatzidis, J. Am. Chem. Soc., 2015, 137, 11507 CrossRef CAS PubMed.
- G. Tan, F. Shi, J. W. Doak, H. Sun, L.-D. Zhao, P. Wang, C. Uher, C. Wolverton, V. P. Dravid and M. G. Kanatzidis, Energy Environ. Sci., 2015, 8, 267 RSC.
- G. Tan, W. G. Zeier, F. Shi, P. Wang, G. J. Snyder, V. P. Dravid and M. G. Kanatzidis, Chem. Mater., 2015, 27, 7801 CrossRef CAS.
- M. Zhou, Z. M. Gibbs, H. Wang, Y. Han, C. Xin, L. Li and G. J. Snyder, Phys. Chem. Chem. Phys., 2014, 16, 20741 RSC.
- J. He, X. Tan, J. Xu, G.-Q. Liu, H. Shao, Y. Fu, X. Wang, Z. Liu, J. Xu, H. Jiang and J. Jiang, J. Mater. Chem. A, 2015, 3, 19974 RSC.
- A. Banik, U. S. Shenoy, S. Anand, U. W. Waghmare and K. Biswas, Chem. Mater., 2015, 27, 581 CrossRef CAS.
- Q. Zhang, B. Liao, Y. Lan, K. Lukas, W. Liu, K. Esfarjani, C. Opeil, D. Broido, G. Chen and Z. Ren, Proc. Natl. Acad. Sci. U. S. A., 2013, 110, 13261 CrossRef CAS PubMed.
- Z. Zhou, J. Yang, Q. Jiang, Y. Luo, D. Zhang, Y. Ren, X. He and J. Xin, J. Mater. Chem. A, 2016, 4, 13171 RSC.
- L.-D. Zhao, X. Zhang, H. Wu, G. Tan, Y. Pei, Y. Xiao, C. Chang, D. Wu, H. Chi, L. Zheng, S. Gong, C. Uher, J. He and M. G. Kanatzidis, J. Am. Chem. Soc., 2016, 138, 2366 CrossRef CAS PubMed.
- R. Al Rahal Al Orabi, J. Hwang, C.-C. Lin, R. Gautier, B. Fontaine, W. Kim, J.-S. Rhyee, D. Wee and M. Fornari, Chem. Mater., 2017, 29, 612 CrossRef CAS.
- L. Zhang, J. Wang, Z. Cheng, Q. Sun, Z. Li and S. Dou, J. Mater. Chem. A, 2016, 4, 7936 RSC.
- A. Banik, B. Vishal, S. Perumal, R. Datta and K. Biswas, Energy Environ. Sci., 2016, 9, 2011 RSC.
- R. Al Rahal Al Orabi, N. A. Mecholsky, J. Hwang, W. Kim, J.-S. Rhyee, D. Wee and M. Fornari, Chem. Mater., 2016, 28, 376 CrossRef CAS.
- L. Wang, X. Tan, G. Liu, J. Xu, H. Shao, B. Yu, H. Jiang, S. Yue and J. Jiang, ACS Energy Lett., 2017, 2, 1203 CrossRef CAS.
- W. Li, L. Zheng, B. Ge, S. Lin, X. Zhang, Z. Chen, Y. Chang and Y. Pei, Adv. Mater., 2017, 29, 1605887 CrossRef PubMed.
- N. Wang, D. West, J. Liu, J. Li, Q. Yan, B.-L. Gu, S. B. Zhang and W. Duan, Phys. Rev. B: Condens. Matter Mater. Phys., 2014, 89, 045142 CrossRef.
- L. Zheng, W. Li, S. Lin, J. Li, Z. Chen and Y. Pei, ACS Energy Lett., 2017, 2, 563 CrossRef CAS.
- L. Hu, Y. Zhang, H. Wu, J. Li, Y. Li, M. McKenna, J. He, F. Liu, S. J. Pennycook and X. Zeng, Adv. Energy Mater., 2018, 8, 1802116 CrossRef.
- J. Q. Li, S. Huang, Z. P. Chen, Y. Li, S. H. Song, F. S. Liu and W. Q. Ao, Phys. Chem. Chem. Phys., 2017, 19, 28749 RSC.
- S. Roychowdhury, U. S. Shenoy, U. V. Waghmare and K. Biswas, J. Mater. Chem. C, 2017, 5, 5737 RSC.
- D. Ibrahim, V. Ohorodniichuk, C. Candolfi, C. Semprimoschnig, A. Dauscher and B. Lenoir, ACS Omega, 2017, 2, 7106 CrossRef CAS PubMed.
- R. F. Brebrick and A. J. Strauss, Phys. Rev., 1963, 131, 104 CrossRef.
- R. F. Brebrick, J. Phys. Chem. Solids, 1963, 24, 27 CrossRef CAS.
- J. A. Kafalas, R. F. Brebrick and A. J. Strauss, Appl. Phys. Lett., 1964, 4, 93 CrossRef CAS.
- D. M. Chigikov and V. P. Schastliviy, in Tellure and Tellurides, Nauka, Moscow, 1966 Search PubMed.
- J. P. Fleurial, L. Gailliard, R. Triboulet, H. Scherrer and S. Scherrer, J. Phys. Chem. Solids, 1988, 49, 1237 CrossRef CAS.
- R. F. Brebrick, J. Phys. Chem. Solids, 1969, 30, 719 CrossRef CAS.
- R. F. Brebrick and E. Gubner, J. Chem. Phys., 1962, 36, 1283 CrossRef CAS.
- C. Hewes, M. S. Adler and S. D. Senturia, J. Appl. Phys., 1973, 44, 1327 CrossRef CAS.
- H. Scherrer, G. Pineau and S. Scherrer, Phys. Lett., 1979, 75, 118 CrossRef.
- H. Scherrer, S. Weber and S. Scherrer, Phys. Lett., 1980, 77, 189 CrossRef.
- J. Rodriguez-Carjaval, Phys. B, 1993, 192, 55 CrossRef.
- D. Ibrahim, C. Candolfi, S. Migot, J. Ghanbaja, A. Dauscher, B. Malaman, C. Semprimoschnig and B. Lenoir, Phys. Rev. Mater., 2019, 3, 085404 CrossRef CAS.
- S. M. Tairov, B. F. Ormont and N. O. Sostak, Bulletin of the Academy of Sciences of the USSR, Inorganic Materials series, 1970, 6, 1584 CAS.
- R. Maselsky and M. S. Lubell, Adv. Chem. Ser., 1963, 39, 210 CrossRef.
- E. I. Rogacheva, G. V. Gorne, N. K. Zhigareva and A. B. Ivanova, Inorg. Mater., 1991, 27, 194 Search PubMed.
- Y. I. Ravich, Semiconducting Lead Chalcogenides, Plenum Press, New York, NY, 1979, and references therein Search PubMed.
- C. M. Jaworski, M. D. Nielsen, H. Wang, S. N. Girard, W. Cai, W. D. Porter, M. G. Kanatzidis and J. P. Heremans, Phys. Rev. B: Condens. Matter Mater. Phys., 2013, 87, 045203 CrossRef.
- R. F. Brebrick, J. Phys. Chem. Solids, 1971, 32, 551 CrossRef CAS.
- Y. G. Sha and R. F. Brebrick, J. Electron. Mater., 1989, 18, 421 CrossRef CAS.
Footnote |
| † Electronic supplementary information (ESI) available. See DOI: 10.1039/c9ra10841f |
| This journal is © The Royal Society of Chemistry 2020 |

![[3 with combining macron]](https://www.rsc.org/images/entities/char_0033_0304.gif)