 Open Access Article
A geopolymer route to micro- and meso-porous carbon†
Yi-Rong Pei a,
Jae-Hun Yang
 b,
Goeun Choi
 c and
Jin-Ho Choy
 *cd
*cd
aDepartment of Chemistry and Nanoscience, Ewha Womans University, Seoul 03760, Korea
bGlobal Innovative Center for Advanced Nanomaterials (GICAN), School of Engineering, Faculty of Engineering and Built Environment, The University of Newcastle, Callaghan, New South Wales 2308, Australia
cIntelligent Nanohybrid Materials Laboratory (INML), Institute of Tissue Regeneration Engineering (ITREN), Dankook University, Cheonan 31116, Korea. E-mail: jhchoy@dankook.ac.kr
dTokyo Tech World Research Hub Initiative (WRHI), Institute of Innovative Research, Tokyo Institute of Technology, Yokohama 226-8503, Japan
First published on 13th February 2020
Abstract
Hexagonal and wormhole-type mesoporous geopolymers were developed by controlling the concentration of a structure directing agent (cetrimonium bromide, CTAB) with fixed ratios of Si/Al, KOH/(Si + Al), and H2O/(Si + Al), and their detailed porous structures were confirmed by TEM, N2 adsorption–desorption and X-ray diffraction measurements. The as-prepared geopolymers were then used as templates to replicate porous carbons with various structures and porosities for CO2 adsorption. To understand the correlation between the CO2 adsorptivity and porous structures, we tuned the porosity of the geopolymer-templated carbons by modifying the structures of the geopolymers. The porous carbons obtained from the hexagonal-type porous geopolymers were found to be composed of the aggregates of carbon nanowires exhibiting large particles, while those obtained from the wormhole-like porous geopolymers were determined to be wormhole type as well, as evidenced by TEM and X-ray diffraction studies. According to the CO2 adsorption isotherms of the porous carbons, the aggregates of carbon nanowires exhibited the highest CO2 adsorptivity due to their highest microporosity and largest specific surface area.
Introduction
Porous carbon is the most extensively studied field in material science.1,2 The well-known reaction methods to obtain porous carbons often involve nano-replication processes with carbon sources (e.g., sucrose, glucose, furfuryl alcohol), which generally infiltrate the pores of conventional templates such as MCM-48, SBA-1, SBA-15, and KIT-6 type silicas as well as zeolites. Based on these template routes, various types of carbons with micro- and meso-pores have been suggested.3–6According to previous studies, tetraethyl orthosilicate (TEOS) is frequently selected as the Si source for preparing porous silicas such as SBA-15 and KIT-6; these porous silica networks are fabricated in acidic solutions to induce the catalytic polymerization of silicon alkoxide oligomers, resulting in the formation of well-ordered mesoporous structures of silica–organic networks.7–9
However, these processes are not cost-effective due to the high price of TEOS; therefore, many attempts have been made to develop a low-cost process for silica synthesis with inexpensive precursors, such as water glass and ashes.7,10
Very recently, we were able to report a novel porous geopolymer (Ewha Porous Geopolymer-1, EPG-1) route to porous carbon (Ewha Porous Carbon-1, EPC-1) as a CO2 uptake material.11 Traditionally, geopolymers are considered to be flame-resistant materials due to their ceramic-like properties and are also considered to be alternatives to organic polymers because of their outstanding mechanical properties and eco-friendly characteristics.12 However, we came up with the idea that geopolymers can be ideal templates due to their porous nature and a cost-effective silicon source as well. According to our previous research, an attempt was made to tailor the porosity of geopolymers for the first time; this was realized by using natural clay kaolinite as the silica source to form ordered porous geopolymers with a structure-directing agent (CTAB). Also, EPC-1 was further developed by replicating the EPG-1 template and was demonstrated to be an efficient CO2 adsorbent. As is well known, large-scale consumption of fossil fuels has become a worldwide problem due to severe global warming.13,14 To overcome this global problem, porous carbon has been suggested as an ideal CO2 adsorbent because of its high adsorption capacity and high specific surface area. In addition to this, porous carbon with micro-porosity has been strongly suggested for CO2 adsorption. In the present study, a novel geopolymer (EPG-2) route to microporous carbon ((EPC-2)) is suggested for efficient CO2 adsorption.
Materials and methods
Materials
Kaolinite (K7375) and fumed silica (S5130, 0.007 μm) were purchased from Sigma-Aldrich. Cetrimonium bromide (CTAB, 99%), potassium hydroxide (KOH, 85%), hydrochloric acid (HCl, 35–37%), sucrose (C12H22O11, EP) and sulfuric acid (H2SO4, 98%) were purchased from Daejung Chemicals. HF (49%) was purchased from J. T. Baker. Air gas and N2 gas were purchased from Daesung Industrial Gases Co. Ltd. All the chemicals were used without further purification.Synthetic procedures
Ewha Porous Geopolymer-2 (EPG-2) was synthesized with the surfactant CTAB as a structure-directing agent and kaolinite as an aluminosilicate source. First, the kaolinite was dehydroxylated at 750 °C for 10 h to derive an amorphous meta-kaolin (Al2Si2O7) which was then further dissolved in a potassium hydroxide solution together with fumed silica as an additional silicon source to induce alumino-silicate oligomer fragments; this was performed at room temperature for 30 minutes, resulting in a viscous suspension. The thus-prepared suspension was then mixed with an aqueous solution of CTAB at 40 °C, stirred vigorously for 4 h at a fixed pH of 10.5 (using 5 M HCl), and further treated under hydrothermal conditions at 100 °C for 24 h. Then, it was cooled to room temperature before filtering and drying to obtain the CTAB/EPG-2 composite, which was finally calcined under air flowing conditions at 550 °C to remove CTAB and obtain the as-designed porous EPG-2. The starting molar composition was 0.25 Al: 0.75 Si: 0.50 KOH: 0.1, 0.5, 0.6 CTAB: 100H2O to synthesize EPG-2; the samples are denoted as EPG-2_0.1, EPG-2_0.5 and EPG-2_0.6, where 0.1, 0.5 and 0.6 represent the ratio of CTAB/(Si + Al).To prepare Ewha Porous Carbon-2 (EPC-2), EPG-2 template was mixed with an aqueous solution containing sucrose and sulfuric acid based on the well-known impregnation method.3,11 For example, 1 g of EPG-2_0.1 (the ratio of CTAB/(Si + Al) = 0.1) was added to a solution in which 0.90 g of sucrose and 0.1 g of H2SO4 were dissolved in 5 g of water; the thus-prepared suspension was then stirred on a hot plate for 6 h at 60 °C. The dough-like phase was further maintained in an oven at 100 °C for 6 h, then at 160 °C for another 6 h. Finally, the sample was ground in a mortar to obtain a powdered form of sucrose-impregnated EPG-2_0.1, heat-treated in a nitrogen flow with a rate of 5 °C min−1 up to 900 °C, and maintained for 6 h to carbonize completely within the pores of EPG-2 to form a hybrid phase of EPG-2/EPC-2. The synthesis of EPC-2 from EPG-2_0.5 (the ratio of CTAB/(Si + Al) = 0.5) and EPG-2_0.6 (the ratio of CTAB/(Si + Al) = 0.6) was also performed according to the same procedure used with EPG-2_0.1. After cooling to room temperature, the EPG-2/EPC-2 hybrids were repeatedly treated in 10% HF/5% HCl solution with stirring for 5 h to dissolve the EPG-2 template into the solution. The undissolved porous carbon (EPC-2) was washed with distilled water several times, filtered and finally dried at 60 °C. The carbon samples obtained were denoted as EPC-2_0.1_S9, EPC-2_0.5_S9 and EPC-2_0.6_S9 according to the corresponding templates of EPG-2_0.1, EPG-2_0.5 and EPG-2_0.6, respectively, with sucrose as the carbon source and carbonization at the sintering temperature of 900 °C.
Physico-chemical characterization
The porous structures of the templates, EPG-2, and their porous carbons, EPC-2, were characterized by XRD, TEM and BET measurements. Powder X-ray Diffraction (PXRD) patterns for all the samples were recorded with a Rigaku D/MAX RINT 2200-Ultima+ diffractometer equipped with Cu-Kα radiation (λ = 1.5418 Å) at 40 kV and 30 mA. Transmission electron microscopy (TEM) images were obtained using a JEOL JEM-2100F at an accelerating voltage of 200 kV. Nitrogen physisorption measurements at 77 K were performed on a BELSORP II mini instrument equipped with liquid nitrogen. The Brunauer–Emmett–Teller (BET) method was used to deduce the surface area (P/P0 = 0.05–0.20), and the total pore volume was taken at P/P0 = 0.99. The mesoporosity and microporosity were analyzed by the Barrett, Joyner, and Halenda (BJH) method and t-plots, respectively. To obtain detailed porosity information throughout the full range of micro-, meso- and macro-pores, we performed non-localized density functional theory (NLDFT) analysis using WIBU-KEY software (Wibu SYSTEMS). Prior to the N2 gas adsorption analysis, all the samples of EPG-2 and EPC-2 were pretreated by degassing at 473 K for 5 h in vacuum (10−3 torr) in order to remove all the moisture and gaseous elements remaining in the pores. The CO2 adsorption measurements for the present porous carbons of EPC-2 were carried out using a BELSORP II mini instrument with a water-circulating temperature controller; the tests were conducted at 273 K. Prior to the CO2 gas adsorption analysis, the present samples of EPC-2 were also pretreated at 473 K for 5 h in vacuum (10−3 torr) for degassing. Carbon K-edge XANES spectra were collected in the total fluorescence yield (TFY) mode at the 10D (XAS-KIST) beamlines of the Pohang Accelerator Laboratory (PAL). All the spectra were collected at room temperature in a vacuum of ∼1.5 × 10⁻⁸ torr. The energy range in grating 2 (G2, 100 to 700 eV) with a core slit size of 100 mm × 100 mm was utilized for the measurements, and a photon energy level of 360 eV was selected for the C 1s data.Results and discussion
Ewha porous geopolymer-2 (EPG-2)
EPG-2 was synthesized according to the steps shown in Scheme 1a: the meta-kaolin was derived from the dehydroxylation of kaolinite and then activated in a basic solution to obtain activated alumino-silicate oligomer fragments, which were then further condensed to form the porous alumino-silicate framework in the presence of CTAB under basic conditions, resulting in the formation of EPG-2 with a hexagonal porous structure after the removal of CTAB.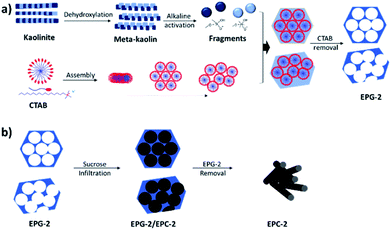 | ||
| Scheme 1 Routes to obtain (a) porous geopolymer from kaolinite and (b) porous carbon from porous geopolymer. | ||
According to the X-ray diffraction patterns shown in Fig. S1,† the crystalline kaolinite was transformed into amorphous meta-kaolin upon dehydroxylation at 750 °C; the templates EPG-2_0.1, EPG-2_0.5 and EPG-2_0.6 were also all found to be amorphous.
Fig. 1 shows X-ray diffraction patterns in the 2θ range of 1.5–10° for EPG-2_0.1–EPG-2_0.6. In the case of EPG-2_0.1, the X-ray powder diffraction pattern shows 3 peaks that are indicative of channel-like pores which are arranged in a hexagonal honeycomb pattern (p6mm) with a high degree of regularity. The d value of the (100) diffraction (2θ100 = 2.11°) was determined to be 4.18 nm, leading to a lattice constant of a = 4.84 nm on the basis of Bragg law (eqn (1)) and a hexagonal-type lattice (eqn (2)).
nλ = 2d![[thin space (1/6-em)]](https://www.rsc.org/images/entities/char_2009.gif) sin sin![[thin space (1/6-em)]](https://www.rsc.org/images/entities/char_2009.gif) θ θ
| (1) |
 | (2) |
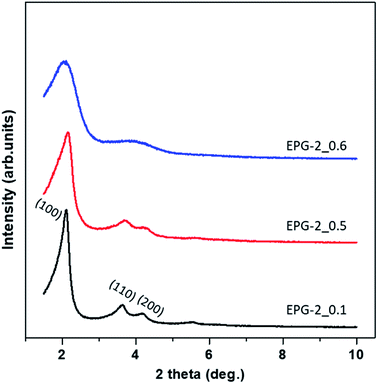 | ||
| Fig. 1 Powder X-ray diffraction patterns for the present geopolymers, EPG-2_0.1, EPG-2_0.5 and EPG-2_0.6, synthesized with molar ratios of CTAB/(Si + Al) = 0.1, 0.5 and 0.6. | ||
As the CTAB/(Si + Al) ratio was increased to 0.5 (EPG-2_0.5), the XRD peaks of the EPG-2 samples changed in terms of lattice contraction and structural disorder; the d values decreased somewhat due to the slight reduction of lattice parameter a. Also, broadening of the diffraction peaks could be observed, indicating a significant decrease in structural order upon increasing the CTAB/(Si + Al) ratio to 0.6 (EPG-2_0.6); this eventually led to a wormhole-like structure.
Analyzing the XRD patterns in detail, EPG-2_0.1 exhibited a sharp peak and two minor peaks, which could be indexed as the (100), (110), and (200) peaks of a 2D hexagonal lattice (p6mm). Upon further increasing the ratio from 0.1 to 0.5 (EPG-2_0.5), the XRD patterns were found to be nearly the same; however, the peak position (2θ100 = 2.16) shifted along with broadening of the peak. Meanwhile, in the case of CTAB/(Si + Al) = 0.6, the hexagonally ordered phase was transformed into another phase with a broad XRD peak with a 2θ angle of around 2.08°, corresponding to the wormhole-like phase.18
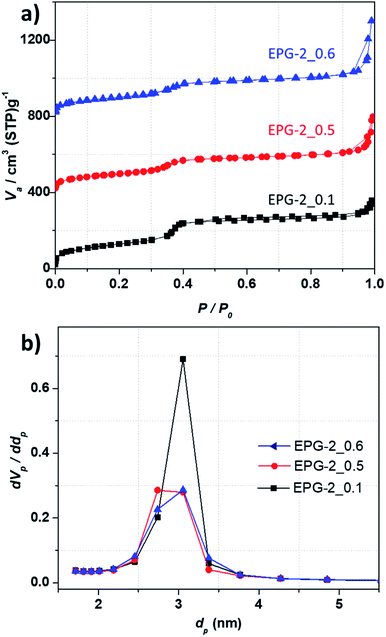
From the N2 adsorption–desorption isotherms for the present geopolymers, porosity parameters were obtained, such as specific surface area, mesopore volume, total pore volume, and pore diameter. As shown in Fig. 2a, all the EPG-2.
The geopolymers showed type-IV adsorption isotherms, suggesting their mesoporous nature, which can be rationalized by the three stages: the first stage is mainly due to monolayer adsorption on the internal surface of the mesopore walls at a low relative pressure (P/P0 < 0.25), and the second stage observed at P/P0 of about 0.35 is owing to capillary condensation with a drastic increase in adsorption; this indicates regularity of the pore sizes, as expected from their similar unit cell parameters. The third stage is the domain of gradual increase in volume with P/P0 over 0.90 due to multilayer adsorption on the outer surface of the particles. The pore size distributions analyzed by the BJH method are shown in Fig. 2b, which shows that the peaks with maxima uniformly cover the pore size range of around 3 nm.
The porous properties of the EPG-2 geopolymers are summarized in Table 1. The BET surface areas for all the samples and their total pore volumes were in the ranges of 357–468 m2 g−1 and 0.52–0.77 cm3 g−1, respectively, with a unique pore size of ∼3 nm. There was a slight declining trend in the BET surface area, mesopore volume, and mesoporosity as the CTAB/(Si + Al) ratio increased. EPG-2_0.1 showed the largest specific surface area (468 m2 g−1) as well as the highest mesoporosity (85%). Upon increasing the CTAB/(Si + Al) ratio to 0.5 and 0.6, greatly decreased specific surface areas of ∼360 m2 g−1 (357–368) and lower mesoporosities (67% and 51%, respectively) were observed, mainly due to the formation of wormhole-like instead of hexagonal structures.
| SBETa (m2 g−1) | Dporeb (nm) | VTotalc (cm3 g−1) | VMesod (cm3 g−1) | Mesoporositye (%) | |
|---|---|---|---|---|---|
| a From the specific surface area evaluated by fitting with the BET equation.b From the main pore diameter from the BJH plot.c From the total pore volume at P/P0 = 0.99.d From the pores with diameters between 2 and 50 nm in the BJH adsorption pore size distribution.e Mesoporosity = (VMeso/VTotal)×100%. | |||||
| EPG-2_0.1 | 468 | 3.0 | 0.53 | 0.45 | 85 |
| EPG-2_0.5 | 357 | 2.9 | 0.52 | 0.35 | 67 |
| EPG-2_0.6 | 368 | 3.0 | 0.77 | 0.39 | 51 |
From the XRD and N2 adsorption results, a structural transformation could be observed upon increasing the CTAB/(Si + Al) ratio from 0.1 to 0.5 and 0.6. Among the three EPG-2 samples, EPG-2_0.1 exhibited the strongest XRD peaks and a sharp pore size distribution curve, revealing its highly ordered porous structure compared to the other samples.
As the CTAB/(Si + Al) ratio was increased to 0.5, EPG-2_0.5 maintained a hexagonal-type mesoporous structure with three significant XRD peaks; however, the peaks were broader and of slightly lower intensity, suggesting partial phase transition, in agreement with the greatly decreased porosity from the N2 adsorption results. In the case of EPG-2_0.6, the pore size of 3 nm remained unchanged but the XRD peaks became much broader, probably due to the fact that the ordered condensation of alumino-silicate oligomers into geopolymers may be interrupted at relatively high concentrations of CTAB, resulting in a less ordered geopolymer with wormhole-like structures, particularly in EPG-2_0.6.
From the above results, it was concluded that there were two mesoporous phases, namely the hexagonal-type ordered structure (EPG-2_0.1), and wormhole-type (EPG-2_0.6), and EPG-2_0.5 was a mixture of both phases.
The morphologies and surface fine structures of the precursor kaolinite, its meta-kaolin and the geopolymers EPG-2_0.1, EPG-2_0.5, and EPG-2_0.6 were studied by TEM analyses, which were in good agreement with the XRD results.
EPG-2_0.1 exhibited ordered hexagonal arrays of mesopores with a uniform pore size of ∼3 nm, which is consistent with the pore size distribution in Fig. 3a. Because the EPG-2_0.1 phase was determined be highly ordered, its model structure was suggested, as shown in Scheme S1;† thus, its wall thickness between mesopores could be calculated to be 1.84 nm on the basis of the a value and Dpore derived from the XRD pattern and BJH analysis, respectively.
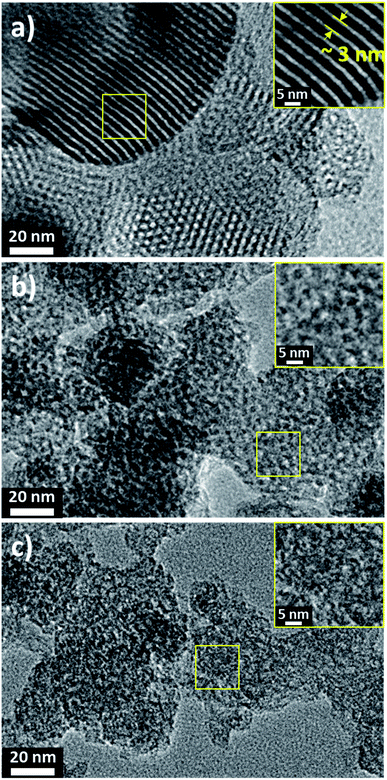 | ||
| Fig. 3 TEM images of geopolymers (a) EPG-2_0.1, (b) EPG-2_0.5 and (c) EPG-2_0.6 synthesized with molar ratios of CTAB/(Si + Al) = 0.1, 0.5 and 0.6, respectively. | ||
Meanwhile, almost no cylindrical arrays or hexagonal orders could be observed in either the EPG-2_0.5 or EPG-2_0.6 samples, as shown in Fig. 3b and c. In the case of EPG-2_0.5, however, only a certain degree of hexagonal porous structure could be observed in the X-ray pattern, demonstrating the presence of the two phases with hexagonal and wormhole-like structures.18 According to the TEM study, it was clearly demonstrated that the image of EPG-2_0.6, corresponding to the wormhole-type structure, was in agreement with the X-ray diffraction analysis results, as shown in Fig. 1. The TEM images of crystalline kaolinite and its amorphous meta-kaolin phase are also shown in Fig. S2† for comparison.
Based on the present synthetic strategy, we were able to prepare geopolymer templates with a pore window of 3 nm with two different pore structures simply by controlling the CTAB/(Si + Al) ratio.
Ewha porous carbon-2 (EPC-2)
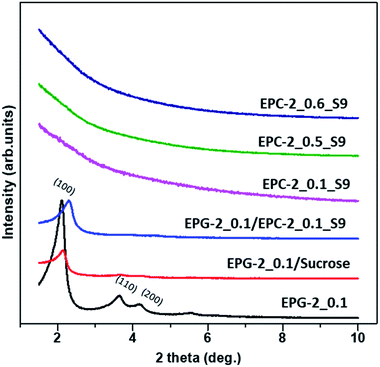
The porous carbons were prepared by carbonizing the infiltrated sucrose in the geopolymers (see Scheme 1b). The template geopolymers, EPG-2_0.1, EPG-2_0.5 and EPG-2_0.6, with hexagonal, mixed and wormhole-like structures, respectively, were used as templates, and the porous carbons from those templates were explored by the well-known impregnation method with sucrose as the carbon source. After the carbonization of sucrose in the pores and the removal of the templates, pure porous carbons could be isolated, and they were named EPC-2_0.1_S9, EPC-2_0.5_S9 and EPC-2_0.6_S9, respectively.Fig. 4 shows the X-ray diffraction patterns of EPG-2 and EPC-2 during the carbon infiltration progress. In the case of EPG-2_0.1, the characteristic XRD pattern of the geopolymer with a hexagonal-type porous structure could be observed. When sucrose infiltrated and was carbonized inside the pores, the hybrid phase of EPG-2_0.1/carbon could be formed; the (100) peak from the hexagonal structure was maintained, but with much lower diffraction intensity due to the effects of pore-filling.
However, the carbon material (designated as EPC-2_0.1_S9) obtained after the template removal by HF etching did not show any Bragg diffraction in the small-angle region, confirming the absence of regular pores of EPC-2_0.1_S9; this is quite similar to MCM-41-templated carbon, which has a featureless XRD pattern.15–17
Like MCM-41, the present EPG-2_0.1 template showed disconnected channel-like pores; consequently, the carbon deposits in its pores should consist of honeycomb arrays of disconnected carbon rods. After the removal of the silica template, these nano-rods can readily collapse; however, the random packing formed disordered and feature-less porous structures.
EPC-2_0.5_S9 and EPC-2_0.6_S9 also showed no diffraction peaks, revealing their non-ordered structures. In the case of EPC-2_0.6_S9, it was replicated from the wormhole-like geopolymer (EPG-2_0.6) and formed the wormhole-like carbon phase as well. In the process of carbon replication through the geopolymer template, EPG-2_0.6, sucrose infiltrated inside the wormhole-like pores. However, carbon formation outside of the pores was inevitable due to partial adsorption of sucrose islands on the external surface of EPG-2_0.6, resulting in the non-ordered porous structure of EPC-2_0.6_S9. In the case of EPC-2_0.5_S9, which was replicated from the mixed structured geopolymer EPG-2_0.5, both rod-type and wormhole-like structures were synthesized, resulting in the non-ordered XRD pattern.
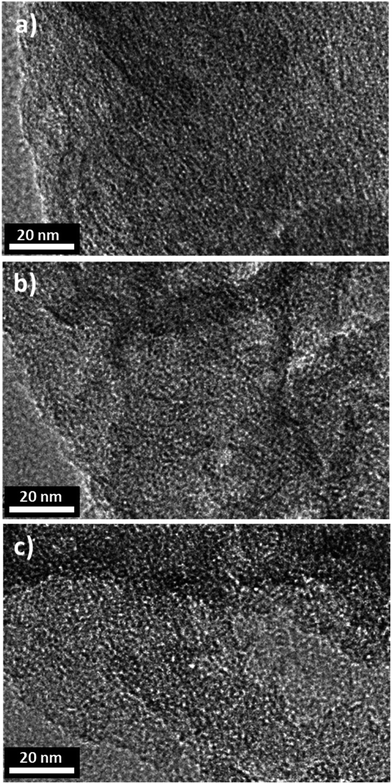
Similar phenomena can be observed from the TEM images in Fig. 5. As shown in Fig. 5a, the carbon particles synthesized inside the pores of EPG-2_0.1 were randomly packed upon removal of the template, similar to the porous carbon replication from MCM-41.15–17 This is surely due to the lack of pore connectivity between the hexagonal parallel mesopores in EPG-2_0.1, which resulted in aggregates of many non-ordered carbon rods in EPC-2_0.1_S9 after removal from the EPG-2_0.1 template.
Meanwhile, EPC-2_0.5_S9 and EPC-2_0.6_S9 showed large aggregated particles with featureless structures (see Fig. 5b and c). Because EPC-2_0.5_S9 consisted of both rod-type and wormhole-like carbon parts due to the formation of pores outside of the geopolymer template, featureless aggregates of carbon nanoparticles were observed. The TEM images are similar in the case of EPC-2_0.6_S9.
According to the nitrogen adsorption isotherm of EPC-2, as shown in Fig. 6a, a hysteresis loop at P/P0 of around 0.5 can be observed; this is due to the formation of secondary porosity in the aggregates of carbon nanorods as a result of the collapse of the periodic carbon structure during the template removal. The drastic increase in adsorption at P/P0 above 0.90 can also be ascribed to the formation of macroporosity upon aggregation of carbon nanorods.
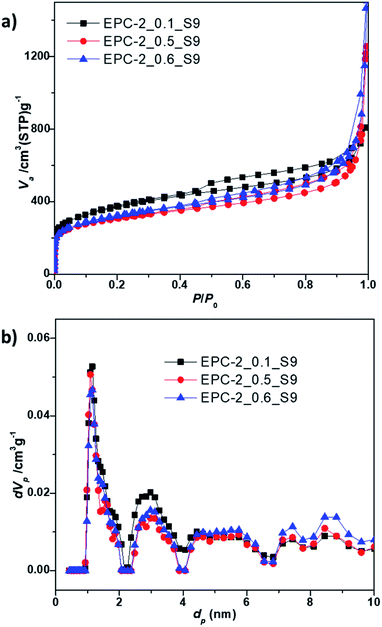 | ||
| Fig. 6 (a) N2 adsorption–desorption isotherms and (b) NLDFT pore size distributions of EPC-2_0.1_S9, EPC-2_0.5_S9 and EPC-2_0.6_S9, respectively. | ||
As shown in Table 2, all the samples showed high specific surface areas of ∼1200 m2 g−1 and large total pore volumes above 1.25 cm3 g−1. The porosity information was analyzed on the basis of the NLDFT method to extract the pore size distributions in detail over the complete range of the pore windows, as shown in Fig. 6b and S3.†
| SBETa (m2 g−1) | Dporeb (nm) | VTotalc (cm3 g−1) | VMicrod (cm3 g−1) | VMeso+Macroe (cm3 g−1) | Microporosityf (%) | CO2 adsorptiong (mmol g−1) | |
|---|---|---|---|---|---|---|---|
| a From the specific surface area evaluated by fitting with the BET equation.b Micropore diameter evaluated from the NLDFT method in the range of < 2 nm.c Total pore volume evaluated from the amount of adsorption at P/P0 = 0.99.d Micropore volume evaluated from the t-plot.e VMeso+Macro = VTotal − VMicro.f Microporosity = (VMicro/VTotal)×100%.g CO2 adsorptivity under 1 atm at 273 K. | |||||||
| EPC-2_0.1_S9 | 1200 | 1.14 | 1.24 | 0.53 | 0.71 | 42 | 3.04 |
| EPC-2_0.5_S9 | 1094 | 1.14 | 1.73 | 0.38 | 1.35 | 22 | 2.77 |
| EPC-2_0.6_S9 | 1120 | 1.14 | 1.91 | 0.37 | 1.54 | 19 | 2.80 |
Moreover, it becomes clear that the present EPC-2 porous carbons contain not only micropores with diameters of 1.14 nm but also meso- and macropores (see Table 2). The micropore volume for EPC-2_0.1_S9 based on the t-plot was determined to be relatively high, with a value of 0.53 cm3 g−1 (microporosity of 42%, as shown in Table 2). On the other hand, EPC-2_0.5_S9 and EPC-2_0.6_S9 showed large pore volumes of 1.73 cm3 g−1 and 1.91 cm3 g−1, respectively, mostly due to the presence of meso- and macropores (see the pore size distributions in Fig. 6b and S3†).
After understanding the detailed pore structures of EPC-2, an attempt was made to apply the present porous carbons as CO2 adsorbents due to their large specific surface areas and pore volumes. All the three carbons contain mainly micropores, with additional mesopores and macropores. Their CO2 adsorptivity was investigated at 273 K, as plotted in Fig. 7.
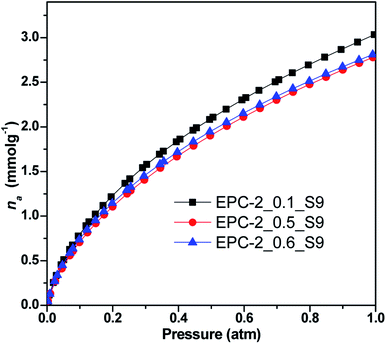 | ||
| Fig. 7 CO2 adsorption isotherms of EPC-2_0.1_S9, EPC-2_0.5_S9 and EPC-2_0.6_S9 at 273 K under pressure up to 1 atm. | ||
As shown in Fig. 7 and Table 2, EPC-2_0.1_S9 was determined to show the highest CO2 adsorptivity of 3.04 mmol g−1 out of the 3 samples due to its highest specific surface area and largest micropore volume; the other two samples, EPC-2_0.5_S9 and EPC-2_0.6_S9, showed similar but slightly lower values of 2.77 and 2.80 mmol g−1, respectively, at 273 K and 1 atm.
In order to understand the chemical bonding nature of the present porous carbons, the C K-edge XANES data were collected in fluorescent mode, as shown in Fig. S4.† The overall spectral features were almost the same, as follows: the main resonance peak at ∼285.8 eV represents the characteristic C 1s → π* transition of aromatic C (C![[double bond, length as m-dash]](https://www.rsc.org/images/entities/char_e001.gif) C).19 The peak at ∼287.8 eV could be identified and assigned as C 1s–σ*/3pC–H of aliphatic C, and the peak at ∼288.7 eV is attributed to 1s → π* of carboxyl C (COOH).19 The three EPC-2 materials exhibited similar patterns. It is therefore concluded that the CO2 adsorptivity of the EPC-2 materials was mainly determined by their microporosity.
C).19 The peak at ∼287.8 eV could be identified and assigned as C 1s–σ*/3pC–H of aliphatic C, and the peak at ∼288.7 eV is attributed to 1s → π* of carboxyl C (COOH).19 The three EPC-2 materials exhibited similar patterns. It is therefore concluded that the CO2 adsorptivity of the EPC-2 materials was mainly determined by their microporosity.
All three carbons exhibited high CO2 adsorptivity compared to other carbon materials appearing in the literature (see Table S1†). Due to the high CO2 capture performance of these samples, they are extremely promising commercial adsorbents for CO2 gas; also, the low-cost process will open the door for the generation of novel porous carbons from different natural clays.
Conclusions
In summary, a geopolymer route to porous carbon has been validated. Compared to the conventional silica template from TEOS, the present method can be considered as the most cost-effective strategy because kaolinite, a clay mineral, used as the silica source for the geopolymer template is abundant in nature and about 400 times less expensive than TEOS. The present geopolymers were respectively determined to be mesoporous with a hexagonal type (p6mm) space group, a wormhole-type structure, and a mixture of the two. Also, their main pore windows are around 3.0 nm in size, as calculated from the combined analyses of N2 adsorption/desorption isotherms and XRD patterns as well as the TEM images. The structural phase transition from hexagonal to wormhole can be derived by increasing the concentration of the structure-directing agent. The porous carbons prepared from mesoporous geopolymer templates were found to be aggregated carbon particles.The present microporous carbons (EPC-2_0.1_S9, EPC-2_0.5_S9 and EPC-2_0.6_S9) were found to have high specific surface areas and pore volumes with certain amounts of additional mesopores and macropores, resulting in effective adsorption capacity. All three carbons exhibited high CO2 adsorptivities of 3.04, 2.77 and 2.80 mmol g−1, respectively; these are much higher than those of commercially available porous carbons, namely, around 6 times higher than those of activated carbons and multiwalled carbon nanotubes. The morphology of EPC-2_0.1_S9 was observed to be featureless aggregates irregularly packed with carbon rods or wires upon removal of the geopolymer template of EPC-2_0.1. In the cases of wormhole-type geopolymer templates (EPG-2_0.5, with wormhole type partly mixed with hexagonal type, and EPG-2_0.6), the porous carbons with inverse structures were successfully replicated from the wormhole-type templates (EPC-2_0.5_S9 and EPC-2_0.6_S9). All these results imply that the present geopolymer route to porous carbon can be a platform technology as the most cost-effective way to develop new porous materials as adsorbents, catalysts, catalyst supports, etc.
Conflicts of interest
There are no conflicts to declare.Acknowledgements
This research was supported by Solvay and through the framework of the international cooperation program managed by the National Research Foundation of Korea (No. 2017K2A9A2A10013104). The experiments at PAL were supported by POSTECH.References
- L.-P. Guo, W.-C. Li, B. Qiu, Z.-X. Ren, J. Du and A.-H. Lu, J. Mater. Chem. A, 2019, 7, 5402 RSC.
- M. Oschatz and M. Antonietti, Energy Environ. Sci., 2018, 11, 57 RSC.
- Y. Wan and D. Zhao, Chem. Rev., 2007, 107, 2821 CrossRef CAS PubMed.
- J. Zhu, Y. Yao, Z. Chen, A. Zhang, M. Zhou, J. Guo, W. D. Wu, X. D. Chen, Y. Li and Z. Wu, ACS Appl. Mater. Interfaces, 2018, 10(22), 18761 CrossRef CAS PubMed.
- Y. Sakamoto, M. Kaneda, O. Terasaki, D. Y. Zhao, J. M. Kim, G. Stucky, H. J. Shin and R. Ryoo, Nature, 2000, 408, 449 CrossRef CAS PubMed.
- R. Ryoo, S. H. Joo, M. Kruk and M. Jaroniec, Adv. Mater., 2001, 13, 677 CrossRef CAS.
- C. Jo, K. Kim and R. Ryoo, Microporous Mesoporous Mater., 2009, 124(1–3), 45 CrossRef CAS.
- T. W. Kim, F. Kleitz, B. Paul and R. Ryoo, J. Am. Chem. Soc., 2005, 127, 7601 CrossRef CAS PubMed.
- J. M. Kim and G. D. Stucky, Chem. Commun., 2000, 13, 1159 RSC.
- R. S. Blissett and N. A. Rowson, Fuel, 2012, 97, 1 CrossRef CAS.
- Y.-R. Pei, G. Choi, S. Asahina, J.-H. Yang, A. Vinu and J.-H. Choy, Chem. Commun., 2019, 55, 3266 RSC.
- J. L. Provis and J. S. J. V. Deventer, Geopolymers: Structures, Processing, Properties and Industrial Applications, Woodhead. Cambridge, UK, 2009 Search PubMed.
- G. Singh, K. S. Lakhi, C. Sathish, K. Ramadass, J.-H. Yang and A. Vinu, ACS Appl. Nano Mater., 2019, 23, 1604 CrossRef.
- S. N. Talapaneni, G. Singh, I. Y. Kim, K. AlBahily, A. H. Al-Muhtaseb, A. S. Karakoti, E. Tavakkoli and A. Vinu, Adv. Mater., 2019, 1904635 CrossRef PubMed.
- M. Kruk, M. Jaroniec, R. Ryoo and S. H. Joo, J. Phys. Chem. B, 2000, 104, 7960 CrossRef CAS.
- J. Lee, S. Yoon, S. M. Oh, C.-H. Shin and T. Hyeon, Adv. Mater., 2000, 12(5), 359 CrossRef CAS.
- J. Wang, H. Zhou, J. Zhuang and Q. Liu, Sci. Rep., 2013, 3, 3252 CrossRef PubMed.
- J. T. Li, B. L. Li, H. C. Wang, X. B. Bian and X. M. Wang, Carbon, 2011, 49, 1912 CrossRef CAS.
- (a) C. Chen, J. J. Dynes, J. Wang, C. Karunakaran and D. L. Sparks, Environ. Sci. Technol., 2014, 48, 6678 CrossRef CAS PubMed; (b) D. Solomon, J. Lehmann, J. Harden, J. Wang, J. Kinyangi, K. Heymann, C. Karunakaran, Y. Lu, S. Wirick and C. Jacobsen, Chem. Geol., 2012, 329, 53 CrossRef CAS.
Footnote |
| † Electronic supplementary information (ESI) available. See DOI: 10.1039/c9ra09698a |
| This journal is © The Royal Society of Chemistry 2020 |

