 Open Access Article
Reversible four-color electrochromism triggered by the electrochemical multi-step redox of Cr-based metallo-supramolecular polymers†
Takefumi Yoshida ,
Yoshikazu Ninomiya and
Masayoshi Higuchi
 *
*
Electronic Functional Macromolecules Group, National Institute for Materials Science (NIMS), Tsukuba 305-0044, Japan. E-mail: HIGUCHI.Masayoshi@nims.go.jp
First published on 17th March 2020
Abstract
Four color electrochromism (yellow, magenta, blue, and navy) has been achieved in Cr(III)-based metallo-supramolecular polymers (polyCr), which were synthesized by 1![[thin space (1/6-em)]](https://www.rsc.org/images/entities/char_2009.gif) :
:![[thin space (1/6-em)]](https://www.rsc.org/images/entities/char_2009.gif) 1 complexation of Cr ions and 1,4-di[[2,2′:6′,2′′-terpyridin]-4′-yl]benzene (L). The polymer structure was determined by X-ray absorption fine structure (XAFS) measurement and X-ray photoelectron spectroscopy (XPS). The molecular weight of polyCr was calculated as 3.2 × 10⁷ Da using right angle light scattering (RALS). The EXAFS fitting indicated that the bond distances of Cr–N are 2.020 Å and 2.208 Å. A film of polyCr shows multi-color electrochromism (EC) or absorption: a sharp peak at 380 nm at 0 V vs. Ag/Ag+ (yellow), a sharp peak at 510 nm and a broad peak at 800 nm at −0.6 V vs. Ag/Ag+ (magenta), a broad peak at 610 nm and between 700–900 nm at −1.2 V vs. Ag/Ag+ (blue), a broad peak between 450–900 nm at −1.8 V vs. Ag/Ag+ (navy). The transmittances change (ΔT), the switching times for coloring and bleaching (Tc, Tb) and the coloration efficiency (ηc, ηb): [ΔT, (Tc, Tb), (ηc, ηb)] were [39.2%, (5.56 s, 1.39 s), (169 cm2 C−1, 230 cm2 C−1)] at 510 nm between −0.6 and 0.2 V vs. Ag/Ag+, [67.0%, (6.93 s, 2.52 s), (138 cm2 C−1, 172 cm2 C−1)] at 610 nm between −1.2 and 0.2 V vs. Ag/Ag+, [86.1%, (6.80 s, 3.03 s), (167 cm2 C−1, 134 cm2 C−1)] at 780 nm between −1.8 and 0.2 V vs. Ag/Ag+, respectively, during the cycles. The durability experiment indicates that polyCr shows an EC property for at least 100 cycles.
1 complexation of Cr ions and 1,4-di[[2,2′:6′,2′′-terpyridin]-4′-yl]benzene (L). The polymer structure was determined by X-ray absorption fine structure (XAFS) measurement and X-ray photoelectron spectroscopy (XPS). The molecular weight of polyCr was calculated as 3.2 × 10⁷ Da using right angle light scattering (RALS). The EXAFS fitting indicated that the bond distances of Cr–N are 2.020 Å and 2.208 Å. A film of polyCr shows multi-color electrochromism (EC) or absorption: a sharp peak at 380 nm at 0 V vs. Ag/Ag+ (yellow), a sharp peak at 510 nm and a broad peak at 800 nm at −0.6 V vs. Ag/Ag+ (magenta), a broad peak at 610 nm and between 700–900 nm at −1.2 V vs. Ag/Ag+ (blue), a broad peak between 450–900 nm at −1.8 V vs. Ag/Ag+ (navy). The transmittances change (ΔT), the switching times for coloring and bleaching (Tc, Tb) and the coloration efficiency (ηc, ηb): [ΔT, (Tc, Tb), (ηc, ηb)] were [39.2%, (5.56 s, 1.39 s), (169 cm2 C−1, 230 cm2 C−1)] at 510 nm between −0.6 and 0.2 V vs. Ag/Ag+, [67.0%, (6.93 s, 2.52 s), (138 cm2 C−1, 172 cm2 C−1)] at 610 nm between −1.2 and 0.2 V vs. Ag/Ag+, [86.1%, (6.80 s, 3.03 s), (167 cm2 C−1, 134 cm2 C−1)] at 780 nm between −1.8 and 0.2 V vs. Ag/Ag+, respectively, during the cycles. The durability experiment indicates that polyCr shows an EC property for at least 100 cycles.
Introduction
Electrochromic (EC) materials have been studied in the fields of organic molecules,1 inorganic materials,2 organic polymers,3 and metallo-supramolecular polymers (MSPs),4 and also, EC materials such as WO3 or NiO have been used for smart windows, EC display and anti-glare rear view mirrors.5 Furthermore, multi-color EC materials have received much attention in applications for EC displays.The MSPs, which are prepared by a 1![[thin space (1/6-em)]](https://www.rsc.org/images/entities/char_2009.gif) :
:![[thin space (1/6-em)]](https://www.rsc.org/images/entities/char_2009.gif) 1 complexation of metal ions with ditopic organic ligands, are a new type of coordination polymers and have been investigated for EC properties,6 ion conductivity,7 and luminescence.8 These properties greatly depend on the metal species included in the polymer. In particular, group 8 metal ions (M = Fe, Ru, Os ions) based MSPs (polyM) show clear EC, whereas polyM(II) show a deep color [or metal-to-ligand charge-transfer (MLCT) in the visible region (e.g., Fe: purple at 600 nm)] and polyM(III) show a transparent color (or no absorption in visible region), and in addition, they have been studied for use in EC displays with high durability.6a,c,d In addition, multi-color EC display of MSPs has also been reported which use multi-component based MSPs.6d,9 The multi-color EC display with mononuclear MSPs has also been reported (e.g., use of a Co complex shows yellow, orange or black colors).10
1 complexation of metal ions with ditopic organic ligands, are a new type of coordination polymers and have been investigated for EC properties,6 ion conductivity,7 and luminescence.8 These properties greatly depend on the metal species included in the polymer. In particular, group 8 metal ions (M = Fe, Ru, Os ions) based MSPs (polyM) show clear EC, whereas polyM(II) show a deep color [or metal-to-ligand charge-transfer (MLCT) in the visible region (e.g., Fe: purple at 600 nm)] and polyM(III) show a transparent color (or no absorption in visible region), and in addition, they have been studied for use in EC displays with high durability.6a,c,d In addition, multi-color EC display of MSPs has also been reported which use multi-component based MSPs.6d,9 The multi-color EC display with mononuclear MSPs has also been reported (e.g., use of a Co complex shows yellow, orange or black colors).10
The origin of the word “chromism” comes from the element chrome (Cr) which shows different colors depending on its oxidation state. It also has characteristic properties such as catalysis,11 magnetism,12 and toxicity.13 Recently, Farran et al. have reported Cr complexes with terpyridine ligands, where the Cr complexes show various oxidation states and colors at various potentials in the solution (they also reported the electron transfer process with the Ru ion).14 Although they mainly reported electrochemical and photo-induced reduction processes, this study reported the potential of a solid-state multi-color Cr-based EC material.
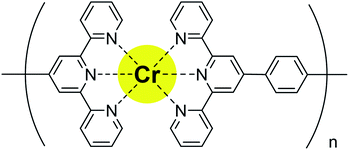
In this work, Cr-based MSPs ([Cr(L)]n(ClO4)3n:polyCr, Fig. 1) (L: 1,4-di[[2,2′:6′,2′′-terpyridin]-4′-yl]benzene ligand) were synthesized and then characterized by X-ray absorption fine structure (XAFS) measurements, X-ray photoelectron spectroscopy (XPS) and right angle light scattering (RALS). The multi-color (yellow, magenta, blue, navy) electrochromic properties of polyCr were measured using cyclic voltammetry (CV) and chronoamperometry (CA) techniques with spectroscopy.
Results and discussion
The Cr(II)Cl2 (12 mg, 0.1 mmol) was added to a suspension of L (54 mg, 0.1 mmol) in 100 ml methanol under N2. After 30 min of stirring, a purple solution was obtained. Next, the orange solution was obtained after 30 min of stirring under air [Cr(II) was oxidize to Cr(III)]. The solution filtered impurities an insoluble polymer. After the evaporation of the methanol, a yellow precipitate was obtained. The yellow precipitate was washed with a 0.1 M MeCN solution of LiClO4 to exchange the counter anions (from Cl− to ClO4−) and to the remove low molecular weight polymer. Finally, a yellow solid of polyCr was obtained. The molecular weight of polyCr was calculated as 3.2 × 10⁷ Da using right angle light scattering (RALS), indicating the formation of MSPs. The results shown by the XPS spectra and emission spectrum are discussed in the ESI.† The TGA curve of polyCr is shown in Fig. S8 (ESI†). This polymer was stable up to 270 °C except for the possible weight loss of the crystal solvent. Only 15 wt% loss was observed at 500 °C. A film of polyCr was prepared on ITO by spin coating it with 200 μml of a 5 mg ml−1 methanol solution of polyCr.To estimate the coordination structure of polyCr, the X-ray absorption fine structure measurements at the K-edge of the Cr ion were obtained from the synchrotron facility (BL-12C KEK). The X-ray absorption near edge structure (XANES) spectra measured at the Cr K-edge are shown in Fig. 2a. The Cr K-edge spectra of a pellet of polyCr was almost not shifted from 6006 eV (white line of the standard sample of Cr2O3).15 The results indicated that the oxidation state of the Cr ions of polyCr was trivalent. From the extended X-ray absorption fine structure (EXAFS) region, the fitting by using crystal structure of reported Cr complex16 (Fig. 2b) revealed that the coordination lengths around the Cr ions Cr–N were 2.020 Å and 2.208 Å (R-factor; 1.37%, Table 1, EXAFS oscillation is shown in Fig. S1, ESI†). These values were similar to the distances in the crystal structure. These results confirmed that the Cr ion of polyCr had an octahedral coordination structure.
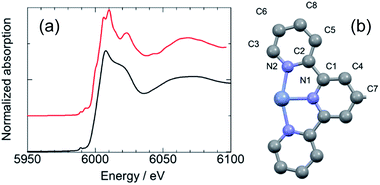 | ||
| Fig. 2 (a) XANES spectra of a pellet of Cr2O3 (red curve) and polyCr (black curve), (b) asymmetry unit around the Cr ion of reported Cr complex. | ||
| R-factor: 0.86% | N | R/Å | Reff | Δ |
|---|---|---|---|---|
| N1 | 2 | 2.020 | 1.969 | 0.0503 |
| N2 | 4 | 2.208 | 2.055 | 0.1528 |
| C1 | 4 | 3.036 | 2.886 | 0.1501 |
| C2 | 4 | 2.953 | 2.911 | 0.0426 |
| C3 | 4 | 3.060 | 3.051 | 0.0086 |
| C4 | 4 | 4.083 | 4.187 | −0.1035 |
| C5 | 4 | 4.245 | 4.235 | 0.0099 |
| C6 | 4 | 4.376 | 4.344 | 0.03242 |
| C7 | 2 | 4.711 | 4.725 | −0.0138 |
| C8 | 4 | 4.915 | 4.814 | 0.1010 |
The CVs of a cast film of polyCr were measured with a glassy carbon electrode (Fig. 3a). The sharp redox pairs (reduction, oxidation) of [polyCr]3+/[polyCr]2+, [polyCr]2+/[polyCr]+ were observed at (−0.55 V, −0.38 V) and (−0.91 V, −0.73) vs. Ag/Ag+, respectively. These redox potentials were similar to those of reported Cr complexes. However, a large redox pair was observed at (−1.49 V, −1.08 V) vs. Ag/Ag+. This peak can be assigned to the two electron transfers between [polyCr]+/[polyCr]−.15,17 The CV of a film of polyCr was measured on ITO (Fig. S4, ESI†). An additional irreversible peak was observed when compared to CV on glassy carbon. This peak was from the reduction of ITO.
The transmittance spectrum of polyCr at various potentials is shown in Fig. 3b (images of polyCr at various potential are shown in Fig. 3c). There was a peak at 380 nm which was assigned to an intra ligand charge transfer transition (ILCT) at 0 V vs. Ag/Ag+. As soon as the potential at −0.6 V vs. Ag/Ag+ was applied, a sharp peak at 510 nm and a broad peak at 800 nm appeared. At −1.2 V vs. Ag/Ag+, a sharp peak at 610 nm and a broad peak between 700–900 nm appeared. At −1.8 V vs. Ag/Ag+, a broad peak between 450–900 nm appeared. These behaviours were similar to those reported for the solution of the Cr complex.14 The color of the polymer film at each potential was defined, using the CIE 1964 XY color system, as 0.0 V: (0.36, 0.36), −0.6 V: (0.36, 0.33), −1.2 V: (0.29, 0.30), and −1.8 V: (0.26, 0.28) (Fig. 3d). From these results, a multi-color and wide-absorption solid-state EC material was made.
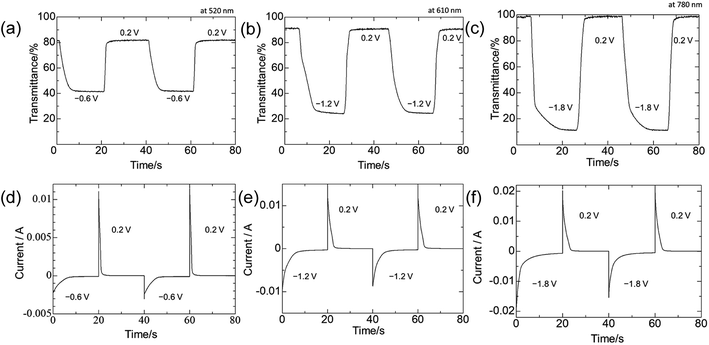
The transmittances in the colored and bleached states were 81.1% and 41.9% (ΔT = 39.2%) at 520 nm between −0.6 and 0.2 V vs. Ag/Ag+, 91.1% and 24.1% (ΔT = 67.0%) at 610 nm between −1.2 and 0.2 V vs. Ag/Ag+, and 98.1% and 12.0% (ΔT = 86.1%) at 780 nm between −1.8 and 0.2 V vs. Ag/Ag+, during the cycles shown in Fig. 4a–c, respectively. These values were larger than those of previously reported MSPs (e.g., polyFe: ΔT = ∼55%).6a The switching times for coloring and bleaching (Tc and Tb) were 5.56 s and 1.39 s for 510 nm, 6.93 s and 2.52 s for 610 nm and 6.80 s and 3.03 s for 780 nm, respectively. These values were longer than those of previously reported MSPs (e.g., polyFe: Tc: 0.37 s and Tb: 0.60 s).6a The coloration efficiency (η), was used for evaluating the energy consumption, which was calculated using the following equation:18
| η = ΔOD/Qd = log(Tb/Tc)/Qd | (1) |
To confirm the durability of the color change, the repeated transmittance changes at 780 nm during the redox-switching between two potentials (−1.8 and 0.2 V) up to 100 cycles were monitored (Fig. 5). The transmittances in the colored states were constant at 12.0%, whereas those in the bleached states were slightly decreased (3%) during the cycles. This decrement was induced by a deterioration of ITO. In addition, the more cycles the EC system undergoes, the more current was observed because of the increase of the leakage current, which was induced by the deterioration of ITO (Fig. S5, ESI†). In other words, the durability of the electrochromic system can easily be improved by preventing the deterioration of ITO.
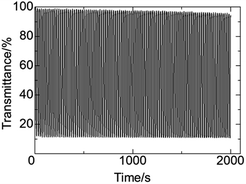 | ||
| Fig. 5 The repeated transmittance changes at 780 nm during the redox-switching between two potentials (−1.8 and 0.2 V) up to 100 cycles. | ||
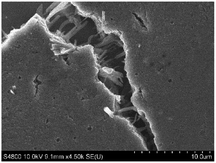
To investigate the film-forming properties of polyCr, the surface morphology of polyCr was measured by scanning electron microscopy (SEM), where a film was prepared by drop-casting. The SEM images of polyCr on ITO are shown in Fig. 6. The polyCr formed an almost flat surface. In addition, a fibrous structure was observed along the edge of the film.
Conclusions
A multi-color-electrochromic Cr(III)-based metallo-supramolecular polymer (polyCr) was synthesized by complexation of a Cr ion and 1,4-di[[2,2′:6′,2′′-terpyridin]-4′-yl]benzene (L). The polymer structure was determined by XAFS spectroscopy measurement and XPS. The molecular weight of polyCr was calculated as 3.2 × 10⁷ Da by RALS. The EXAFS fitting indicated that the bond distances of Cr–N were 2.020 Å and 2.208 Å. A film of polyCr shows electrochromism (EC) or absorption: a sharp peak at 380 nm at 0 V vs. Ag/Ag+, a sharp peak at 510 nm and a broad peak at 800 nm at −0.6 V vs. Ag/Ag+, a broad peak at 610 nm and between 700–900 nm at −1.2 V vs. Ag/Ag+, a broad peak between 450–900 nm at −1.8 V vs. Ag/Ag+. The transmittance changes (ΔT), the switching times for coloring and bleaching (Tc, Tb) and the coloration efficiency (ηc, ηb): [ΔT, (Tc, Tb), (ηc, ηb)] were [39.2%, (5.56 s, 1.39 s), (169 cm2 C−1, 230 cm2 C−1)] at 510 nm between −0.6 and 0.2 V vs. Ag/Ag+, [67.0%, (6.93 s, 2.52 s), (138 cm2 C−1, 172 cm2 C−1)] at 610 nm between −1.2 and 0.2 V vs. Ag/Ag+, [86.1%, (6.80 s, 3.03 s), (167 cm2 C−1, 134 cm2 C−1)] at 780 nm between −1.8 and 0.2 V vs. Ag/Ag+, respectively, during the cycles. The durability experiment indicated that polyCr shows an EC property for at least 100 cycles. These properties are important for the fabrication of EC devices.Experimental
Synthesis of polyCr
The Cr(II)Cl2 (12 mg, 0.1 mmol) was added to a suspension of L (54 mg, 0.1 mmol) in 100 ml of methanol under N2. After 30 min of stirring, a purple solution was obtained. Next, an orange solution was obtained after 30 min of stirring under air [Cr(II) was oxidized to Cr(III)]. The solution filtered impurities an insoluble polymer. After evaporation of the methanol, a yellow precipitate was obtained. The yellow precipitate was washed with a 0.1 M MeCN solution of LiClO4 to exchange the counter anion (from Cl− to ClO4−) and to remove low molecular weight polymer. Finally, a yellow solid of polyCr of was obtained. A film of polyCr (working area 2 cm × 2.5 cm) on ITO (8 Ω sq−1, 2.5 cm × 2.5 cm) was prepared by a spin coating method with 200 μml of a 5 mg ml−1 methanol solution of polyCr. The HR-MS results were: found m/z: 628.23 [M + L + Cl] and 663.16 [M + L + 2Cl]; calcuation m/z: 628.12 [M + L + Cl] (C35H26N6ClCr) and 663.09 [M + L + 2Cl] (C35H26N6Cl2Cr) (Fig. S6, ESI†). The IR spectrum results [Fig. S7, (ESI†) cm−1]: 3353 (s), 3064 (s), 1615 (s), 1465 (s), 1242 (m), 1093 (m), 1031 (m), 795 (m), 530 (br).Spectroscopy
X-ray absorption fine structure (XAFS) measurements were carried out at the BL12C beamline of the Photon Factory, the High Energy Accelerator Research Organization (KEK), under proposal no. 2019G117. Structural analysis was performed using the Demeter software platform. The reported crystal data was used for calculating Feff. The FT-IR spectra were acquired on a FTIR-8400S infrared spectrophotometer (Shimadzu). The UV-vis spectra were acquired on an Ocean spectrometer (Ocean Insight). Solid state emission spectra were acquired on a RF-5300PC spectrofluorophotometer (Shimadzu). The RALS was recorded in methanol solution, on a 270 Dual Detector (Viscotek). The XPS was performed on an Axis Nova (Kratos Analytical, Al Kα = 1.4866 keV).Electrochemistry
The CV and CA were performed on a electrochemical workstation (CH Instruments Inc., ALS/CHI) with a three-electrode system (polymer-coated ITO glass substrate and a glassy carbon working electrode, platinum wire as the counter electrode, and Ag/AgNO3 as the reference electrode).Conflicts of interest
There are no conflicts to declare.Acknowledgements
This research is financially supported by the JST-CREST project (grant number: JPMJCR1533). This work was conducted at the AIST Nano-Processing Facility, supported by “Nanotechnology Platform Program” of the Ministry of Education, Culture, Sports, Science and Technology (MEXT), Japan. The X-ray absorption fine structure was collected on the BL-12C beamline in the Photon Factory of the High Energy Accelerator Research Organization (KEK, proposal no. 2019G117).Notes and references
- (a) Y.-M. Zhang, X. Wang, W. Zhang, W. Li, X. Fang, B. Yang, M. Li and S. X.-A. Zhang, Light: Sci. Appl., 2015, 4, e249 CrossRef CAS; (b) A. Hein, C. Kortz and E. Oesterschulze, Sci. Rep., 2019, 9, 15822 CrossRef PubMed; (c) A. N. Woodward, J. M. Kolesar, S. R. Hall, N.-A. Saleh, D. S. Jones and M. G. Walter, J. Am. Chem. Soc., 2017, 139, 8467–8473 CrossRef CAS PubMed.
- (a) G. Gao, L. Xu, W. Wang, W. An and Y. Qiu, J. Mater. Chem., 2004, 14, 2024–2029 RSC; (b) C. G. Granqvist, M. A. Arvizu, İ. Bayrak Pehlivan, H. Y. Qu, R. T. Wen and G. A. Niklasson, Electrochim. Acta, 2018, 259, 1170–1182 CrossRef CAS; (c) G. Cai, J. Wang and P. S. Lee, Acc. Chem. Res., 2016, 49, 1469–1476 CrossRef CAS PubMed; (d) G. Cai, P. Darmawan, M. Cui, J. Wang, J. Chen, S. Magdassi and P. S. Lee, Adv. Energy Mater., 2016, 6, 1501882 CrossRef; (e) L. Shen, L. Du, S. Tan, Z. Zang, C. Zhao and W. Mai, Chem. Commun., 2016, 52, 6296–6299 RSC; (f) R.-T. Wen, C. G. Granqvist and G. A. Niklasson, Nat. Mater., 2015, 14, 996–1001 CrossRef CAS PubMed; (g) C. Yan, W. Kang, J. Wang, M. Cui, X. Wang, C. Y. Foo, K. J. Chee and P. S. Lee, ACS Nano, 2014, 8, 316–322 CrossRef CAS PubMed; (h) E. L. Runnerstrom, A. Llordés, S. D. Lounis and D. J. Milliron, Chem. Commun., 2014, 50, 10555–10572 RSC; (i) H. S. Chavan, B. Hou, A. T. A. Ahmed, Y. Jo, S. Cho, J. Kim, S. M. Pawar, S. Cha, A. I. Inamdar, H. Im and H. Kim, Sol. Energy Mater. Sol. Cells, 2018, 185, 166–173 CrossRef CAS.
- (a) T.-H. Chang, H.-C. Lu, M.-H. Lee, S.-Y. Kao and K.-C. Ho, Sol. Energy Mater. Sol. Cells, 2018, 177, 75–81 CrossRef CAS; (b) İ. Yağmur, M. Ak and A. Bayrakçeken, Smart Mater. Struct., 2013, 22, 115022 CrossRef; (c) H. Wei, J. Zhu, S. Wu, S. Wei and Z. Guo, Polymer, 2013, 54, 1820–1831 CrossRef CAS; (d) W.-H. Wang, J.-C. Chang and T.-Y. Wu, Org. Electron., 2019, 74, 23–32 CrossRef CAS; (e) T. An, Y. Ling, S. Gong, B. Zhu, Y. Zhao, D. Dong, L. W. Yap, Y. Wang and W. Cheng, Adv. Mater. Technol., 2019, 4 Search PubMed.
- M. Lahav and M. E. v. d. Boom, Adv. Mater., 2018, 30 Search PubMed.
- (a) Y. Wang, E. L. Runnerstrom and D. J. Milliron, Annu. Rev. Chem. Biomol. Eng., 2016, 7, 283–304 CrossRef CAS PubMed; (b) V. K. Thakur, G. Ding, J. Ma, P. S. Lee and X. Lu, Adv. Mater., 2012, 24, 4071–4096 CrossRef CAS PubMed; (c) X. Li, K. Perera, J. He, A. Gumyusenge and J. Mei, J. Mater. Chem. C, 2019, 7, 12761–12789 RSC; (d) H.-J. Yen and G.-S. Liou, Polym. Chem., 2018, 9, 3001–3018 RSC.
- (a) C.-W. Hu, T. Sato, J. Zhang, S. Moriyama and M. Higuchi, ACS Appl. Mater. Interfaces, 2014, 6, 9118–9125 CrossRef CAS PubMed; (b) B.-H. Chen, S.-Y. Kao, C.-W. Hu, M. Higuchi, K.-C. Ho and Y.-C. Liao, ACS Appl. Mater. Interfaces, 2015, 7, 25069–25076 CrossRef CAS PubMed; (c) M. K. Bera, C. Chakraborty, U. Rana and M. Higuchi, Macromol. Rapid Commun., 2018, 39, 1800415 CrossRef PubMed; (d) C.-W. Hu, T. Sato, J. Zhang, S. Moriyama and M. Higuchi, J. Mater. Chem. C, 2013, 1, 3408–3413 RSC.
- (a) R. K. Pandey, U. Rana, C. Chakraborty, S. Moriyama and M. Higuchi, ACS Appl. Mater. Interfaces, 2016, 8, 13526–13531 CrossRef CAS PubMed; (b) R. K. Pandey, M. Delwar Hossain, C. Chakraborty, S. Moriyama and M. Higuchi, Chem. Commun., 2015, 51, 11012–11014 RSC; (c) R. K. Pandey, M. D. Hossain, T. Sato, U. Rana, S. Moriyama and M. Higuchi, RSC Adv., 2015, 5, 49224–49230 RSC.
- (a) Y. Zhou, H.-Y. Zhang, Z.-Y. Zhang and Y. Liu, J. Am. Chem. Soc., 2017, 139, 7168–7171 CrossRef CAS PubMed; (b) L. Babel, L. Guenee, C. Besnard, S. V. Eliseeva, S. Petoud and C. Piguet, Chem. Sci., 2018, 9, 325–335 RSC; (c) D. Yang, Y. Wang, D. Liu, Z. Li and H. Li, J. Mater. Chem. C, 2018, 6, 1944–1950 RSC; (d) T. Sato, R. K. Pandey and M. Higuchi, Dalton Trans., 2013, 42, 16036–16042 RSC; (e) P. Chen, Q. Li, S. Grindy and N. Holten-Andersen, J. Am. Chem. Soc., 2015, 137, 11590–11593 CrossRef CAS PubMed.
- Y. Kuai, W. Li, Y. Dong, W.-Y. Wong, S. Yan, Y. Dai and C. Zhang, Dalton Trans., 2019, 48, 15121–15126 RSC.
- C.-Y. Hsu, J. Zhang, T. Sato, S. Moriyama and M. Higuchi, ACS Appl. Mater. Interfaces, 2015, 7, 18266–18272 CrossRef CAS PubMed.
- (a) S. E. Denmark and J. Fu, Chem. Rev., 2003, 103, 2763–2794 CrossRef CAS PubMed; (b) M. Bandini, P. G. Cozzi and A. Umani-Ronchi, Tetrahedron, 2001, 57, 835–843 CrossRef CAS.
- (a) D. A. Cummings, J. McMaster, A. L. Rieger and P. H. Rieger, Organometallics, 1997, 16, 4362–4368 CrossRef CAS; (b) F. Moro, D. Kaminski, F. Tuna, G. F. S. Whitehead, G. A. Timco, D. Collison, R. E. P. Winpenny, A. Ardavan and E. J. L. McInnes, Chem. Commun., 2014, 50, 91–93 RSC; (c) A. Ardavan, O. Rival, J. J. L. Morton, S. J. Blundell, A. M. Tyryshkin, G. A. Timco and R. E. P. Winpenny, Phys. Rev. Lett., 2007, 98, 057201 CrossRef PubMed; (d) J. H. Christian, D. W. Brogden, J. K. Bindra, J. S. Kinyon, J. van Tol, J. Wang, J. F. Berry and N. S. Dalal, Inorg. Chem., 2016, 55, 6376–6383 CrossRef CAS PubMed; (e) M. S. Fataftah, J. M. Zadrozny, S. C. Coste, M. J. Graham, D. M. Rogers and D. E. Freedman, J. Am. Chem. Soc., 2016, 138, 1344–1348 CrossRef CAS PubMed; (f) S. Lenz, H. Bamberger, P. P. Hallmen, Y. Thiebes, S. Otto, K. Heinze and J. van Slageren, Phys. Chem. Chem. Phys., 2019, 21, 6976–6983 RSC.
- M. Owlad, M. K. Aroua, W. A. W. Daud and S. Baroutian, Water, Air, Soil Pollut., 2009, 200, 59–77 CrossRef CAS.
- R. Farran, L. Le-Quang, J.-M. Mouesca, V. Maurel, D. Jouvenot, F. Loiseau, A. Deronzier and J. Chauvin, Dalton Trans., 2019, 48, 6800–6811 RSC.
- C. C. Scarborough, K. M. Lancaster, S. DeBeer, T. Weyhermüller, S. Sproules and K. Wieghardt, Inorg. Chem., 2012, 51, 3718–3732 CrossRef CAS PubMed.
- J. Schönle, E. C. Constable, C. E. Housecroft and M. Neuburger, Inorg. Chem. Commun., 2015, 53, 80–83 CrossRef.
- M. C. Hughes and D. J. Macero, Inorg. Chem., 1976, 15, 2040–2044 CrossRef CAS.
- M. Higuchi, J. Mater. Chem. C, 2014, 2, 9331–9341 RSC.
Footnote |
| † Electronic supplementary information (ESI) available. See DOI: 10.1039/d0ra00676a |
| This journal is © The Royal Society of Chemistry 2020 |

