 Open Access Article
Piezoelectric polymer nanofibers for pressure sensors and their applications in human activity monitoring†
Minmin Zhu *a,
Soon Siang Chng
 b,
Weifan Caib,
Chongyang Liua and
Zehui Du
 *a
*a
aTemasek Laboratories, Nanyang Technological University, Research Techno Plaza, 50 Nanyang Drive, 637553, Singapore. E-mail: mmzhu@ntu.edu.sg; duzehui@ntu.edu.sg
bNOVITAS, School of Electrical and Electronic Engineering, Nanyang Technological University, 50 Nanyang Avenue, 639798, Singapore
First published on 8th June 2020
Abstract
Miniaturized, wearable and self-powered sensors are crucial for applications in artificial intelligence, robotics, healthcare, and communication devices. In particular, piezoelectric polymer-based sensing systems have the advantages of light weight, large piezoelectricity and mechanical flexibility, offering great opportunities in flexible and stretchable electronic devices. Herein, free-standing large-size nanofiber (NF) membranes have been fabricated by an electrospinning technique. Our results show that the as-synthesized P(VDF–TrFE) NFs are pure β-phase and exhibit excellent mechanical and thermal properties. Besides having high sensitivity and operational stability, the fibrous sensor can generate remarkable electrical signals from applied pressure, with an output voltage of 18.1 V, output current of 0.177 μA, and power density of 22.9 μW cm−2. Moreover, such sensors also produce significant electrical performance of up to a few volts under human mechanical stress, thereby allowing for the monitoring of biomechanical movement of the human foot, elbow, and finger. Our study sheds light onto the use of piezoelectric polymers for flexible self-powered sensing electronics and wearable devices.
Introduction
The development of flexible multifunctional sensors as essential elements in wearable devices and robotic applications, has attracted extensive attention in recent years.1–3 In particular, the increasing demand for wearable sensors in healthcare, robotics and biomedicine requires these sensors to have higher sensitivity, flexibility, and low-cost. For example, these smart sensors can be utilized to detect the strains or stresses induced by human activity, offering a fast and convenient method to track human motions, such as running and breathing. Although we have witnessed the rapid developments of these sensors recently, fabrication of high accuracy and high-resolution sensing devices, particularly able to make quantitative measurements over a wide range of parameters, remains an elusive, long-term challenge.4,5 Furthermore, most sensors need to mimic human skin and integrate with other components such as batteries, satisfying the requirements for conformable contact and self-sustainable power source. Therefore, pressure sensors offer new opportunities in human healthcare and activity monitoring.State-of-the-art sensors mainly rely on the mechanism resulting from the variations of force-related parameter, such as capacitance, resistance, pyroelectric or piezoelectric output and triboelectric output.6 Notably, some limitations on sensitivity and power consumption are reported in both capacitor and transistor-based sensors. By contrast, piezoelectric polymer has great potential to fulfil the requirements of being mechanically flexible, light weight and operationally stabile. Furthermore, it allows for the sustainable operation without an external battery.7,8 Among them, poly(vinylidene fluoride) (PVDF) has been widely investigated for non-volatile memory, touch display device, and wearable piezoelectric generator owing to its excellent flexibility, piezoelectricity and non-toxicity.9–11 More importantly, PVDF-based devices can easily realize the self-powered multifunctional sensing due to their piezoelectricity. Its co-polymer, poly(vinylidene fluoride-co-trifluoroethylene) (P(VDF–TrFE)) can easily form pure β phase with the addition of a small amount of trifluoroethylene (TrFE), resulting in better crystallinity and piezoelectricity than PVDF.12 Particularly, highly aligned P(VDF–TrFE) integrated with 3D electrodes exhibits good flexibility and improved output performances.13 Besides, with the addition of graphene or BaTiO3, output performances of P(VDF–TrFE) fibers were significantly enhanced.14,15 Novel synthesis technique such as 3D printing can lead to a broad range of strain operation, ranging of up to 300% in BaTiO3 and P(VDF–TrFE) matrix, which is suitable for industrial manufacturing processes.16,17 Therefore, piezoelectric polymer such as P(VDF–TrFE) is an attractive candidate for wearable electronics and stretchable energy harvesters in our daily life.
Herein, we have constructed a wafer-scale and self-powered pressure sensor based on P(VDF–TrFE) nanofibers by electrospinning technique. The fibers are pure β phase and exhibit excellent mechanical and thermal properties. The resulting sensors demonstrate a strong electrical voltage of around 18.1 V and output current of 0.177 μA, corresponding to the power density of 22.9 μW cm−2. Moreover, we analyzed the pressure sensing mechanisms quantitatively, thereby highlighting the potential for self-powered micro-mechanical sensor, self-balancing soft robots and impact detectors. When it is attached to the human skin, the piezoelectric output signals are observed at the foot, the elbow, and the finger under differential human body motions. This study sheds a deeper insight into self-powered and sensitive impact pressure sensors, paving the way for advanced sensor technologies for applications in artificial intelligence, human–machine interfaces, and healthcare monitoring devices.
Experimental
Nanofiber fabrication
P(VDF–TrFE) powders were purchased from Solvay company, with a purity of around 99.99%. In our work, P(VDF–TrFE) nanofibers were synthesized by electrospinning technique. In a typical electropsun procedure, 5 g of P(VDF–TrFE) (75/25 mol%) was dissolved into N,N-dimethylformamide (DMF, Sigma-Aldrich, Singapore). Subsequently, this compound was stirred by a magnetic agitator for 6 hours to form a homogeneous solution, which was used as the precursor for the electrospinning. The precursor mixture was pumped into a 15 mL plastic syringe with a metal needle. The electrospinning voltage was 28 kV while the distance between the needle and the cylinder collector was 110 cm. The feed rate of the precursor solution was 2 mL h−1, and the rotating speed of the cylinder collector was 1000 revolutions per second.Characterizations
The morphology and microstructure of the as-grown fibrous samples were characterized by scanning electron microscopy (FESEM6340, Oxford) and X-ray diffraction (XRD, D8Advance, Bruker). Fourier-Transform Infrared Spectroscopy (FTIR, Thermo Fisher Scientific, USA) was carried out in the range of 400 cm−1 to 4000 cm−1. X-ray Photoelectron Spectroscopy (XPS) was performed to investigate the chemical bonding and composition. In addition, Differential Scanning Calorimetry (DSC) technique were performed to determine the Curie temperature and other thermal decomposition performance. Mechanical properties of the samples are carried out by Instron mechanical tester with 30 kN load force. A customer-designed machine equipped with one resistance box and one computer was used to investigate the generated voltage and output current of the resulting sensor based on the fibrous samples with Cu and Au electrodes (Fig. S1†). In our setup, a portable platform with Au-coated Si wafer (the left platform) as one electrode driven by one motor moves forward and backward, which periodically contacts and releases the P(VDF–TrFE) nanofibers with copper tape (the right platform) as another electrode. Notably, the load force is associated with the distance between the left sample platform and the right Au/Si platform. The current and voltage outputs were recorded by the computer in tandem with the periodic motion.Results and discussion
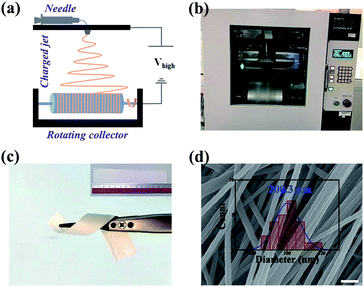
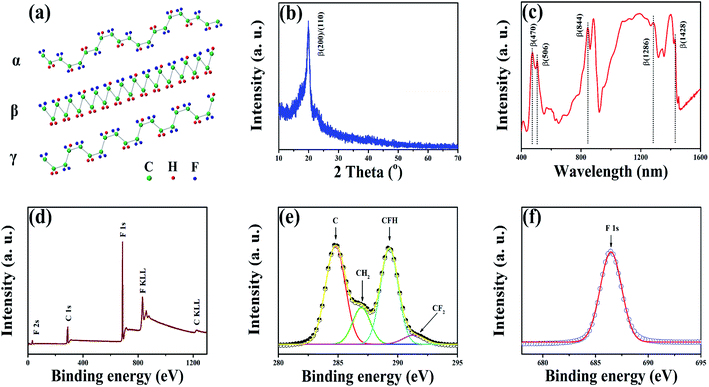
Electrospinning can be viewed as an electrohydrodynamic process. Under the applied high voltage, the charged liquid droplet generates the jet, which goes through a spherical path and forms the fiber membrane on the rotating collector.18 Fig. 1a shows the schematic diagram of the electrospinning setup. The machine used in the experiments consists of one plastic syringe with a metal needle, rotating collector and a high power supply (Fig. 1b).19 It can be seen from Fig. 1c that the size of such nanofibers can reach tens of centimeters and an even larger area which depends on the collector size. More importantly, the excellent fibrous structure forms are observed, evidenced by SEM characterization, as shown in Fig. 1d. Meanwhile, the fiber diameter shows good uniformity and is evaluated to be 200.3 nm, which is consist with the values reported in the literature of up to a few hundred nanometers.20 In fact, the diameter of electrospinning nanofibers is associated with some experimental factors, such as the precursor concentration, solution viscosity, surface tension, applied voltage and the distance between the needle and the collector. When the concentration of the precursor solution is low, bead formation easily occurs on the fibers, as a result of the Taylor cone instability induced by the imbalance between the viscoelastic and electrical properties of the solution.21 The diameter (d) of the fiber is determined by the equilibrium between the coulombic repulsion and the surface tension,22 and can be expressed as: d = γ1/3(Q/I)2/3w1/2, where γ is the surface tension, Q is the volumetric flow rate, I is the electric current and w is the initial polymer volume fraction. The distance between the tip and the collector also affect the fiber diameter, owing to the electric field strength variation.23 Furthermore, the nature of the solvent also influences the diameter because it directly affects the precursor solution surface tension.24Ferroelectric P(VDF–TrFE) copolymer is expected to be more crystalline as compared to PVDF, with the addition of TrFE.25 As a semi-crystalline polymer, there are five different polymorphs, such as α, β, γ, δ, and ε phase.26 Among them, α, β, and γ are the most common forms. Notably, δ phase is difficult to verify experimentally and formed only by applying a short electrical pulse.27 Although α phase is the most stable phase thermodynamically, β-phase exhibits better ferroelectric properties and spontaneous polarization.12,28 Fig. 2a reveals the chemical chain structures of ferroelectric P(VDF–TrFE) polymers with different phases. The crystalline characteristics of P(VDF–TrFE) nanofibers are further studied by XRD, FTIR and XPS. Fig. 2b exhibits the single XRD peak at 19.9°, which is corresponding to the (110)/(200) of β phase.28 Comparatively, any peaks at 17.8° (100), 18.5° (020), 26.6° (021) for α phase or the ones at 18.5° (020) and 20.4° (110) for γ phase are not observed, indicating the β phase is the dominant polymorph in our nanofibers.29,30 Besides, FTIR analysis shows the typical β phase bands at 506, 844, 1286 and 1428 cm−1 (Fig. 2c).31 By contrast, the α phase bands (532, 612, 765, 796, 870, 970 cm−1) and γ phase bands (1170, 1220 cm−1) are not present.31,32 In addition, XPS result also indicates the presence of C and F (Fig. 2d). Moreover, both C 1s and F 1s spectra of the fibers are shown in Fig. 2e and f, respectively. Four prominent C states are recognized (e.g., 284.8 eV for surface contaminants, 286.9 eV for hydrocarbon CH2, 286.3 eV for C–F–H and 291.3 eV for CF2), which are in agreement with the values of P(VDF–TrFE) reported.33,34
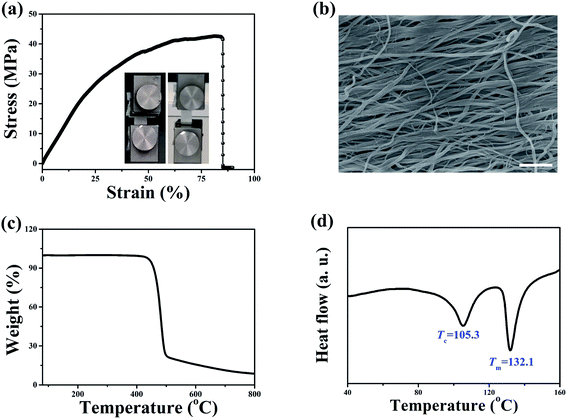
Mechanical robustness of piezoelectric P(VDF–TrFE) copolymers is one of the key factors in multifunctional applications. All testing samples are regular squares with dimensions of 10 × 10 × 0.04 cm3. Fig. 3a depicts the stress–strain curve of the samples. The tensile strength and Young's modulus of the nanofibers are 42.8 MPa and 157.3 MPa, respectively, which are similar to those of P(VDF–TrFE) nanofibers by electrospinning and significantly larger than the value of P(VDF–TrFE) thin films.35,36 Fig. 3b displays the morphology of the sample after tensile testing. Apparently, the nanofiber becomes flatten extensively, indicating the excellent elasto-plastic behavior. As shown in Fig. 3c, the initial thermal decomposition temperature of the fibrous samples is around 420 °C. Fig. 3d shows the Curie temperature (Tc, 105.3 °C) and melting transition point (Tm, 132.1 °C) of P(VDF–TrFE) nanofibers. It is noted that Tc is characteristic of the ferroelectric behaviors, depending on the morphology of piezoelectric polymer (size, amount, molecular weight, cooperativity etc.).26,37 Besides, it is believed that the ratio of VDF to TrFE significantly influences the Tc and Tm.38 As the amount of VDF increases from 80 to 94 mol%, Tc increases from 90.9 to 124.7 °C whereas Tm slightly increases by around 6 °C (140.7 to 146.02 °C).
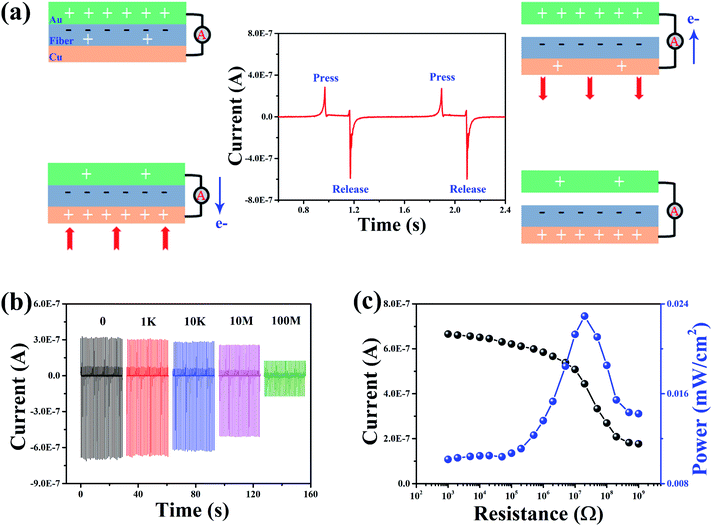
Periodical press and release actions were carried out on the device to investigate the output electrical performances. As shown in Fig. 4a, P(VDF–TrFE) nanofibers were in contact with the bottom electrode copper and the top electrode gold. When the device is pressed initially, electrons are injected from the top electrode to the P(VDF–TrFE) surface, followed by the charge transferring to the bottom electrode during the release process. Apparently, the voltage potential between two electrodes establishes, allowing the electrons to flow through the top electrode to the bottom electrode in order to remain the electrostatic equilibrium.39 Once the device is pressed again, the redistributed charges are created to drive the electrons in the opposite direction. Notably, spontaneous induction of polarity of the fibers occur easily at high electric field during the electrospinning process, although no polarity of the fibers are induced before the measurement.40 Fig. 4b exhibits the output current variation with external load resistances ranging from 1 kΩ to 1 GΩ. The corresponding output current and power density are summarized in Fig. 4c.41 It seems clear that the output current continues to decrease with the external load resistance. By contrast, the instantaneous output power density slightly increases at the beginning and subsequently reaches the maximum value at the load resistance of 10 MΩ, resulting in a maximum output power of 22.9 μW cm−2. Similar phenomenon of a first increase and then decrease in power density is also observed in ZnO-modified P(VDF–TrFE) thin films and nanofibers.42,43
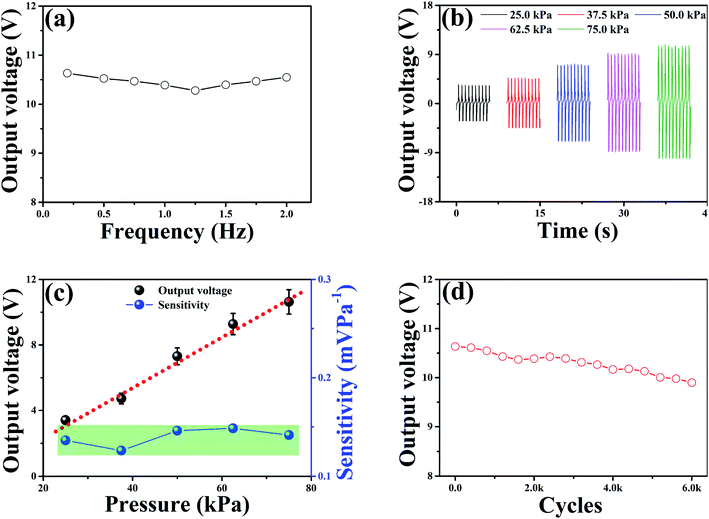
Pressure sensors can quickly detect small pressure variations, indicating the immense potential in soft robotics, human–machine interfaces and artificial intelligence, as well as healthcare monitoring devices. Herein, we investigate the sensing mechanism of the fiber-based device. A dynamic force measurement was carried out under a pressure of 75 kPa at the frequency range of 0.2 to 2 Hz (Fig. 5a). Notably, the output voltage remains relatively constant with the increase of the frequency. Interestingly, as the external load pressure increases by a larger margin, the output voltage of the device exhibits a similar increasing trend (Fig. 5b). Here, the sensitivity is defined as the ratio of the voltage and the pressure (V/P). All output voltage and sensitivity of our device are calculated and summarized in Fig. 5c. In general, the output voltage is associated with the piezoelectric charge coefficient (d33) and the applied pressure (P):44
| V = (hd33P)/(ε0εr) | (1) |
| Materials | Method | Form | Output voltage (V) | Sensitivity (mV Pa−1) | References |
|---|---|---|---|---|---|
| MWCNT/P(VDF–TrFE) | Electrospinning | Fiber | 6.2 | 0.20 | 45 |
| Graphene/P(VDF–TrFE) | Spincoating | Film | <1 | — | 14 |
| Graphene/P(VDF–TrFE) | Electrospinning | Fiber | 1.5 | 0.072 | 46 |
| BaTiO3/P(VDF–TrFE) | 3D printing | Film | 8.0 | — | 16 |
| BaTiO3/P(VDF–TrFE) | Electrospinning | Fiber | 6.0 | — | 15 |
| BN/P(VDF–TrFE) | Spincoating | Film | 22 | 0.055 | 47 |
| Ag/P(VDF–TrFE) | Spincoating | Film | 17 | 0.1 | 48 |
| P(VDF–TrFE) | Printing | Film | 1 | 0.066 | 49 |
| P(VDF–TrFE) | Electrospinning | Fiber | 4.2 | 0.41 | 31 |
| P(VDF–TrFE) | Electrospinning | Fiber | 10.6 | 0.14 | This work |
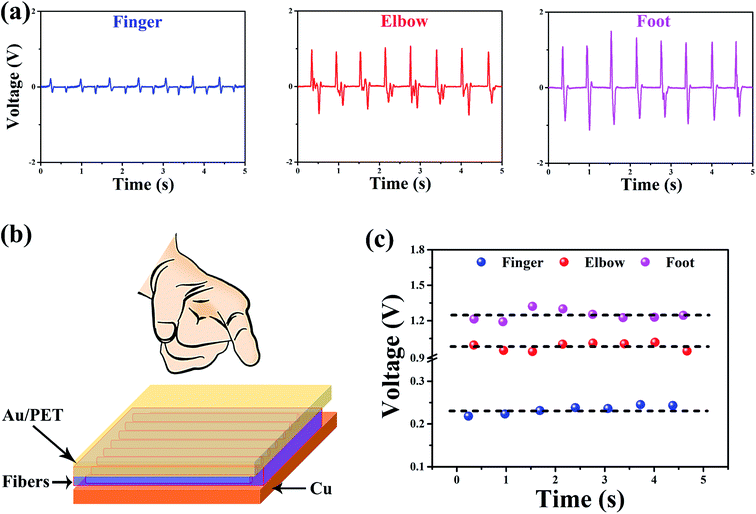
Owing to excellent mechanical flexibility and high sensitivity of P(VDF–TrFE)-based sensor above, it has tremendous potential in tracking human body motion. Therefore, we attach the devices on different parts of the human body, such as foot, elbow and finger to study its practical performances. Tensile and compressive stresses periodically occur in tandem with human body movements, thereby driving the device to generate cyclic electrical response, as shown in Fig. 6a. Schematic illustrations of human motions with the device attached to the finger can be found in Fig. 6b. Apparently, the foot exhibits a largest output voltage as compared to the elbow and the finger, with a peak open-circuit voltage of ∼1.3 V. More importantly, our device exhibits a fast response and recovery time in ten milliseconds (Fig. S2†). The output performance in the finger also demonstrates a similar trend, however, the value of its open-circuit voltage is only around 0.23 V, which is far smaller than those of the elbow case (0.98 V) and the foot case (1.3 V). Fig. 6c displays the results of the peak open-circuit voltages in a short time, steadily exhibiting the values of around 1.3 V for the foot, 0.98 V for the elbow and 0.23 V for the finger. Our device does not only offer an excellent sensitivity in the generated electrical signal, but also reveals a quantitative difference on various body parts, which can pave the ways for multifunctional applications in soft robots and wearable electronic devices.
Conclusions
In conclusion, we have presented the functionality of human motion-inspired sensors based on electrospinning P(VDF–TrFE) nanofibers. These fibrous membranes exhibit a pure β-phase and excellent mechanical flexibility, as well as a uniform fibrous structure. The device can directly convert the external pressure to the electrical signals, allowing the instantaneous detection of stress stimuli. Besides having high sensitivity on pressure sensing, such sensor offers fast response speed, excellent operation stability and self-powered capability. The piezoelectric output signals, when the sensors are attached to the human body at different locations, were stabilized at 1.3 V (foot), 0.98 V (elbow) and 0.23 V (finger) under differential human movements. Piezoelectric polymer nanofibers can achieve highly sensitive energy harvesting capacity for human body motions under various stress, paving the way for self-powered e-skins and multifunctional wearable micro-/nano-electronic devices.Conflicts of interest
There are no conflicts to declare.Notes and references
- J. Xiong, P. Cui, X. Chen, J. Wang, K. Parida, M.-F. Lin and P. S. Lee, Nat. Commun., 2018, 9, 4280 CrossRef PubMed.
- E. Roh, B. Hwang, D. Kim, B. Kim and N. Lee, ACS Nano, 2015, 9, 6252–6261 CrossRef CAS PubMed.
- Y. C. Huang, Y. Liu, C. Ma, H. C. Cheng, Q. He, H. Wu, C. Wang, C. Y. Lin, Y. Huang and X. Duan, Nat. Electron., 2020, 3, 59–69 CrossRef CAS.
- H. Zou, Y. Zhang, L. Guo, P. Wang, X. He, G. Dai, H. Zheng, C. Chen, A. C. Wang, C. Xu and Z. L. Wang, Nat. Commun., 2019, 10, 1427 CrossRef PubMed.
- M. Peng, Z. Li, C. Liu, Q. Zheng, X. Shi, M. Song, Y. Zhang, S. Du, J. Zhai and Z. L. Wang, ACS Nano, 2015, 9, 3143–3150 CrossRef CAS PubMed.
- W. Deng, T. Yang, L. Jin, C. Yan, H. Huang, X. Chu, Z. Wang, D. Xiong, G. Tian, Y. Gao, H. Zhang and W. Yang, Nano Energy, 2019, 55, 516–525 CrossRef CAS.
- E. J. Ko, S. J. Jeon, Y. W. Han, S. Y. Jeong, C. Y. Kang, T. H. Sung, K. W. Seong and D. K. Moon, Nano Energy, 2019, 58, 11–22 CrossRef CAS.
- Y. Xin, C. Guo, X. Qi, H. Tian, X. Li, Q. Dai, S. Wang and C. Wang, Ferroelectrics, 2016, 500, 291–300 CrossRef CAS.
- J. Y. Son, S. Ryu, Y. C. Park, Y. T. Lim, Y. S. Shin, Y. H. Shin and H. M. Jang, ACS Nano, 2010, 4, 7315–7320 CrossRef CAS PubMed.
- S. Reis, V. Correia, M. Martins, G. Barbosa, R. M. Sousa, G. Minas, S. Lanceros-Mendez and J. G. Rocha, in 2010 IEEE International Symposium on Industrial Electronics, IEEE, 2010, pp. 516–520 Search PubMed.
- F. Chen, Y. Wu, Z. Ding, X. Xia, S. Li, H. Zheng, C. Diao, G. Yue and Y. Zi, Nano Energy, 2019, 56, 241–251 CrossRef CAS.
- G. X. Ni, Y. Zheng, S. Bae, C. Y. Tan, O. Kahya, J. Wu, B. H. Hong, K. Yao and B. Özyilmaz, ACS Nano, 2012, 6, 3935–3942 CrossRef CAS PubMed.
- L. Zhang, J. Gui, Z. Wu, R. Li, Y. Wang, Z. Gong, X. Zhao, C. Sun and S. Guo, Nano Energy, 2019, 65, 103924 CrossRef CAS.
- S. Kim, Y. Dong, M. M. Hossain, S. Gorman, I. Towfeeq, D. Gajula, A. Childress, A. M. Rao and G. Koley, ACS Appl. Mater. Interfaces, 2019, 11, 16006–16017 CrossRef CAS PubMed.
- X. Guan, B. Xu and J. Gong, Nano Energy, 2020, 70, 104516 CrossRef CAS.
- X. Zhou, K. Parida, O. Halevi, Y. Liu, J. Xiong, S. Magdassi and P. S. Lee, Nano Energy, 2020, 72, 104676 CrossRef CAS.
- B. Stadlober, M. Zirkl and M. Irimia-Vladu, Chem. Soc. Rev., 2019, 48, 1787–1825 RSC.
- J. Xue, T. Wu, Y. Dai and Y. Xia, Chem. Rev., 2019, 119, 5298–5415 CrossRef CAS PubMed.
- Z.-D. Liu, Z.-Y. Yin, Z.-H. Du, Y. Yang, M.-M. Zhu, L.-H. Xie and W. Huang, Nanoscale, 2014, 6, 5110 RSC.
- G. Ico, A. Showalter, W. Bosze, S. C. Gott, B. S. Kim, M. P. Rao, N. V. Myung and J. Nam, J. Mater. Chem. A, 2016, 4, 2293–2304 RSC.
- H. Fong, I. Chun and D. Reneker, Polymer, 1999, 40, 4585–4592 CrossRef CAS.
- R. Stepanyan, A. V. Subbotin, L. Cuperus, P. Boonen, M. Dorschu, F. Oosterlinck and M. J. H. Bulters, Polymer, 2016, 97, 428–439 CrossRef CAS.
- M. M. Hohman, M. Shin, G. Rutledge and M. P. Brenner, Phys. Fluids, 2001, 13, 2221–2236 CrossRef CAS.
- A. Haider, S. Haider and I. K. Kang, Arabian J. Chem., 2018, 11, 1165–1188 CrossRef CAS.
- B. Chu, Science, 2006, 313, 334–336 CrossRef CAS PubMed.
- Prateek, V. K. Thakur and R. K. Gupta, Chem. Rev., 2016, 116, 4260–4317 CrossRef CAS PubMed.
- M. Li, H. J. Wondergem, M. J. Spijkman, K. Asadi, I. Katsouras, P. W. M. Blom and D. M. De Leeuw, Nat. Mater., 2013, 12, 433–438 CrossRef CAS PubMed.
- M. Zhu, J. Wu, Z. Du, R. Y. Tay, H. Li, B. Özyilmaz and E. H. T. Teo, Nanoscale, 2015, 7, 14730–14737 RSC.
- Z. Y. Jiang, X. C. Zheng and G. P. Zheng, RSC Adv., 2015, 5, 61946–61954 RSC.
- W. Xia, Z. Wang, J. Xing, C. Cao and Z. Xu, IEEE Trans. Ultrason. Ferroelectr. Freq. Control, 2016, 63, 1674–1680 Search PubMed.
- L. Persano, C. Dagdeviren, Y. Su, Y. Zhang, S. Girardo, D. Pisignano, Y. Huang and J. A. Rogers, Nat. Commun., 2013, 4, 1633 CrossRef PubMed.
- A. N. Arshad, M. H. M. Wahid, M. Rusop, W. H. A. Majid, R. H. Y. Subban and M. D. Rozana, J. Nanomater., 2019, 2019, 1–12 CrossRef.
- Z. Zhang, Y. Zhao and M. Zhu, Appl. Phys. Lett., 2006, 88, 033101 CrossRef.
- Y. Y. Choi, J. Hong, D. S. Leem, M. Park, H. Song, T. H. Sung and K. No, J. Mater. Chem., 2011, 21, 5057–5061 RSC.
- Y. Yao, G. Hou, N. Li, T. Zhou, L. Liu, Y. Liu and J. Leng, J. Appl. Polym. Sci., 2017, 134, 1–11 Search PubMed.
- S. Park, Y. Kwon, M. Sung, B. S. Lee, J. Bae and W. R. Yu, Mater. Des., 2019, 179, 107889 CrossRef CAS.
- C. Wan and C. R. Bowen, J. Mater. Chem. A, 2017, 5, 3091–3128 RSC.
- W. M. Xia, Y. J. Gu, C. Y. You, C. J. Cao, Z. Xu and Z. C. Zhang, RSC Adv., 2015, 5, 107557–107565 RSC.
- Z. L. Wang, J. Chen and L. Lin, Energy Environ. Sci., 2015, 8, 2250–2282 RSC.
- B. Ameduri, Chem. Rev., 2009, 109, 6632–6686 CrossRef CAS PubMed.
- M. M. Abolhasani, M. Naebe, K. Shirvanimoghaddam, H. Fashandi, H. Khayyam, M. Joordens, A. Pipertzis, S. Anwar, R. Berger, G. Floudas, J. Michels and K. Asadi, Nano Energy, 2019, 62, 594–600 CrossRef CAS.
- J. Li, C. Zhao, K. Xia, X. Liu, D. Li and J. Han, Appl. Surf. Sci., 2019, 463, 626–634 CrossRef CAS.
- H. Yuan, T. Lei, Y. Qin and R. Yang, Nano Energy, 2019, 59, 84–90 CrossRef CAS.
- R. A. Surmenev, T. Orlova, R. V. Chernozem, A. A. Ivanova, A. Bartasyte, S. Mathur and M. A. Surmeneva, Nano Energy, 2019, 62, 475–506 CrossRef CAS.
- A. Wang, M. Hu, L. Zhou and X. Qiang, Nanomaterials, 2018, 8, 1021 CrossRef PubMed.
- P. Li, L. Zhao, Z. Jiang, M. Yu, Z. Li and X. Li, Macromol. Mater. Eng., 2019, 304, 1–8 Search PubMed.
- S. Ye, C. Cheng, X. Chen, X. Chen, J. Shao, J. Zhang, H. Hu, H. Tian, X. Li, L. Ma and W. Jia, Nano Energy, 2019, 60, 701–714 CrossRef CAS.
- C. K. Jeong, D. Y. Hyeon, G. T. Hwang, G. J. Lee, M. K. Lee, J. J. Park and K. Il Park, J. Mater. Chem. A, 2019, 7, 25481–25489 RSC.
- T. Sekine, R. Sugano, T. Tashiro, J. Sato, Y. Takeda, H. Matsui, D. Kumaki, F. D. Dos Santos, A. Miyabo and S. Tokito, Sci. Rep., 2018, 8, 1–10 CrossRef PubMed.
Footnote |
| † Electronic supplementary information (ESI) available. See DOI: 10.1039/d0ra03293j |
| This journal is © The Royal Society of Chemistry 2020 |

