 Open Access Article
Thermokinetic behaviour and functional group variation during spontaneous combustion of raw coal and its preoxidised form
Da-Jiang Lia,
Yang Xiao *ab,
Hui-Fei Lü*a,
Bin Laiwangc and
Chi-Min Shu
 c
c
aSchool of Safety Science and Engineering, Xi'an University of Science and Technology (XUST), Xi'an 710054, PR China. E-mail: xiaoy@xust.edu.cn; lvhuifei@stu.xust.edu.cn
bShaanxi Key Laboratory of Prevention and Control of Coal Fire, XUST, Xi'an 710054, PR China
cGraduate School of Engineering Science and Technology, National Yunlin University of Science and Technology, Yunlin 64002, Taiwan, Republic of China
First published on 26th June 2020
Abstract
Coal spontaneous combustion (CSC) is a major problem in coal mining. In the vicinity of underground goaf, secondary or repeated oxidation processes of the residual coal inevitably occur, increasing the risk of coal fires. In this study, the thermal reaction behaviour of two types of raw coal samples and three preoxidised coal samples with different oxidation temperatures (80, 130, and 180 °C) were investigated. The physical and chemical properties of the samples were measured using thermogravimetric analyser-Fourier transform infrared spectroscopy (TGA-FTIR) with heating rates of 1.0, 2.0, 5.0, and 10.0 °C min−1. According to the characteristic temperatures in the heating processes, the entire CSC procedure can be divided into three stages: oxidation, combustion, and burnout. The results indicated that the aliphatic side chain lengths of preoxidised coal were shorter, and the number of branched aliphatic side chains was lower than that of raw coal. Furthermore, the model for the mechanism of preoxidised coal differed from that of raw coal. Average values of the apparent activation energy  of the preoxidised coal samples were lower than those of the raw coal samples. Therefore, compared with raw coal, preoxidised coal requires less energy to react and more readily undergoes spontaneous combustion.
1. Introduction
Coal is at present the main fossil fuel in China, and it will be decades before it is replaced by clean energy sources.1–3 In an environment of continuous oxygen supply and thermal accumulation, coal spontaneous combustion (CSC) can occur. CSC4–9 is an increasing concern because of the damage it can cause to human health, economies, the environment, and social development.10–15 In China, coal fires are particularly prevalent, destroying countless coal resources.16–19 Moreover, China has become a focus of the global impact on reducing CO2 emissions amidst increasing international pressure.20 To reduce the waste from coal energy, numerous coal mines in China have started re-mining in the goaf. The goaf is the cavity left after underground coal or coal gangue mining has been completed. The residual coal has undergone various degrees of oxidation due to air leakage and other reasons, resulting in the existence of oxidised coal in the vicinity of underground goaf. In addition, some coal mines are stratified and mining thick coal seams can improve the percent recovery of the resources. In stratified mining, coal seams are exposed to oxygen in the air, and these seams can be oxidised.Furthermore, for close-distance coal seams, the upper seam that has been mined is fully oxygenated and reoxidised when mining activity has occurred in the lower coal seam. In coal mines, underground mining activities result in large quantities of oxidised coal, but few researchers have studied its spontaneous combustion characteristics. During the mining process of the working face and thick coal seam (or seam groups), residual coal oxidation is prone to occur, increasing the risk of self-heating that can readily lead to CSC.21 When CSC is out of control, a closed fire zone approach is usually adopted. However, fire zone unsealing involves complex and dangerous engineering. Unsealing may cause reignition and additional accidents.22,23 The spontaneous combustion characteristics of oxidised coal in a fire area are remarkably different from those of raw coal. Therefore, the degree of oxidation is a key parameter in evaluating CSC.
At present, research on preoxidised coal has focused on its macro- and micro-characteristics. Macro-experimental tests have mainly addressed CO2 and CO production, rate of oxygen consumption, and thermal release of secondary oxidation.24,25 Moreover, the production of CO2 and CO is temperature-sensitive, and the gaseous concentrations in oxidised coal samples are less than those produced by fresh coal samples.26 Qi et al.27 revealed that the higher the oxygen content, the lower the Ea required for a reaction. Several micro-analyses of the coal molecular structure have investigated spontaneous combustion during secondary oxidation. Liang et al.28 used a scanning electron microscope and infrared spectrum analyser and determined that the tendency of further oxidation of coal after initial oxidation increases. Deng et al.29 employed a Fourier transform infrared (FTIR) spectroscopy instrument and a thermogravimetric analyser (TGA) to explore the exothermic and oxidation behaviours of secondary oxidised coal and inferred that secondary coal oxidation readily causes CSC.
To determine the risks of secondary oxidation, raw coal and preoxidised coal with varying degrees of oxidation were adopted as research objects to identify the thermal characteristics and micro-characteristics of the second oxidation process. The Ea value, which can be calculated using the Flynn–Wall–Ozawa (FWO) method,30 is typically used to identify the energy required for the reaction and to reflect the risk of CSC. In addition, the relationship between kinetics and the degree of coal oxidation was evaluated. The results may guide approaches for safer mining when re-mining.
2. Experimental and method
2.1. Coal samples
Globally, bituminous coal is the most widely distributed and abundant coal resource. China's bituminous coal reserves account for 75% of the country's total coal reserves, but the danger of spontaneous combustion is also the most prominent with bituminous coal.31 Therefore, two types of bituminous coal samples with different metamorphic degrees were chosen as research objects. Coal W was gathered from Wangjialing Coal Mine, which comprises lean coal. Coal N was obtained from Nantun Coal Mine, which produces gas coal (bituminous coal with a low degree of metamorphism). Proximate analysis details of the coal samples are presented in Table 1.32| Coal sample | Mad | Aad | Vad | FCad* | |||||||||||||||||||||||||||||||||||||||||||||||||||||||||||||||||||||||||||||||||||||||||||||||
|---|---|---|---|---|---|---|---|---|---|---|---|---|---|---|---|---|---|---|---|---|---|---|---|---|---|---|---|---|---|---|---|---|---|---|---|---|---|---|---|---|---|---|---|---|---|---|---|---|---|---|---|---|---|---|---|---|---|---|---|---|---|---|---|---|---|---|---|---|---|---|---|---|---|---|---|---|---|---|---|---|---|---|---|---|---|---|---|---|---|---|---|---|---|---|---|---|---|---|---|
| a * by difference; ad: air dried basis; M: moisture; A: ash; V: volatile; FC: fixed carbon. | |||||||||||||||||||||||||||||||||||||||||||||||||||||||||||||||||||||||||||||||||||||||||||||||||||
| W (Wangjialing) | 0.58 | 13.36 | 15.63 | 70.43 | |||||||||||||||||||||||||||||||||||||||||||||||||||||||||||||||||||||||||||||||||||||||||||||||
| N (Nantun) | 3.24 | 8.95 | 28.61 | 59.2 | |||||||||||||||||||||||||||||||||||||||||||||||||||||||||||||||||||||||||||||||||||||||||||||||
Four types of experimental samples were prepared and crushed into sizes of 0.074–0.105 mm.33 One sample was fresh coal that was retained as raw coal, and the others were preoxidised. We placed raw coal to a temperature-programmed instrument under the air atmosphere condition and began the heating process to 80, 130, and 180 °C. The preoxidised coal of coal W was labelled coal W1, W2, and W3 according to the oxidation temperature, and the preoxidised coal of coal N was labelled coal N1, N2, and N3. After being maintained under stable conditions for 30 min and after the subsequent application of nitrogen, the samples were cooled to room temperature to be used as preoxidised coal samples.
2.2. FTIR apparatus
FTIR spectroscopy was employed to identify the content and position of the functional groups in coal.34–36 We used a Perkin Elmer Spectrum 100 FTIR spectrometer to measure the absorption spectra of the four samples. KBr compression was used for preparing the samples. The wavenumber ranged from 4000 to 650 cm−1, and the resolution was 4 cm−1 for four accumulative scans.2.3. Simultaneous thermal analysis-FTIR
The thermal analysis experiments were conducted on a Perkin Elmer Pyris 1 Thermogravimeter coupled with a Perkin Elmer Spectrum 100 FTIR spectrometer. The coal samples used in these nonisothermal tests were heated from 30 to 900 °C in an air atmosphere at 100 mL min−1, at heating rates of 1.0, 2.0, 5.0, and 10.0 °C min−1. A low heating rate was used to reduce the thermal lag of the samples.37 The infrared cell gas temperature was set at 200 °C to avoid the condensation of volatiles. FTIR data delay was set to 30 s to minimise the time lag between the TG and FTIR (i.e., the time required for the gas to be transferred from the TGA to the FTIR spectrometer).2.4. Methods
 | (1) |
 | (2) |
Through various transformations of eqn (1), a variety of kinetic equations can be derived. Isoconversional model-free methods avoid the need to choose fitting models. For the present object, the FWO method was employed to calculate Ea. The FWO equation is expressed as follows:30
 | (3) |
When the regression lines of ln(βi) vs. 1/Tα are plotted, Ea can be obtained from the slope.
 | (4) |
For eqn (3), the corresponding temperature T can be substituted at the selected α under different β values; y(α) = (T/T0.5)2(dα/dt)/(dα/dt)0.5 can be drawn as an experimental curve, and then the plot y(α) = f(α)G(α)/f(0.5)G(0.5) can be derived as a standard curve. The selected f(α) is correct if the experimental plot coincides with (or approximates to) the standard plot. The mathematical expressions of the f(α) and G(α) functions are summarised in Table 2.40
| Number | Model | Differential form f(α) | Integral form G(α) |
|---|---|---|---|
| Diffusion model | |||
| 1 | 1D diffusion D1 | −1/2α−1 | α2 |
| 2 | 2D diffusion-Valensi D-V2 | [−ln(1 − α)]−1 | α + (1 − α)ln(1 − α) |
| 3 | 3D diffusion-Jander D-J3 | 6(1 − α)2/3[1 − (1 − α)1/3]1/2 | [1 − (1 − α)1/3]1/2 |
| 4 | 3D Zhuravlev-Leskin-Tempelman D-ZLT3 | 3/2(1 − α)4/3[(1 − α)−1/3 − 1]−1 | [(1 − α)−1/3 − 1]2 |
![[thin space (1/6-em)]](https://www.rsc.org/images/entities/char_2009.gif) |
|||
| Sigmoidal rate equations | |||
| 5 | Avarami-Erofeev A2 | 1/2(1 − α)[−ln(1 − α)]−1 | [−ln(1 − α)]2 |
| 6 | Avarami-Erofeev A3 | 1/3(1 − α)[−ln(1 − α)]−2 | [−ln(1 − α)]3 |
| 7 | Avarami-Erofeev A4 | 1/4(1 − α)[−ln(1 − α)]−3 | [−ln(1 − α)]4 |
![[thin space (1/6-em)]](https://www.rsc.org/images/entities/char_2009.gif) |
|||
| Reaction order models | |||
| 8 | Second-order chemical reaction F2 | (1 − α)2 | (1 − α)−1 − 1 |
| 9 | Third-order chemical reaction F3 | (1 − α)3 | −1/2(1 − (1 − α)−2) |
![[thin space (1/6-em)]](https://www.rsc.org/images/entities/char_2009.gif) |
|||
| Exponent power models | |||
| 10 | First-order E1 | α | ln![[thin space (1/6-em)]](https://www.rsc.org/images/entities/char_2009.gif) α α |
| 11 | Second-order E2 | 1/2α | ln![[thin space (1/6-em)]](https://www.rsc.org/images/entities/char_2009.gif) α2 α2 |
![[thin space (1/6-em)]](https://www.rsc.org/images/entities/char_2009.gif) |
|||
| Geometrical contraction models | |||
| 12 | Contracting area R2 | 2(1 − α)1/2 | 1 − (1 − α)1/2 |
| 13 | 3D contracting volume R3 | (1 − α)2/3 | 3[1 − (1 − α)1/3] |
 | (5) |
3. Results and discussion
3.1. Functional groups
Quantitative analysis of the various functional groups of coal was conducted by measuring the FTIR spectra. We assumed that two types of carbon namely aromatic and aliphatic, were present in the coal. The integrated area ratios I1 (3000–2800 cm−1/1613 cm−1) and I2 (3000–2800 cm−1/900–700 cm−1) can be used to represent the relative abundance of the aliphatic and aromatic functional groups. The extent of aromatic ring condensation was estimated from the integral area ratio I3 (900–700 cm−1/1613 cm−1). Moreover, the length and number of branching aliphatic side chains were calculated by using the ratio of CH2/CH3 (2921 cm−1/2959 cm−1).41–44The coal structural parameters are given in Table 3. Compared with raw coal, the I1 value of the preoxidised coal samples was approximately 1, indicating that the aliphatic functional groups were unchanged. The I2 values of the preoxidised coal were lower than that of raw coal, signifying that the amount of aliphatic CH was lower than that of aromatic CH. The I3 values of the preoxidised coal were higher than those of raw coal, signifying that the extent of aromatic ring condensation was greater than that in raw coal. The CH2/CH3 values of the preoxidised coal were lower than those of raw coal, demonstrating that the lengths of aliphatic side chains were shorter and that the number of branching aliphatic side chains was fewer. The results demonstrated that the number of various functional groups in the samples differed. In addition, the aliphatic side chain lengths of the preoxidised coal samples were shorter, which revealed that the samples were more prone to spontaneous combustion.
| Coal sample | I1 | I2 | I3 | CH2/CH3 | |
|---|---|---|---|---|---|
| W | Raw coal | 1.09 | 0.97 | 1.13 | 1.07 |
| Coal W1 | 1.02 | 0.89 | 1.14 | 1.04 | |
| Coal W2 | 1.03 | 0.88 | 1.17 | 0.40 | |
| Coal W3 | 1.16 | 0.95 | 1.18 | 1.02 | |
| N | Raw coal | 0.94 | 1.23 | 0.76 | 1.12 |
| Coal N1 | 1.04 | 1.12 | 0.93 | 1.04 | |
| Coal N2 | 1.02 | 1.06 | 0.97 | 1.02 | |
| Coal N3 | 0.93 | 1.02 | 0.91 | 0.98 | |
3.2. Characteristic temperatures
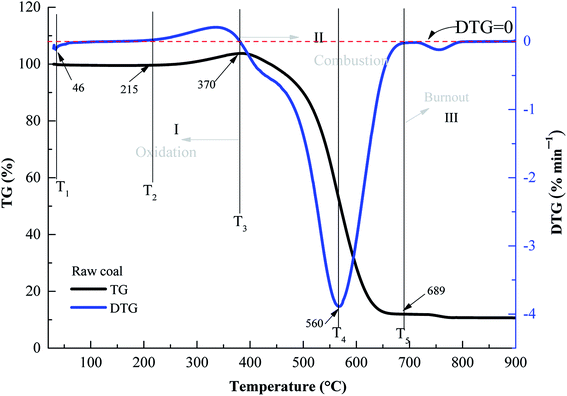
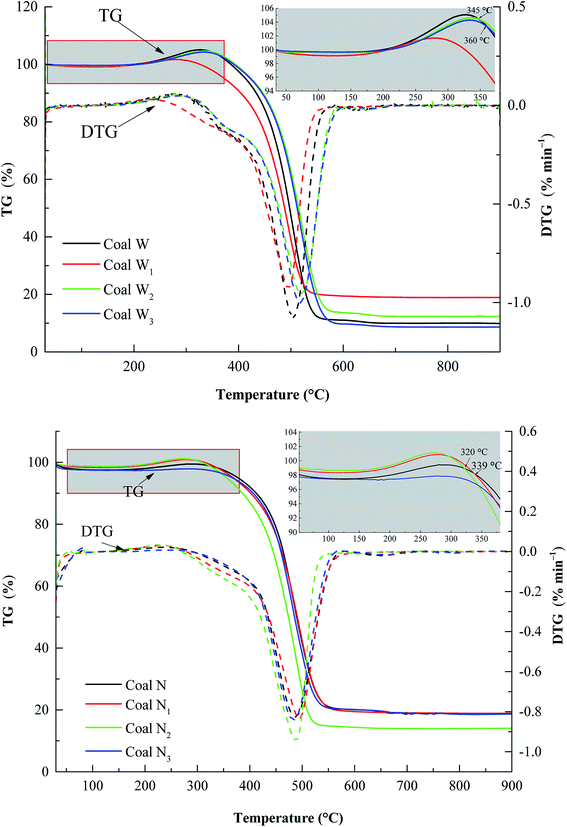
T1 is the temperature at which the TG curve reached the first mass loss (initial TGmin). T2 is the temperature when the TG curve value was at a minimum. T3 is the temperature when the TG curve value was zero. At this temperature, the oxidation reaction between oxygen and coal then begins to accelerate, and the mass loss of the coal sample commences to increase. Some active groups of coal molecular structures underwent a multi-step reaction. The TG curve to the lowest point and then quickly arrived at the stage of rapid mass loss. At this time, when the DTG curve was at the extreme value, CO and CO2 were released and T4 was reached (DTGmin). Finally, the mass loss rate reached the maximum, representing T5. According to the characteristic temperatures, the entire reaction can be divided three stages of oxidation (stage I), combustion (stage II), and burnout (stage III) (Fig. 1).Fig. 2 displays the TG experimental results of the various preoxidised coal samples at 1.0 °C min−1. The mass loss rate of coal W1 was distinctly greater than that of the raw sample until 520 °C. Moreover, the coal mass loss rates of W2 and W3 were higher than those of the raw sample at temperatures below 345 and 360 °C, respectively. The mass loss rate of coal N3 was also significantly greater than that of the raw sample. The mass loss rates of coal N1 and N2 were greater than the raw sample above 339 and 322 °C, respectively. This may be due to the increase in the porosity and specific surface area of coal samples after oxidation. Compared with raw coal, the contact area between the preoxidised coal samples and oxygen was increased, resulting in an enhanced coal-oxygen reaction, in which mass loss was greater than that for raw coal.45 Therefore, in the preoxidised coal samples, reoxidation readily occurred at a certain stage, posing a higher thermal hazard during CSC.
3.3. Thermokinetic parameters
In accordance with the FWO method, as with coal W for example, Ea was calculated using eqn (2) (Fig. 3), which demonstrated a favourable correlation coefficient. To illustrate the relationships between Ea and α, cubic polynomials were used for model fitting. In Fig. 4, the equations are provided next to each curve. In Fig. 4(a), an analysis of stage I is presented. Ea increased with increasing conversion. Simultaneously, for both coal W and coal N, the preoxidised samples were altered less than the raw coal sample was. The gradual self-activation reaction of CSC46 demonstrated that during the chemical adsorption of oxygen, functional groups were gradually activated and oxidised. Initially, some functional groups were readily activated at low temperatures; thus, Ea was lower. As the temperature increased, functional groups that were not originally involved in the reaction were progressively activated and began to participate in the oxidation reaction. Therefore, it required more energy, and the Ea was higher. At this point, preoxidised samples with more active groups had been activated, resulting in lower energy than that of raw coal. As can be observed in Fig. 4(b), in stage II, Ea first increased and subsequently decreased.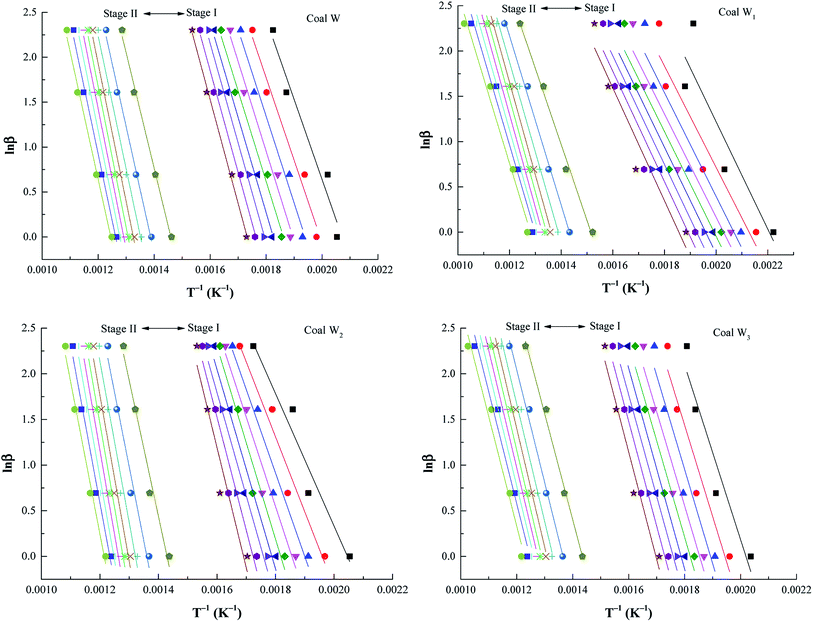 | ||
| Fig. 3 FWO fitting curves of preoxidised coal W samples. Note: from right to left line indicate the values obtained for α at stage I and stage II (α = 0.1, 0.2, 0.3, 0.4, 0.5, 0.6, 0.7, 0.8, 0.9). | ||
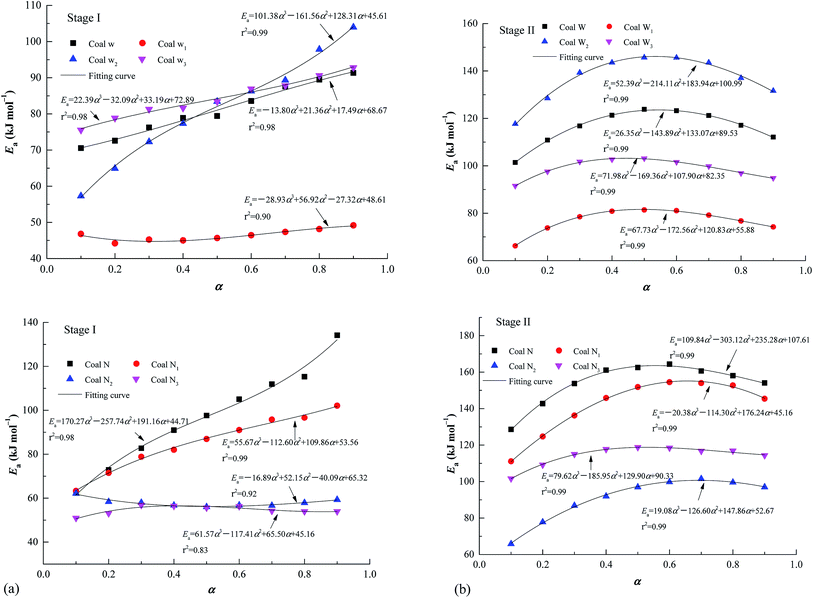 | ||
| Fig. 4 Graphs showing the relationship between apparent activation energy and conversion degree: (a) stage I and (b) stage II. | ||
When the oxidation reaction entered the combustion stage, the reaction rate of macromolecules increased due to the elevated temperature. More energy was required to start the reaction, resulting in an increase in Ea. With the gradual progress of the reaction to the burning stage, the required energy decreased. According to Fig. 4, for coal N, the Ea of the preoxidised samples was less than that of raw coal. The Ea of coal W1 was also less than that of raw coal. The Ea of coal W3 was less than that of raw coal in stage II, and the Ea of coal W2 was less than that of raw coal at stage I below 263 °C.
The models constructed using the Málek method are displayed in Table 4 and Fig. 5. As illustrated in Fig. 5(a), the degree of preoxidised was different and the mode for the mechanism was changed. This phenomenon may be attributed to predominant reactants governing the reaction is different, which explained by the inherent properties and thermal stability of coal. Moreover, the mechanisms of oxidation and combustion were reported to differ due to the chemical bonds being successively ruptured or broken with increasing temperature and Ea.47 As depicted in Fig. 5(b), the heating rate exerted little effect on the model for the mechanism of every stage, particularly in stage I. In addition, in stage II, as the heating rate increased, the model changed from unidimensional to multidimensional. The FWO method provides the average values of Ea  and ln
![[thin space (1/6-em)]](https://www.rsc.org/images/entities/char_2009.gif) A
A  , as presented in Table 4. The
  and
and  values of the preoxidised coal samples were less than those of raw coal. Generally, the thermal risk of preoxidised coal was amplified, and it was more prone to spontaneous combustion.
| Stage | Coal sample | Y(α) model | Pearson correlation coefficient λ | ||||||||||||||||||||||||||||||||||||||||||||||||||||||||||||||||||||||||||||||||||||||||||||||||
|---|---|---|---|---|---|---|---|---|---|---|---|---|---|---|---|---|---|---|---|---|---|---|---|---|---|---|---|---|---|---|---|---|---|---|---|---|---|---|---|---|---|---|---|---|---|---|---|---|---|---|---|---|---|---|---|---|---|---|---|---|---|---|---|---|---|---|---|---|---|---|---|---|---|---|---|---|---|---|---|---|---|---|---|---|---|---|---|---|---|---|---|---|---|---|---|---|---|---|---|
| a Experimental values were selected as the X specimen, whereas models were selected as the Y specimen. | |||||||||||||||||||||||||||||||||||||||||||||||||||||||||||||||||||||||||||||||||||||||||||||||||||
| I | W | Raw coal | 81.47 | R | 0.90 | 155 | |||||||||||||||||||||||||||||||||||||||||||||||||||||||||||||||||||||||||||||||||||||||||||||
| Coal W1 | 46.46 | R | 0.89 | 77 | |||||||||||||||||||||||||||||||||||||||||||||||||||||||||||||||||||||||||||||||||||||||||||||||
| Coal W2 | 81.41 | D-J3 | 0.99 | 135 | |||||||||||||||||||||||||||||||||||||||||||||||||||||||||||||||||||||||||||||||||||||||||||||||
| Coal W3 | 80.32 | D-J3 | 0.99 | 150 | |||||||||||||||||||||||||||||||||||||||||||||||||||||||||||||||||||||||||||||||||||||||||||||||
| N | Raw coal | 96.99 | D-J3 | 0.99 | 166 | ||||||||||||||||||||||||||||||||||||||||||||||||||||||||||||||||||||||||||||||||||||||||||||||
| Coal N1 | 85.36 | A | 0.99 | 116 | |||||||||||||||||||||||||||||||||||||||||||||||||||||||||||||||||||||||||||||||||||||||||||||||
| Coal N2 | 57.99 | R | 0.99 | 106 | |||||||||||||||||||||||||||||||||||||||||||||||||||||||||||||||||||||||||||||||||||||||||||||||
| Coal N3 | 54.59 | D-J3 | 0.99 | 111 | |||||||||||||||||||||||||||||||||||||||||||||||||||||||||||||||||||||||||||||||||||||||||||||||
| II | W | Raw coal | 116.43 | A | 0.98 | 181 | |||||||||||||||||||||||||||||||||||||||||||||||||||||||||||||||||||||||||||||||||||||||||||||
| Coal W1 | 76.89 | A | 0.93 | 121 | |||||||||||||||||||||||||||||||||||||||||||||||||||||||||||||||||||||||||||||||||||||||||||||||
| Coal W2 | 106.95 | D-ZLT3 | 0.90 | 208 | |||||||||||||||||||||||||||||||||||||||||||||||||||||||||||||||||||||||||||||||||||||||||||||||
| Coal W3 | 98.87 | D-ZLT3 | 0.90 | 179 | |||||||||||||||||||||||||||||||||||||||||||||||||||||||||||||||||||||||||||||||||||||||||||||||
| N | Raw coal | 152.20 | D-ZLT3 | 0.99 | 266 | ||||||||||||||||||||||||||||||||||||||||||||||||||||||||||||||||||||||||||||||||||||||||||||||
| Coal N1 | 141.81 | A | 0.99 | 181 | |||||||||||||||||||||||||||||||||||||||||||||||||||||||||||||||||||||||||||||||||||||||||||||||
| Coal N2 | 90.80 | A | 0.99 | 126 | |||||||||||||||||||||||||||||||||||||||||||||||||||||||||||||||||||||||||||||||||||||||||||||||
| Coal N3 | 114.31 | D-ZLT3 | 0.99 | 225 | |||||||||||||||||||||||||||||||||||||||||||||||||||||||||||||||||||||||||||||||||||||||||||||||
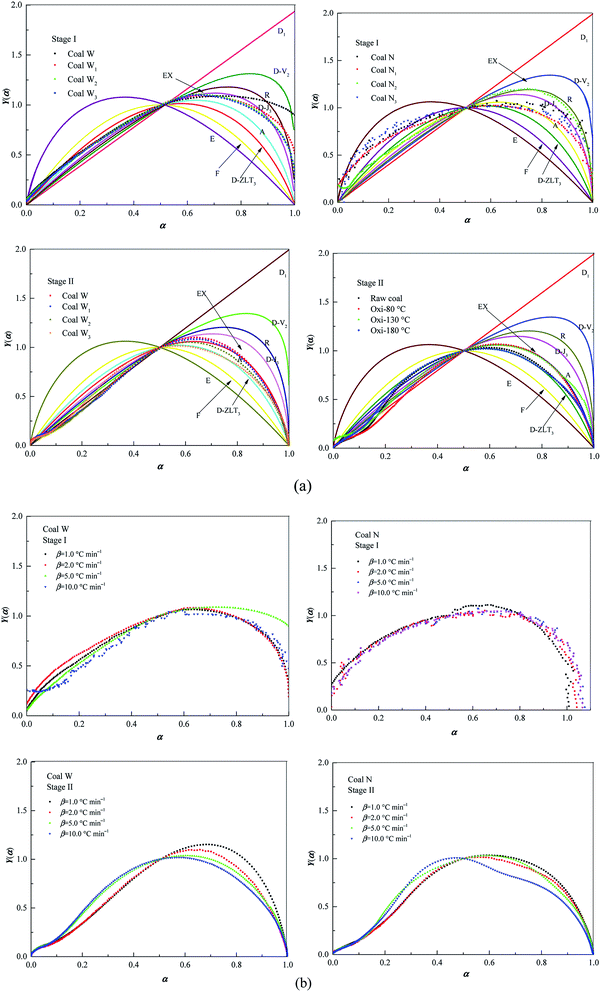 | ||
| Fig. 5 Experimental and standard Y(α) plots calculated for stage II on (a) various preoxidised coal samples at 5.0 °C min−1 and (b) raw coal at different heating rates. | ||
According to the results of TG tests, the thermal mass loss process of preoxidised coal and raw coal differed considerably, and this difference was also related to the degree of metamorphism of raw coal. For coal W, with a high metamorphic degree, the mass loss rate of the preoxidised coal in the oxidation stage of CSC was greater than that of raw coal. For coal N with its low metamorphic degree, the mass loss rate of the preoxidised coal in the combustion stage of CSC was greater than that of raw coal. Based on the Ea calculated by TG tests, the Ea of the preoxidised coal was lower than that of raw coal. For coal W, the Ea of the preoxidised coal with the oxidation temperature of 80 °C was the lowest. The Ea of preoxidised coal N generally presented a trend of gradually decreasing with the increase of the oxidation temperature. The risk of spontaneous combustion of preoxidised coal was higher than that of raw coal. However, the degree of coal metamorphism differed, and the corresponding oxidation temperature was different when the risk of spontaneous combustion was the highest. For low metamorphic degree coal, the higher the oxidation temperature, the greater the risk of spontaneous combustion.
3.4. Gaseous products
Fig. 6 depicts selected IR spectra during oxidation of raw coal at 5.0 °C min−1 and indicates the occurrence of a detailed chemical structural change during oxidation. Specifically, the gaseous compounds released were mainly composed of CO in the 2230–2030 cm−1 range, CO2 in the 2400–2270 cm−1 range, CH4 at 1300 cm−1, aliphatic hydrocarbons in the 3000–2800 cm−1 range, C–O at 1180 cm−1, attributed to phenols, and C![[double bond, length as m-dash]](https://www.rsc.org/images/entities/char_e001.gif) O at 1726 cm−1, which are attributed to compounds, such as aldehydes, esters, and ketones (Fig. 6).48 Fig. 6(a) describes coal W, and the results indicate that CO2 and CO were released at T1. With the increase in temperature, the aliphatic carboxylic acids were gradually converted to aromatic carboxyl. The reaction of aromatic structures appeared to be the principle reason for the rapid mass loss of the coal above 350 °C. Fig. 6(b) indicates that the noticeable difference in coal N was that mainly CO, CO2, CH4, C2H4, due to aliphatic hydrocarbons were reaction. As the temperature increased, the amounts of CH4 and C2H2 released were enhanced, progressing into the combustion stage. Accordingly, small light aromatics, aliphatic gas molecules, and C
O at 1726 cm−1, which are attributed to compounds, such as aldehydes, esters, and ketones (Fig. 6).48 Fig. 6(a) describes coal W, and the results indicate that CO2 and CO were released at T1. With the increase in temperature, the aliphatic carboxylic acids were gradually converted to aromatic carboxyl. The reaction of aromatic structures appeared to be the principle reason for the rapid mass loss of the coal above 350 °C. Fig. 6(b) indicates that the noticeable difference in coal N was that mainly CO, CO2, CH4, C2H4, due to aliphatic hydrocarbons were reaction. As the temperature increased, the amounts of CH4 and C2H2 released were enhanced, progressing into the combustion stage. Accordingly, small light aromatics, aliphatic gas molecules, and C![[double bond, length as m-dash]](https://www.rsc.org/images/entities/char_e001.gif) O (presented in aldehydes, esters, ketones, etc.) were all produced at temperatures close to 350 °C.
O (presented in aldehydes, esters, ketones, etc.) were all produced at temperatures close to 350 °C.
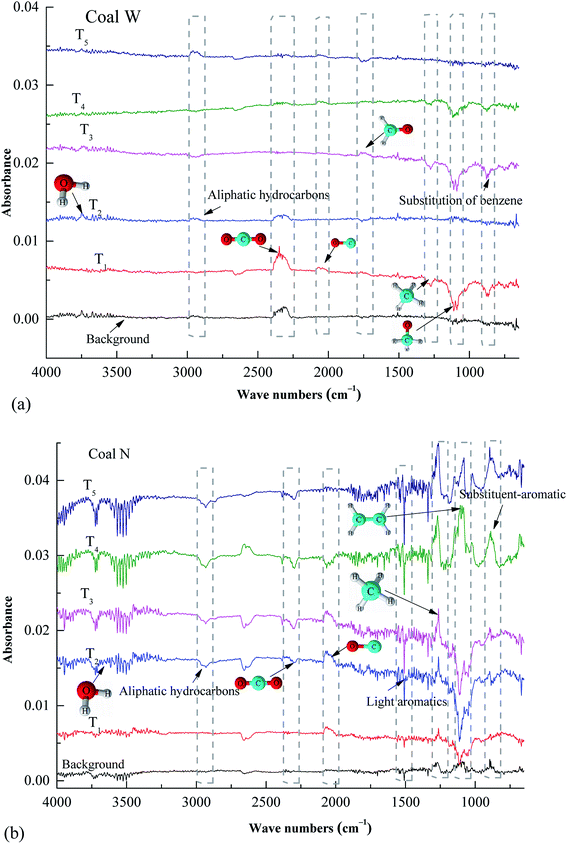 | ||
| Fig. 6 IR spectra of gaseous products obtained from oxidation of raw coal at 5.0 °C min−1 at characteristic temperatures: (a) coal W and (b) coal N. | ||
4. Conclusions
This study characterised preoxidised CSCs at differing degrees of oxidation and revealed their physical and chemical characteristics. Their oxidation kinetic parameters were computed using the FWO method, and models were constructed using the Málek method. Furthermore, FTIR analysis was employed to research the chemical structures of the coal samples. Theoretical analysis and experimental tests were combined to explore the spontaneous combustion process of preoxidised coal samples. The conclusions drawn are as follows:• Compared with raw coal, the relative abundance of aliphatic functional groups was unchanged in preoxidised coal, but aliphatic side chain lengths were shorter, and the number of branching aliphatic side chains was lower, indicating that the preoxidised coal samples were more prone to spontaneous combustion.
• Calculations based on kinetic models indicated that the heating rate had little effect on the oxidation process, but the model for the mechanism of preoxidised coal differed from that of raw coal. The  values of the preoxidised coal were lower than that of raw coal. The preoxidised coal required less energy to react and more readily undergoes spontaneous combustion.
• The intensities and emission temperatures of CO2 and CH4, investigated through TG-FTIR analysis, exhibited apparent differences due to the functional groups, and the chemical structures of coal W and coal N played prominent roles in the oxidation process. The oxidation of aromatic structures appeared to be the principal reason for the prompt mass loss of coal above 350 °C.
Conflicts of interest
There are no conflicts to declare.Nomenclature
Greek letters
| α | Conversion degree |
| β | Heating rate (°C min−1) |
| λ | Pearson correlation coefficient |
Acknowledgements
This work was supported by the National Key R&D Program of China (No. 2018YFC0807900), and the National Natural Science Foundation of China (No. 5197-4233).References
- J. Deng, H. F. Lü, Y. Xiao, D. J. Li, L. Yin and C. M. Shu, Inhibiting effects of 1-butyl-3-methyl imidazole tetrafluoroborate on coal spontaneous combustion under different oxygen concentrations, Energy, 2019, 186, 115907 CrossRef.
- A. D. Gianfrancesco, Worldwide overview and trend for clean and efficient use of coal, Mater. Ultra-Supercrit. Adv. Ultra-supercrit. Power Plants, 2017, pp. 643–687 Search PubMed.
- C. Wang, S. Wu, Q. Lv, X. Liu, W. Cheng and D. Che, et al., Study on correlations of coal chemical properties based on the database of real-time data, Appl. Energy, 2017, 204, 1115–1123 CrossRef CAS.
- H. Choi, W. Jo, S. Kim, J. Yoo, D. Chun and Y. Rhim, et al., Comparison of spontaneous combustion susceptibility of coal dried by different processes from low-rank coal, Korean J. Chem. Eng., 2014, 31, 2151–2156 CrossRef CAS.
- Q. W. Li, Y. Xiao, K. Q. Zhong, C. M. Shu, H. F. Lü, J. Deng and S. Wu, Overview of commonly used materials for coal spontaneous combustion prevention, Fuel, 2020, 275, 117981 CrossRef CAS.
- W. Lu, B. L. Guo, G. S. Qi, W. M. Cheng and W. Y. Yang, Experimental study on the effect of preinhibition temperature on the spontaneous combustion of coal based on an MgCl2 solution, Fuel, 2020, 265, 117032 CrossRef CAS.
- Z. Y. Wu, S. S. Hu, S. G. Jiang, X. J. He, H. Shao and K. Wang, et al., Experimental study on prevention and control of coal spontaneous combustion with heat control inhibitor, J. Loss Prev. Process Ind., 2018, 56, 272–277 CrossRef CAS.
- F. Q. Yang, Y. Lai and Y. Z. Song, Determination of the influence of pyrite on coal spontaneous combustion by thermodynamics analysis, Process Saf. Environ. Prot., 2019, 129, 163–167 CrossRef CAS.
- B. Li, G. Liu, W. Gao, H. Y. Cong, M. S. Bi and L. Ma, et al., Study of combustion behaviour and kinetics modelling of Chinese Gongwusu coal gangue: Model-fitting and model-free approaches, Fuel, 2020, 268, 117284 CrossRef CAS.
- Q. W. Li, Y. Xiao, C. P. Wang, J. Deng and C. M. Shu, Thermokinetic characteristics of coal spontaneous combustion based on thermogravimetric analysis, Fuel, 2019, 250, 235–244 CrossRef CAS.
- S. J. Ren, C. P. Wang, Y. Xiao, J. Deng, Y. Tian and J. J. Song, et al., Thermal properties of coal during low temperature oxidation using a grey correlation method, Fuel, 2020, 260, 116287 CrossRef CAS.
- J. Deng, L. F. Ren, Q. W. Li, Y. Xiao, L. Ma and W. F. Wang, Inhibiting effect of CO2 on the oxidative combustion thermodynamics of coal, RSC Adv., 2019, 9, 41126–41134 RSC.
- X. Pan, G. Li and T. Gao, Risk of respiratory-research on health hazards and economic loss assessment of PM2.5, Beijing, China Environ. Sci. Press, 2012. [in Chinese] Search PubMed.
- Z. J. Bai, C. P. Wang, J. Deng, F. R. Kang and C. M. Chu, Experimental investigation on using ionic liquid to control spontaneous combustion of lignite, Process Saf. Environ. Prot., 2020, 142, 138–149 CrossRef CAS.
- D. J. Li, Y. Xiao, H. F. Lü, F. Xu, K. H. Liu and C. M. Shu, Effects of 1-butyl-3-methylimidazolium tetrafluoroborate on the exothermic and heat transfer characteristics of coal during low-temperature oxidation, Fuel, 2020, 273, 117589 CrossRef CAS.
- Y. Xiao, T. Guo, C. M. Shu, Q. W. Li, D. J. Li and L. G. Chen, Effects of oxygen concentrations on the coal oxidation characteristics and functional groups, J. Therm. Anal. Calorim., 2020 DOI:10.1007/s10973-020-09607-w.
- Y. Xiao, L. Yin, J. Deng, C. P. Wang and C. M. Shu, Thermophysical parameters of coal with various levels of preoxidation, J. Therm. Anal. Calorim., 2019, 135, 2819–2829 CrossRef CAS.
- J. H. Li, Z. H. Li, C. J. Wang, Y. L. Yang and X. Y. Zhang, Experimental study on the inhibitory effect of ethylenediaminetetraacetic acid (EDTA) on coal spontaneous combustion, Fuel Process. Technol., 2018, 178, 312–321 CrossRef CAS.
- Y. N. Zheng, Q. Z. Li, B. Q. Lin, Y. Zhou, Q. Liu and G. Y. Zhang, et al., Real-time analysis of the changing trends of functional groups and corresponding gas generated law during coal spontaneous combustion, Fuel Process. Technol., 2020, 199, 106237 CrossRef CAS.
- S. Li, L. Gao and H. Jin, Life cycle energy use and GHG emission assessment of coal-based SNG and power cogeneration technology in China, Energy Convers. Manage., 2016, 112, 91–100 CrossRef CAS.
- M. Perdochova, K. Derychova, H. Veznikova, A. Bernatik and M. Pitt, The influence of oxygen concentration on the composition of gaseous products occurring during the self-heating of coal and wood sawdust, Process Saf. Environ. Prot., 2015, 94, 463–470 CrossRef CAS.
- G. B. Stracher and T. P. Taylor, Coal fires burning out of control around the world: thermodynamic recipe for environmental catastrophe, Int. J. Coal Geol., 2004, 59, 7–17 CrossRef CAS.
- Z. Luo, Q. Hao, T. Wang, R. Li, F. Cheng and J. Deng, Experimental study on the deflagration characteristics of methane-ethane mixtures in a closed duct, Fuel, 2020, 259, 116295 CrossRef CAS.
- K. Baris, S. Kizgut and V. Didari, Low-temperature oxidation of some Turkish coals, Fuel, 2012, 93, 423–432 CrossRef CAS.
- Y. Zhang, J. Wu, L. Chang, J. Wang and Z. Li, Changes in the reaction regime during low-temperature oxidation of coal in confined spaces, J. Loss Prev. Process Ind., 2013, 26, 1221–1229 CrossRef CAS.
- Y. Xiao, S. J. Ren, J. Deng and C. M. Shu, Comparative analysis of thermokinetic behavior and gaseous products between first and second coal spontaneous combustion, Fuel, 2018, 227, 325–333 CrossRef CAS.
- G. Qi, D. Wang, K. Zheng, J. Xu, X. Qi and X. Zhong, Kinetics characteristics of coal low-temperature oxidation in oxygen depleted air, J. Loss Prev. Process Ind., 2015, 35, 224–231 CrossRef CAS.
- Y. Liang, F. Tian, H. Luo and H. Tang, Characteristics of coal re-oxidation based on microstructural and spectral observation, Int. J. Min. Sci. Technol., 2015, 25, 749–754 CrossRef CAS.
- J. Deng, J. Y. Zhao, A. C. Huang, Y. N. Zhang, C. P. Wang and C. M. Shu, Thermal behavior and microcharacterization analysis of second-oxidised coal, J. Therm. Anal. Calorim., 2017, 127, 439–448 CrossRef CAS.
- R. Hu, Thermal Analysis Kinetics, Science Press, Beijing, PR, China, 2nd ed., 2008 Search PubMed.
- X. Chen, T. Ma, X. Zhai and C. Lei, Thermogravimetric and infrared spectroscopic study of bituminous coal spontaneous combustion to analyze combustion reaction kinetics, Thermochim. Acta, 2019, 676, 84–93 CrossRef CAS.
- Y. G. Wu, X. Y. Yu, S. Y. Hu, H. Shao, Q. Liao and Y. R. Fan, Experimental study of the effects of stacking modes on the spontaneous combustion of coal gangue, Process Saf. Environ. Prot., 2019, 123, 39–47 CrossRef CAS.
- GB 474–2008, Standard of China-Method for preparation of coal sample, ISO 18283, Hard coal and coke–Manual sampling, Beijing, PR, China, 2006 [in Chinese].
- H. Cheng, Q. Liu, M. Huang, S. Zhang and R. L. Frost, Application of TG-FTIR to study SO2 evolved during the thermal decomposition of coal-derived pyrite, Thermochim. Acta, 2013, 555, 1–6 CrossRef CAS.
- S. Scaccia, TG-FTIR and kinetics of devolatilization of Sulcis coal, J. Anal. Appl. Pyrolysis, 2013, 104, 95–102 CrossRef CAS.
- J. M. Andrés and M. T. Bona, ASTM clustering for improving coal analysis by near-infrared spectroscopy, Talanta, 2006, 70, 711–719 CrossRef PubMed.
- J. Zhan, H. Wang, F. Zhu and S. Song, Analysis on the governing reactions in coal oxidation at temperatures up to 400 °C, Int. J. Min. Sci. Technol., 2014, 3, 19–28 Search PubMed.
- F. J. Gotor, J. M. Criado, J. Malek and N. Koga, Kinetic analysis of solid-state reactions: the universality of master plots for analyzing isothermal and nonisothermal experiments, J. Phys. Chem. A, 2000, 104, 10777–10782 CrossRef CAS.
- J. Málek, The kinetic analysis of non-isothermal data, Thermochim. Acta, 1992, 200, 257–269 CrossRef.
- F. Bai, W. Guo, X. Lü, Y. Liu, M. Guo and Q. Li, et al., Kinetic study on the pyrolysis behavior of Huadian oil shale via non-isothermal thermogravimetric data, Fuel, 2015, 146, 111–118 CrossRef CAS.
- S. Wang, Y. Tang, H. H. Schobert, Y. Guo, W. Gao and X. Lu, FTIR and simultaneous TG/MS/FTIR study of Late Permian coals from southern China, J. Anal. Appl. Pyrolysis, 2013, 100, 75–80 CrossRef CAS.
- S. Wang, Y. Tang, H. H. Schobert, Y. Guo and Y. Su, FTIR and 13C NMR investigation of coal component of Late Permian coals from southern China, Energy Fuels, 2011, 25, 5672–5677 CrossRef CAS.
- Y. Guo, J. J. Renton and J. H. Penn, FTIR microspectroscopy of particular liptinite- (lopinite-) rich, Late Permian coals from Southern China, Int. J. Coal Geol., 1996, 29, 187–197 CrossRef CAS.
- M. Mastalerz and R. Marc Bustin, Electron microprobe and micro-FTIR analyses applied to maceral chemistry, Int. J. Coal Geol., 1993, 24, 333–345 CrossRef CAS.
- J. Deng, J. Zhao, Y. Zhang, A. Huang, X. Liu and X. Zhai, et al., Thermal analysis of spontaneous combustion behavior of partially oxidised coal, Process Saf. Environ. Prot., 2016, 104, 218–224 CrossRef CAS.
- W. Lu, Q. T. Hu, X. X. Zhong and D. M. Wang, Gradual self-activation reaction theory of spontaneous combustion of coal, J. China Univ. Min. Technol., 2007, 36, 111–115 CAS.
- W. Wang, S. Li, C. Yue and Y. Ma, Multistep pyrolysis kinetics of North Korean oil shale, J. Therm. Anal. Calorim., 2015, 119, 643–649 CrossRef CAS.
- B. Tian, Y. Y. Qiao, Y. Y. Tian and Q. Liu, Investigation on the effect of particle size and heating rate on pyrolysis characteristics of a bituminous coal by TG–FTIR, J. Anal. Appl. Pyrolysis, 2016, 121, 376–386 CrossRef CAS.
| This journal is © The Royal Society of Chemistry 2020 |

