 Open Access Article
Integration of fluorescent probes into metal–organic frameworks for improved performances
Huihui
Li
 a,
Weiting
Yang
 *ab and
Qinhe
Pan
 *a
*a
aKey Laboratory of Advanced Materials of Tropical Island Resources (Ministry of Education), School of Science, Hainan University, Haikou 570228, China. E-mail: yangwt@hainanu.edu.cn; panqinhe@163.com
bKey Laboratory of Advanced Energy Materials Chemistry (Ministry of Education), Nankai University, Tianjin 300071, China
First published on 14th September 2020
Abstract
Recent years have witnessed a rapid development of fluorescent probes in both analytical sensing and optical imaging. Enormous efforts have been devoted to the regulation of fluorescent probes during their development, such as improving accuracy, sensitivity, selectivity, recyclability and overcoming the aggregation-caused quenching effect. Metal–organic frameworks (MOFs) as a new class of crystalline porous materials possess abundant host–guest chemistry, based on which they display a great application potential in regulating fluorescent probes. This review summarized the research works on the regulation of fluorescent probes using MOFs, with emphasis on the methods of integrating fluorescent probes into MOFs, the regulation effects of MOFs on fluorescent probes, the superiorities of MOFs in regulating fluorescent probes, and the outlook of this subject. It is desirably hoped that this review can provide a useful reference for the researchers interested in this field.
1. Introduction
In recent years, the research on fluorescent probes in both analytical sensing and optical imaging has experienced a rapid development,1–6 encouraged by their distinctive advantages of visualization, noninvasion and facile operation. Fluorescent probes are largely constructed with fluorescent small molecules as the fluorophores in the early stage of their development,7–9 while in the last couple of decades, there is an increasing attention on material-based fluorescent probes attributed to the emergence of various fluorescent materials.10–12 As for the targeted analytes, they have been extended from simple ions and small molecules to biomacromolecules and even living cells,13–16 accompanied by the number of analytes expanding to multiple substances from a single one,17–20 which is helpful to understand more sample information and investigate the reciprocal effect of analytes.Enormous efforts have been devoted to the regulation of fluorescent probes during their development, such as improving accuracy, sensitivity, selectivity, recyclability and overcoming the aggregation-induced emission (ACQ) effect. The performances of fluorescent probes are generally improved through structural regulation, and the proposed strategies of structural regulation are as follows: (a) the accuracy can be improved by introducing two fluorophores to form the ratiometric mode;21–23 (b) the sensitivity can be improved by using the fluorophores with high quantum yields;24–26 (c) the selectivity can be improved by using the receptors with high specificity;27 (d) the recyclability can be improved by using separable fluorescent materials as the fluorophores;28–30 (e) the ACQ effect can be overcome by using the fluorophores featured with aggregation-induced emission.31
Metal–organic frameworks (MOFs), a class of crystalline materials composed of metal ions/clusters as nodes and organic ligands as struts, have gained significant attention in the last decade. On one hand, MOFs are equipped with the structural features of high porosity, regular channels and diverse interactions,32–34 and on the other hand, they are characterized with multifarious properties such as fluorescence, conduction, magnetism and catalysis.35–38 The structural features and multifarious properties endow MOFs with broad application prospects in adsorption separation, heterogeneous catalysis, drug delivery and chemical sensing.39–42 In other perspective, the structural features of MOFs make them a class of superior host materials, and thereby, guests can be introduced to regulate the multifarious properties as well as the practical applicability of MOFs.43–46
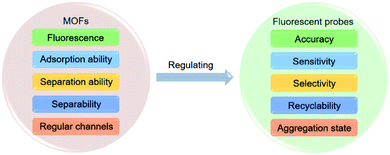
The properties of guests can also be changed after being integrated into MOFs,43–46 and on this basis, MOFs have been applied to the regulation of fluorescent probes.47–71 MOFs exhibit the superiorities of simple operation and high efficiency compared with structural regulation, because the integration of fluorescent probes into MOFs is facile to operate,47–71 which can improve the multiple performances of fluorescent probes simultaneously.57,69,70 The properties of MOFs will be compromised if fluorescent probes are integrated into MOFs, thus achieving the regulation of fluorescent probes. To be specific as shown in Fig. 1, (a) the fluorescence of MOFs can serve as the second signal of ratiometric mode to improve the accuracy;47–57 (b) the adsorption ability of MOFs can concentrate analytes near fluorescent probes to improve the sensitivity;57–65 (c) the separation ability of MOFs can make interferents filtered out to improve the selectivity;66,67 (d) the separability of MOFs can make fluorescent probes separable to improve the recyclability;68–70 (e) the regular channels of MOFs can make fluorescent probes isolated to overcome the ACQ effect.69–71
Given the above, MOFs possess a great application potential in the regulation of fluorescent probes because of their abundant host–guest chemistry. This review surveyed the research works on integrating fluorescent probes into MOFs for improved performances to provide a reference for the researchers interested in this filed. It began with the introduction of the methods for integrating fluorescent probes into MOFs. The regulation effects of MOFs on fluorescent probes were emphatically summarized in subsequent. In addition, the superiorities of MOFs in regulating fluorescent probes and the outlook of this subject were systematically discussed at the end.
2. Methods of integrating fluorescent probes into MOFs
Rare earth ion, small molecule and quantum dot (QD)-based fluorescent probes are generally integrated into MOFs.47–71 Among various methods, in situ embedding49–63,65,66,68,71 and adsorption47,53,54,64,67,69,70 are relatively facile to operate and have little influence on the structures of guests, so fluorescent probes are commonly integrated into MOFs via the two methods to ensure their performances as summarized in Table 1. The detailed discussion of the two methods is presented as below in terms of operation process, application scope and characteristics. The characterization methods for the composites of fluorescent probes and MOFs are also summarized.| Fluorescent probe@MOF | Regulation effect | Method of integration | Reference |
|---|---|---|---|
| PB@UiO-66-NH2 | Accuracy | Adsorption | 47 |
| AuNCs/Cys@MIL-68(In)-NH2 | Accuracy | Covalent linkage | 48 |
| CDs@Eu-MOF | Accuracy | In situ embedding | 49 |
| CDs@Eu-MOF | Accuracy | In situ embedding | 50 |
| CDs@Eu-MOF | Accuracy | In situ embedding | 51 |
| CsPbBr3 QDs@Eu-MOF | Accuracy | In situ embedding | 52 |
| CDs/Tb3+@In-MOF | Accuracy | Combining two methods | 53 |
| CDs/Eu3+@MOF-253 | Accuracy | Combining two methods | 54 |
| QDs/CDs@ZIF-8 | Accuracy | In situ embedding | 55 |
| AuNCs/CDs@ZIF-8 | Accuracy | In situ embedding | 56 |
| BYCDs@ZIF-8 | Accuracy/sensitivity | In situ embedding | 57 |
| CDs@ZIF-8 | Sensitivity | In situ embedding | 58 |
| RhB-CDs@ZIF-8 | Sensitivity | In situ embedding | 59 |
| CDs@ZIF-8 | Sensitivity | In situ embedding | 60 |
| AgNCs@ZIF-8 | Sensitivity | In situ embedding | 61 |
| CdTe QDs@ZIF-8 | Sensitivity | In situ embedding | 62 |
| ZnS QDs@ZIF-67 | Sensitivity | In situ embedding | 63 |
| HBDD@ZIF-8 | Sensitivity | Adsorption | 64 |
| CuNCs@ZIF-8 | Sensitivity | In situ embedding | 65 |
| CdTe QDs@ZIF-8 | Selectivity | In situ embedding | 66 |
| CDs@UiO-66 | Selectivity | Adsorption | 67 |
| 1-Aminopyrene@ZIF-8 | Recyclability | In situ embedding | 68 |
| RhB@Bio-MOF-1 | Recyclability/aggregation state | Adsorption | 69 |
| Fluorescein@Cd-MOF | Recyclability/aggregation state | Adsorption | 70 |
| Mn2+:ZnS QDs@ZIF-8 | Aggregation state | In situ embedding | 71 |
2.1 In situ embedding
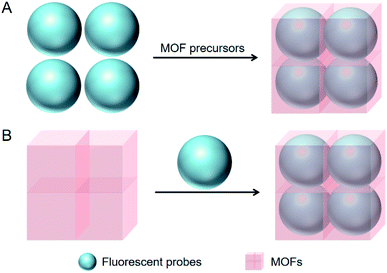
In situ embedding as the most commonly used method refers to the in situ constructions of MOFs around the dispersed fluorescent probes as shown in Fig. 2A. It has been applied to the integration of small molecule and QD-based fluorescent probes into MOFs, such as 1-aminopyrene,68 CsPbBr3 QDs,52 CdTe QDs,62,66 ZnS QDs,63 Mn2+:ZnS QDs,71 CdTe/CdS/ZnS QDs,55 Au nanoclusters (AuNCs),56 AgNCs,61 CuNCs,65 and various carbon dots (CDs).49–51,53–57In situ embedding is characterized with facile operation because the syntheses of MOFs are carried out simultaneously with the integration of fluorescent probes. For instance, 1-aminopyrene was integrated into ZIF-8 through in situ embedding, which was completed just by the addition of 1-aminopyrene to the mixed solution of Zn2+ and 2-methylimidazole (Fig. 3).68 From another perspective, the high stability of fluorescent probes is generally required for in situ embedding since MOFs are commonly synthesized under the harsh conditions of long time heating. For example, the CDs prepared from Co2+, tartaric acid and triethylenetetramine were integrated into an Eu-MOF through in situ embedding, which had to be carried out at a high temperature of 100 °C for a long time of 24 h.49 Besides, fluorescent probes are mainly located inside the framework structures of MOFs for this method, and thus in situ embedding is characterized with high stability and fluorescent probes are not easy to be released.72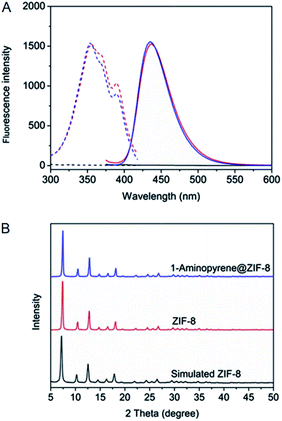 | ||
| Fig. 3 (A) Excitation (dash line) and emission spectra (solid line) of ZIF-8 (black line), 1-aminopyrene@ZIF-8 (red line) and 1-aminopyrene (blue line). (B) PXRD patterns of simulated ZIF-8, ZIF-8 and 1-aminopyrene@ZIF-8. Reproduced from ref. 68 with the permission from Elsevier. | ||
2.2 Adsorption
Adsorption refers to the adsorption of fluorescent probes into the regular channels of MOFs as show in Fig. 2B, which is mainly driven by hydrogen bond, π–π stacking, electrostatic interaction and coordination interaction. It has been applied to the integration of rare earth ion, small molecule and QD-based fluorescent probes into MOFs, such as Tb3+,53 Eu3+,54 phloxine B (PB),47 rhodamine B (RhB),69 fluorescein,70 4,4′-(hydrazine-1,2-diylidenebis(methanylylidene)) bis(3-hydroxybenzoic acid) (HDBB),64 and CDs.67 Organic ligands exhibit some flexibility and coordination bonds are deformable, which results in the flexible skeletons of MOFs.73–75 Thereby, fluorescent probes slightly larger than the channels of MOFs can also be integrated through adsorption. For instance, the size of HDBB (1.56 × 0.45 nm) was larger than the window size of ZIF-8 (0.34 nm), and nevertheless, ZIF-8 was still integrated with HDBB through adsorption ascribed to its flexible skeleton (Fig. 4).64 Adsorption is also characterized with facile operation since it is generally carried out under mild conditions. For instance, PB was integrated into UiO-66-NH2 through adsorption, which was completed just by dispersing UiO-66-NH2 powder in PB solution for 2 h at room temperature.47 From another perspective, adsorption is not so harsh for the stability of fluorescent probes due to the mild operating conditions. Additionally, fluorescent probes are mainly located on the surface of MOFs for adsorption, and this method is characterized with poor stability as a consequence.72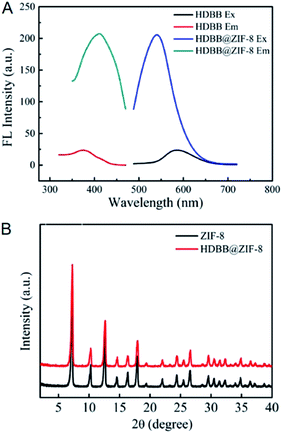 | ||
| Fig. 4 (A) Excitation and emission spectra of HBDD and HBDD@ZIF-8. (B) PXRD patterns of ZIF-8 and HBDD@ZIF-8. Reproduced from ref. 64 with the permission from Elsevier. | ||
2.3 Combing two methods
Sometimes multiple guests are simultaneously integrated into MOFs, for instance, a fluorescent probe is integrated into a MOF together with a reference fluorophore or another fluorescent probe to form the ratiometric mode.53–57 In such situation, in situ embedding and adsorption may be employed in combination owing to the different properties of guests. For instance, the CDs prepared from citric acid and ethylenediamine were integrated into MOF-253 together with Eu3+ for the ratiometric detection of Hg2+, and in this case, the CDs and Eu3+ were respectively integrated through in situ embedding and adsorption (Fig. 5).54 In addition, the CDs prepared from p-phenylenediamine were integrated into an In-MOF together with Tb3+ for the ratiometric detection of water in organic solvents, in which case the CDs and Tb3+ were integrated via in situ embedding and adsorption, respectively.53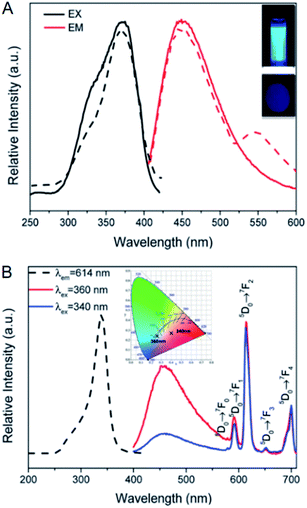 | ||
| Fig. 5 (A) Excitation and emission spectra of CDs@MOF-253 in the aqueous solution (solid line) and in the solid state (dash line). (B) Excitation (dash line) and emission (solid line) spectra of CDs/Eu3+@MOF-253. Reproduced from ref. 54 with the permission from Royal Society of Chemistry. | ||
Above all, in situ embedding and adsorption are the two most common methods used for integrating fluorescent probes into MOFs, and their operation processes are both very facile. Compared with in situ embedding, adsorption is carried out under milder conditions and is not so harsh for the stability of fluorescent probes. However, adsorption requires that fluorescent probes are not much larger than the channels of MOFs, while this is not necessary for in situ embedding. As for stability, in situ embedding is more superior compared with adsorption because fluorescent probes are located deeper into the framework structures of MOFs. Our group has done some research on integrating fluorescent guests into MOFs for chemical sensing recently.46,68 It is found that most fluorescent guests are left in solutions for the two methods, so how to improve the utilization of fluorescent guests is an issue needing to be overcome in future. Enhancing the interactions of MOFs with fluorescent guests through the modification of MOFs is an alternative strategy to overcome the above issue.
2.4 Characterization methods
The integration of fluorescent probes into MOFs can be confirmed by comparing the fluorescence spectra, FTIR spectra or specific surface areas of MOFs before and after the integration. If fluorescent probes and MOFs are integrated together, the characteristic emission bands of fluorescent probes will be observed in fluorescence spectra,47–71 and the characteristic absorption bands of fluorescent probes will appear in FTIR spectra,47,49–51,53,55,56,58,60,63,64,67,71 and there will be a certain level of decline in specific surface areas.47,50,51,53,54,58,63,64,67,70,71 TEM is also an available tool to confirm the integration for QD-based fluorescent probes, and the small spots of fluorescent probes may be observed if fluorescent probes are integrated into MOFs.48,52,57,62,63,65,66 In addition, there are two strategies for determining the loading amounts of fluorescent probes in MOFs. One is monitoring the residual amounts of fluorescent probes after the integration with MOFs,69,70 and the other is monitoring the released amounts of fluorescent probes after the decomposition of MOFs.64,68,71 Besides, the distribution of fluorescent probes in MOFs can be observed with confocal laser scanning microscope.64,70 Additionally, PXRD and TEM/SEM can be used to evaluate the crystalline structures and morphologies of the composites of fluorescent probes and MOFs, respectively.47–71 Moreover, the quantum yields of the composites and pristine fluorescent probes are sometimes determined to investigate the influence of MOFs on the emission of fluorescent probes.62,65,683. Regulation effects of MOFs on fluorescent probes
MOFs possess fluorescence, adsorption ability, separation ability, separability and regular channels. These properties will be compromised if fluorescent probes are integrated into MOFs, and the regulation effects of MOFs on fluorescent probes are realized on this basis, which haven been summarized in Table 1: (a) accuracy regulation,47–57 (b) sensitivity regulation,57–65 (c) selectivity regulation,66,67 (d) recyclability regulation,68–70 and (e) aggregation state regulation.69–71 The discussion of each regulation effect is presented as below in terms of mechanism and research works.3.1 Accuracy regulation
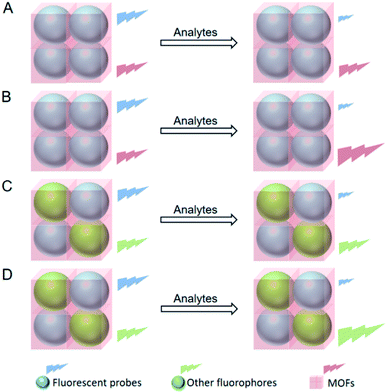
Traditional fluorescent probes, only possessing one emission band, determine the concentrations of analytes according to the change of fluorescence intensity at a single wavelength.76–78 Nevertheless, the accuracy of their detection results is easily influenced by external parameters such as environment and instrumentation. Ratiometric fluorescent probes with two emission bands are therewith developed in order to overcome the above issue, which measure the fluorescence intensities at two different wavelengths and use the ratio as the characteristic parameter to detect the analytes.79–81 MOFs commonly possess fluorescence that can be originated from metal ions,82 organic ligands83,84 or guests,85 which makes them available to regulate the accuracy of fluorescent probes. That is to say, the fluorescence of MOFs can serve as the second signal of ratiometric mode when fluorescent probes and MOFs are integrated together, thus improving the accuracy of fluorescent probes.47–57There have been four strategies proposed to endow fluorescent probes with ratiometric mode via MOFs. The first strategy is integrating a fluorescent probe into a fluorescent MOF that serves as the reference fluorophore. The fluorescence intensity of the fluorescent probe is changed while the MOF displays the original fluorescence intensity after adding the analyte (Fig. 6A).47–49 The second strategy is integrating a fluorescent probe into a fluorescent MOF which also responds to the analyte. The fluorescence intensity of the fluorescent probe is changed while the MOF displays an opposite change in fluorescence intensity after adding the analyte (Fig. 6B).50–52 The third strategy is integrating a fluorescent probe and a reference fluorophore into a MOF. The fluorescent intensity of the fluorescent probe is changed while the reference fluorophore displays the original fluorescence intensity after adding the analyte (Fig. 6C).53–56 The fourth strategy is integrating two fluorescent probes which are targeted at the same analyte into a MOF. The fluorescence intensities of the two fluorescent probes are all changed while their changing trends are opposite after adding the analyte (Fig. 6D).57
For the examples of the first strategy (Fig. 6A), the yellow-emitting PB was integrated into the blue-emitting UiO-66-NH2 for the ratiometric detection of cetyltrimethyl ammonium bromide (CTAB).47 In the presence of CTAB, the fluorescence of PB was quenched owing to the electronic interaction between CTAB and PB, while UiO-66-NH2 acting as the reference fluorophore displayed the original fluorescence intensity (Fig. 7). Based on this, CTAB was quantified in the concentration range from 0.1 to 17 μM with a detection limit of 0.074 μM. Furthermore, CTAB in water samples collected from tap and river was detected with spiked recoveries ranging from 94 to 114%.
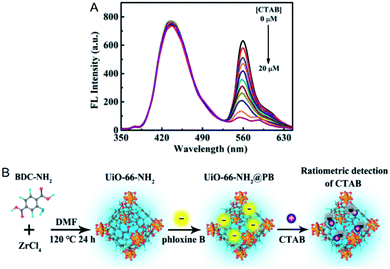 | ||
| Fig. 7 (A) Fluorescence signal changes of PB@UiO-66-NH2 after the addition of CTAB. (B) Mechanism for the ratiometric detection of CTAB with PB@UiO-66-NH2. Reproduced from ref. 47 with the permission from American Chemical Society. | ||
Besides, the red-emitting AuNCs capped with glutathione (GSH) was integrated into the blue-emitting MIL-68(In)-NH2 followed by L-cysteine (Cys) modification for the ratiometric detection of Hg2+.48 The fluorescence intensity of AuNCs/Cys was decreased after the addition of Hg2+, while MIL-68(In)-NH2 acting as the reference fluorophore was not influenced by Hg2+. Based on the fluorescence intensity ratio, Hg2+ was quantified in the concentration range from 20 pM to 60 μM with a detection limit of 6.7 pM. Furthermore, Hg2+ in water samples collected from tap and lake was detected with spiked recoveries ranging from 96.4 to 110.2%. Radial star-shaped test strips were further fabricated, and the fluorescence color turned from red to blue when Hg2+ was added.
Additionally, the blue-emitting CDs prepared from Co2+, tartaric acid and triethylenetetramine were integrated into the red-emitting Eu-MOF for the ratiometric detection of Cr2O72−.49 In the presence of Cr2O72−, the fluorescence of CDs was quenched owing to the inner filter effect (IFE), while Eu-MOF as the reference fluorophore displayed the original fluorescence intensity. Based on the fluorescence intensity ratio, Cr2O72− was quantified in the concentration range from 2 to 100 μM, and the limit of detection was calculated to be 0.21 μM. Furthermore, Cr2O72− in water samples collected from tap, river and steam was detected with spiked recoveries in the range of 91.90–110.62%.
For the examples of the second strategy (Fig. 6B), the blue-emitting CDs prepared from citric acid and ethylene diamine were integrated into the red-emitting Eu-MOF for the ratiometric detection of doxycycline.50 In the presence of doxycycline, the fluorescence of CDs was quenched owing to the overlap between the absorption band of doxycycline and the emission band of CDs, while Eu-MOF displayed increased fluorescence intensity attributed to the formation of Eu–doxycycline complex (Fig. 8A). Doxycycline was quantified in the concentration range from 0 to 60 μM with the limit of detection of 0.36 μM based on the fluorescence intensity ratio. Furthermore, the concentration of doxycycline in a simulated biological system was measured, and the spiked recoveries were obtained ranging from 93.95 to 102.28%. Moreover, test strips were fabricated for the convenience of use, and the fluorescence color changed from blue to red after adding doxycycline (Fig. 8B).
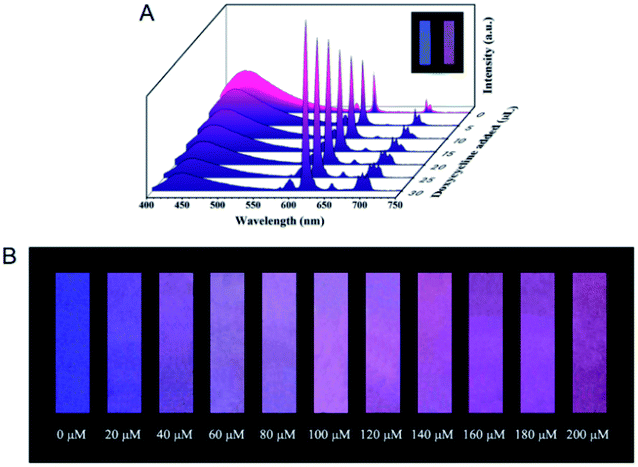 | ||
| Fig. 8 (A) Fluorescence signal changes of CDs@Eu-MOF after the addition of doxycycline. (B) Fluorescence color change of the test strip after the addition of doxycycline. Reproduced from ref. 50 with the permission from Royal Society of Chemistry. | ||
Besides, the blue-emitting CDs prepared from citric acid and Cys were integrated into the red-emitting Eu-MOF for the ratiometric detection of water in organic solvents.51 As the water content in organic solvents increased, CDs changed from the aggregated state to the dispersed state accompanied by fluorescence enhancement, while Eu-MOF displayed fluorescence quenching owing to the effect of O–H oscillators. The water content in ethanol was quantified in the range from 0.05 to 4% with a detection limit of 0.03% based on the fluorescence intensity ratio. The water contents in other organic solvents such as N,N-dimethylformamide and acetonitrile could also be determined.
Additionally, the green-emitting CsPbBr3 QDs were integrated into the red-emitting Eu-MOF for the ratiometric detection of temperature.52 As temperature increased from 20 to 100 °C, the fluorescence of CsPbBr3 QDs was quenched while Eu-MOF displayed increased fluorescence intensity. The relationship between the fluorescence intensity ratio and the temperature could be described by the equation of IMOF/IQD = −0.536 + 1.422 × e0.031T. In addition, the fluorescence intensity ratio could display a reversible transformation with the change of temperature.
For the examples of the third strategy (Fig. 6C), the red-emitting CDs prepared from p-phenylenediamine were integrated into an In-MOF together with the green-emitting Tb3+ for the ratiometric detection of water in organic solvents.53 As the water content in organic solvents increased, CDs turned from the aggregation state to the dispersion state along with fluorescence enhancement, while Tb3+ acting as the reference fluorophore displayed the original fluorescence intensity (Fig. 9A and B). Based on this, the water contents in ethanol, N,N-dimethylformamide and cyclopropane were quantified in the ranges of 0–30%, 0–30% and 0–40% with detection limits of 0.28%, 0.33% and 0.25%, respectively. Test strips were further fabricated for the detection of humidity, and the fluorescence color changed from red to green when humidity increased (Fig. 9C).
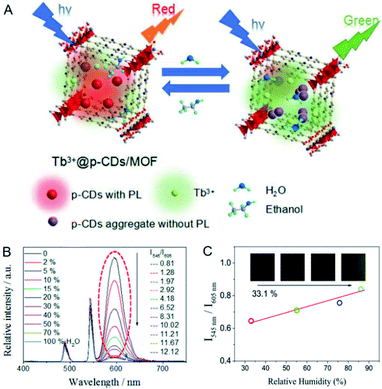 | ||
| Fig. 9 (A) Mechanism for the ratiometric detection of water in organic solvents with CDs/Tb3+@In-MOF. (B) Fluorescence signal changes of CDs/Tb3+@In-MOF with increasing the water content in ethanol. (C) Fluorescence signal changes of the test strip with the increase of humidity. Reproduced from ref. 53 with the permission from Royal Society of Chemistry. | ||
Besides, the blue-emitting CDs prepared from citric acid and ethylenediamine were integrated into MOF-253 together with the red-emitting Eu3+ for the ratiometric fluorescent detection of Hg2+.54 In the presence of Hg2+, the fluorescence of CDs was quenched owing to the coordination between Hg2+ and the functional groups of CDs, while Eu3+ serving as the reference fluorophore displayed the original fluorescence intensity. Hg2+ was quantified in the concentration range from 0.065 to 150 μM based on the fluorescence intensity ratio, and the limit of detection for Hg2+ was calculated to be 13 ppb. Furthermore, Hg2+ in water samples collected from tap, river and fountain was measured, and the spiked recoveries were determined ranging from 96.2 to 102.6%.
Additionally, the red-emitting CdTe/CdS/ZnS QDs were integrated into ZIF-8 together with the blue-emitting CDs prepared from citric acid and diethylene triamine for the ratiometric detection of Cu2+.55 In the presence of Cu2+, the Cd2+ in CdTe/CdS/ZnS QDs was replaced to generate the low soluble CuTe, which resulted in fluorescence quenching, whereas CDs serving as the reference fluorophore displayed the original fluorescence intensity. Based on this, Cu2+ was quantified in the concentration range from 5 to 100 nM with a detection limit of 1.53 nM. Furthermore, Cu2+ in tap water was determined with spiked recoveries ranging from 94.4 to 105.0%.
In addition, the red-emitting AuNCs capped by GSH were integrated into ZIF-8 together with the blue-emitting CDs prepared from sodium citrate and tripolycyanamide for the ratiometric detection of Cu2+.56 The fluorescence of the AuNCs was quenched in the presence of Cu2+ owing to the coordination between Cu2+ and GSH, and nevertheless, Cu2+ had little influence on the fluorescence intensity of the CDs which acted as the reference fluorophore. Cu2+ was quantified in the concentration range from 0.001 to 1000 μM based on the fluorescence intensity ratio, and moreover, the limit of detection for Cu2+ was calculated to be 0.3324 nM. Furthermore, the concentration of Cu2+ in serum samples was determined, and the spiked recoveries were obtained ranging from 95.6 to 104.5%.
For the examples of the fourth strategy (Fig. 6D), the yellow-emitting CDs (YCDs) prepared from o-phenylenediamine were integrated into ZIF-8 together with the blue-emitting CDs (BCDs) prepared from urea and citric acid for the ratiometric detection of GSH.57 The fluorescence of the YCDs was enhanced in the presence of Cu2+ ascribed to the coordination of Cu2+ with o-phenylenediamine residues, while the BCDs displayed fluorescence quenching after the addition of Cu2+ as their emission band was overlapped by the absorption band of Cu2+-o-phenylenediamine complex. When GSH was added further, the fluorescence changes as described above were inhibited ascribed to the strong coordination of GSH with Cu2+ (Fig. 10A). GSH was quantified in the concentration range of 3–25 nM with a detection limit of 0.9 nM on this basis. Furthermore, GSH in fruit samples collected from grape and cucumber was detected with spiked recoveries ranging from 97.2 to 106.3%.
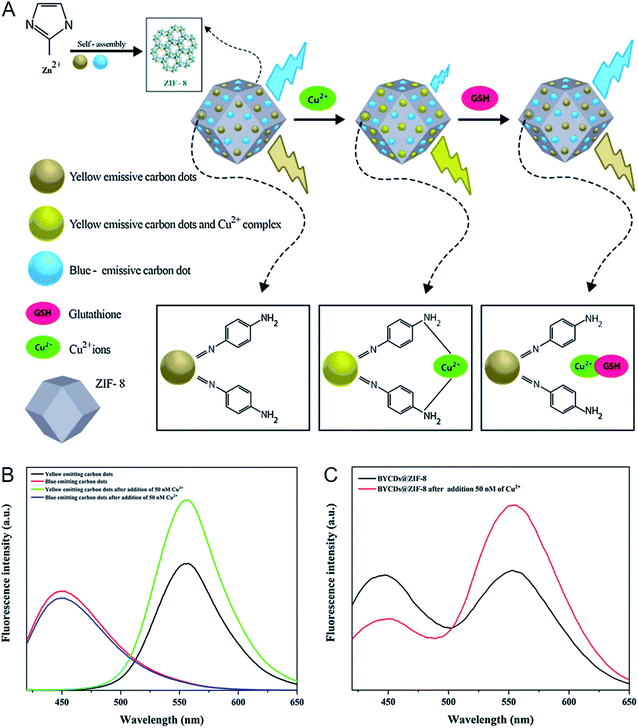 | ||
| Fig. 10 (A) Mechanism for the ratiometric detection of GSH with BYCDs@ZIF-8. (B) Fluorescence signal changes of BCDs and YCDs after the addition of Cu2+. (C) Fluorescence signal changes of BYCDs@ZIF-8 after the addition of Cu2+. Reproduced from ref. 57 with the permission from Elsevier. | ||
3.2 Sensitivity regulation
MOFs possess the structural characteristics of high porosity, regular channels and diverse interactions, and consequently they have a broad application prospect in the field of adsorption.86–88 The adsorption ability of MOFs makes them available for the sensitivity regulation of fluorescent probes.57–65 To be specific, the analytes can be concentrated by MOFs to the vicinity of fluorescent probes when fluorescent probes and MOFs are integrated together, so as to improve the sensitivity of fluorescent probes. ZIF-8, composed of Zn2+ and 2-methylimidazole, is the most commonly used MOF to regulate the sensitivity of fluorescent probes attributed to its facile preparation and excellent stability besides superior adsorption ability.89–93 Fluorescent probes based on various CDs, HBDD and CuNCs have been integrated into ZIF-8 to realize the improvement of sensitivity.57–64The CDs prepared from N-(β-aminoethyl)-γ-aminopropyl methyldimethoxysilane were integrated into ZIF-8 for the sensitive detection of quercetin.58 The fluorescence of the CDs was quenched after the addition of quercetin owing to the overlap between the excitation band of the CDs and the absorption band of quercetin. It was found that the CDs displayed improved quenching efficiency after integrated into ZIF-8 under the same condition, which could be explained by the adsorption of quercetin by ZIF-8 according to the adsorption experiment (Fig. 11). As a result, quercetin was quantified in the concentration range of 0.01–50.0 μM with a detection limit as low as 3.5 nM. Furthermore, the concentration of quercetin in red wine was determined, and the result (8.44 ± 0.062 μM) was consistent with that from HPLC-UV method (8.41 ± 0.054 μM).
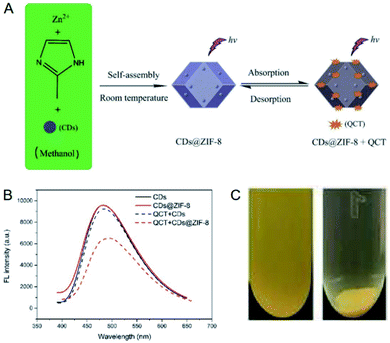 | ||
| Fig. 11 (A) Mechanism for the sensitive detection of quercetin with CDs@ZIF-8. (B) Comparison of the responses of CDs and CDs@ZIF-8 toward quercetin. (C) Paragraphs of CDs@ZIF-8 suspended in quercetin solution before (left) and after (right) centrifugation. Reproduced from ref. 58 with the permission from Royal Society of Chemistry. | ||
RhB modified CDs were integrated into ZIF-8 for the ratiometric detection of HClO.59 RhB was oxidized after the addition of HClO accompanied by fluorescence quenching, while HClO exhibited little effect on the fluorescence intensity of CDs serving as the reference fluorophore. Noteworthily, RhB displayed higher quenching efficiency after integrated into ZIF-8 under the same condition, and the authors attributed this phenomenon to the adsorption ability of ZIF-8 toward HClO. As a consequence, HClO was quantified in the concentration range from 15 to 180 μM, and moreover, the limit of detection for HClO was calculated as low as 6.7 μM. In addition, HClO in the commercial disinfectant was detected with spiked recoveries ranging from 95.4 to 106.0%.
The CDs prepared from citric acid and poly(ethylenimine) were integrated into ZIF-8 for the sensitive detection of Cu2+.60 The fluorescence of the CDs was quenched after the addition of Cu2+ owing to the interaction of Cu2+ with poly(ethylenimine). It was found that the CDs displayed higher quenching efficiency after integrated into ZIF-8 under the same condition, and the adsorption experiment confirmed that this phenomenon was owing to the adsorption of Cu2+ by ZIF-8. As a consequence, Cu2+ was quantified in the concentration range from 2 to 1000 nM, and the detection limit for Cu2+ was calculated as low as 80 pM. Furthermore, the concentration of Cu2+ in river water was determined, and the result (2.201 ± 0.084 μM) was consistent with that obtained from ICP-MS method (2.164 ± 0.052 μM). In subsequent, fluorescent probes based on other CDs, AgNCs and CdTe QDs were integrated into ZIF-8 to achieve the sensitive detection of Cu2+.57,61,62
ZIF-67, consisted of Co2+ and 2-methylimidazole, belongs to the same family of MOFs as ZIF-8, and possesses the adsorption ability toward Cu2+ as well.94 The ZnS QDs capped with polyethylene glycol were integrated into ZIF-67 for the sensitive detection of Cu2+.63 The fluorescence of ZnS QDs was quenched after the addition of Cu2+ attributed to the interaction between Cu2+ and polyethylene glycol. The quenching efficiency of ZnS QDs was increased after integrated into ZIF-8 under the same condition, and this phenomenon was caused by the adsorption of Cu2+ by ZIF-67 according to the adsorption experiment. As a consequence, Cu2+ was quantified in the concentration range from 3 to 500 nM with a detection limit as low as 0.96 nM. Furthermore, the concentration of Cu2+ in tap water was determined and the spiked recoveries were ranging from 99.5 to 102.0%.
HDBB was integrated into ZIF-8 with a loading amount of 0.8 wt% for the sensitive detection of ethanol in water.64 The fluorescence intensity of HBDD was enhanced slowly with increasing the ethanol content in water, which could be explained by the solvent effect. Nevertheless, HBDD displayed drastic fluorescence enhancement after integrated into ZIF-8 under the same condition, and this phenomenon was ascribed to the adsorption of ethanol by ZIF-8 as demonstrated in literature.95 As a consequence, the ethanol content in water could be quantified in the range from 10 to 90% with a detection limit as low as 2.16%. In addition, the fluorescence was reversibly switched between the weak and strong status with the change of the ethanol content in water.
The CuNCs capped with polyethyleneimine were integrated into ZIF-8 for the sensitive detection of H2O2.65 The quantum yields of CuNCs increased from 0.12 to 1.8% after the integration with ZIF-8, which was due to the formation of aggregates. The fluorescence of CuNCs was quenched in the presence of H2O2 owing to the H2O2-induced oxidation of Cu to Cu2+. The result showed that CuNCs exhibited higher quenching efficiency after integrated into ZIF-8 under the same condition, and the authors attributed this phenomenon to the adsorption ability of ZIF-8 toward H2O2. On this basis, H2O2 was quantified in the concentration range from 0.01 to 1.5 μM with a detection limit as low as 10 nM. Furthermore, the activity of glucose oxidase was measured through the detection of H2O2.
3.3 Selectivity regulation
As mentioned above, the structural characteristics of MOFs make them possess superior adsorption ability.86–88 Based on this, the analytes can be concentrated by MOFs to the vicinity of fluorescent probes when fluorescent probes and MOFs are integrated together, so as to improve the sensitivity of fluorescent probes.57–65 Generally speaking, substances display discrepant adsorption on MOFs because of their different functional groups, molecule sizes or chiral structures, and therefore MOFs possess the ability to separate different substances.96–98 In other perspective, the separation ability of MOFs makes them available to regulate the selectivity of fluorescent probes.66,67 That is to say, the interferents can be filtered out by MOFs when fluorescent probes and MOFs are integrated together, thus improving the selectivity of fluorescent probes. Fluorescent probes based on CdTe QDs and CDs have been integrated into MOFs to achieve the improvement of their selectivity.66,67CdTe QDs were integrated into ZIF-8 for the selective measurement of oxidase activities based on H2O2 detection (Fig. 12A).66 CdTe QDs could be applied to detecting H2O2 based on the oxidation-induced fluorescence quenching, while oxidases and substates also exhibited effects on the fluorescence intensity of CdTe QDs (Fig. 12B). Smaller H2O2 could readily enter the cage windows of ZIF-8, while oxidases and substates with large sizes would be obstructed. As a result, only H2O2 permeated ZIF-8 to induce the fluorescence quenching of CdTe QDs and the interferences from oxidases and substates were eliminated when CdTe QDs and ZIF-8 were integrated together (Fig. 12C). Based on this, the activities of GOx and urate oxidases (UOx) were selectively measured in the ranges of 1–100 and 0.1–50 U L−1 with detection limits of 0.26 and 0.024 U L−1, respectively.
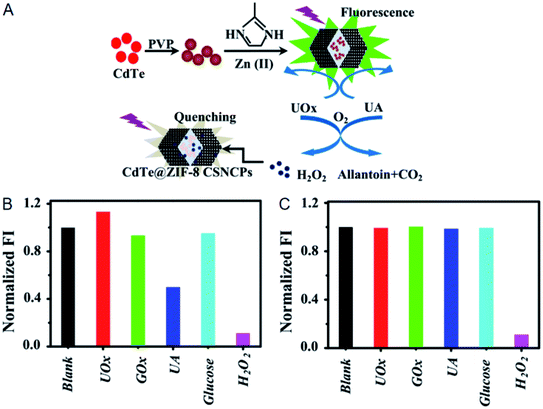 | ||
| Fig. 12 (A) Mechanism for the selective measurement of oxidase activities with CdTe QDs@ZIF-8. (B) Fluorescence intensities of CdTe QDs in the presence of different substances. (C) Fluorescence intensities of CdTe QDs@ZIF-8 in the presence of different substances. Reproduced from ref. 66 with the permission from Elsevier. | ||
The CDs prepared from citric acid and ethylenediamine were integrated into UiO-66 for the selective detection of 4-nitrophenol.67 The CDs could be applied to detecting 4-nitrophenol based on fluorescence quenching, whereas they suffered from the interferences from 2,4-dinitrophenol and 2,4,6-trinitrophenol. UiO-66 possessed much higher adsorption capacity toward 4-nitrophenol (17.3 mg g−1) compared with 2,4-dinitrophenol (1.8 mg g−1) and 2,4,6-trinitrophenol (1.3 mg g−1) according to the adsorption experiment. As a consequence, only 4-nitrophenol permeated UiO-66 to induce the fluorescence quenching of the CDs and the interferences from 2,4-dinitrophenol and 2,4,6-trinitrophenol were diminished when the CDs and UiO-66 were integrated together. On this basis, 4-nitrophenol was selectively detected in the concentration range from 0.01 to 20.0 μM, and moreover, the limit of detection for 4-nitrophenol was calculated to be 3.5 nM.
3.4 Recyclability regulation
The recycle of fluorescent probes is helpful to reduce the cost in practical applications. One of the important factors for recycling fluorescent probes is separability. Apparently, MOF-based fluorescent probes satisfy this requirement and commonly possess excellent recyclability, and our groups have developed a series of recyclable fluorescent probes based on MOFs.99–101 By contrast, the recyclability of other fluorescent probes such as the ones based on small molecules and QDs is generally poor, and one of the important reasons is the difficulty to separate them from the detection systems.102–105 The separability of MOFs makes them available to regulate the recyclability of fluorescent probes.68–70 To be specific, fluorescent probes can follow MOFs to be separated from the detection systems when fluorescent probes and MOFs are integrated together, thus improving the recyclability of fluorescent probes. Fluorescent probes based on 1-aminopyrene, RhB and fluorescein have been integrated into MOFs to achieve the improvement of their recyclability.68–70For instance, our group integrated 1-aminopyrene into ZIF-8 with a loading amount of 1.4 mg g−1 for the recyclable detection of picric acid (PA) more recently.68 There exhibits no obvious distinction between the quantum yields of 1-aminopyrene before (10.7%) and after (11.1%) the integration with ZIF-8. The fluorescence of 1-aminopyrene was quenched in the presence of PA attributed to IFE, and the recyclable detection of PA was realized with the assistance of ZIF-8 (Fig. 13). In addition, PA was quantified in the concentration range from 1 to 150 μM, and the limit of detection for PA was calculated to be 0.3 μM. Furthermore, PA in water samples collected from lake and sea was measured, and the spiked recoveries were determined ranging from 96.0 to 104.0%.
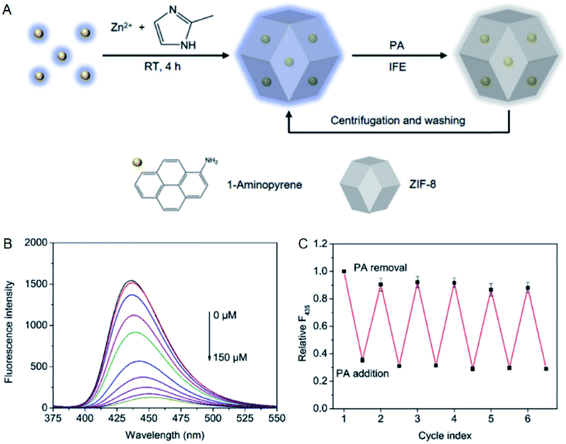 | ||
| Fig. 13 (A) Mechanism for the recyclable detection of PA with 1-aminopyrene@ZIF-8. (B) Fluorescence titration of 1-aminopyrene@ZIF-8 with PA. (C) Recycle test of 1-aminopyrene@ZIF-8 for the detection of PA. Reproduced from ref. 68 with the permission from Elsevier. | ||
3.5 Aggregation state regulation
Most fluorophores suffer from the ACQ effect and their fluorescence is quenched in the solid state, which is not conducive to develop detection devices such as test strips with relevant fluorescent probes. The regular channels of MOFs make them available to avoid the ACQ effect of fluorescent probes through aggregation state regulation.69–71 That is to say, fluorescent probes can be isolated in the regular channels of MOFs when fluorescent probes and MOFs are integrated together, thus regulating the aggregation state and avoiding the ACQ effect. Noteworthily, the loading amounts of fluorescent probes in MOFs have to be controlled in a certain range since high loading amounts may cause fluorescent probes to form aggregates.106 Fluorescent probes based on RhB, fluorescein and Mn2+:ZnS QDs have been integrated into MOFs to realize the aggregation state regulation.69–71For instance, Mn2+:ZnS QDs were integrated into ZIF-8 with a loading amount of 1.6 wt% to regulate the aggregation state.71 As expected, Mn2+:ZnS QDs displayed stronger fluorescence in the solid state after integrated into ZIF-8 ascribed to the regular channels (Fig. 14A). In addition, Co2+ and Cr2O72− were both detected in the concentration range from 0 to 100 μM based on fluorescence quenching (Fig. 14B and C). Moreover, the limits of detection for Co2+ and Cr2O72− were calculated to be 0.27 and 0.22 μM, respectively. Furthermore, Co2+ in human serum and Cr2O72− in tap water were detected with spiked recoveries in the ranges of 98.87–100.35% and 99.79–105.07%, respectively.
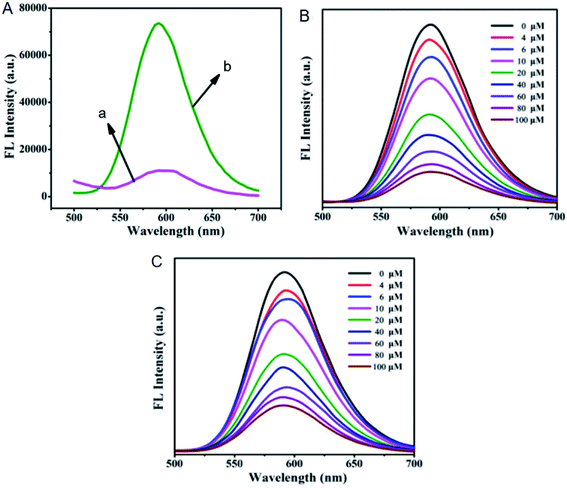 | ||
| Fig. 14 (A) Emission spectra of solid Mn2+:ZnS QDs (a) and solid Mn2+:ZnS QDs@ZIF-8 (b). (B) Fluorescence titration of Mn2+:ZnS QDs@ZIF-8 with Co2+. (C) Fluorescence titration of Mn2+:ZnS QDs@ZIF-8 with Cr2O72−. Reproduced from ref. 71 with the permission from Elsevier. | ||
4. Superiorities of MOFs in regulating fluorescent probes
The conventional strategy to improve the performances of fluorescent probes is structural regulation, in which the fluorophores or receptors are selected elaborately. Structure regulation usually improves one performance of fluorescent probes at the same time.21–31 By contrast, fluorescent probes are regulated with MOFs based on host–guest chemistry, which can improve the multiple performances of fluorescent probes simultaneously.57,69,70 Therefore, MOFs display the superiority of high efficiency compared with structural regulation. For instance,57 the ratiometric detection of Cu2+ was realized through the integration of YCDs and BCDs into ZIF-8 (Fig. 10A). Meanwhile, YCDs and BCDs displayed enhanced sensitivity toward Cu2+ due to the adsorption ability of ZIF-8 (Fig. 10B and C). Therefore, the accuracy and sensitivity were both improved in this work. In addition, the synthetic routes of fluorescent probes have to be reexplored in structural regulation,21–31 while the methods of integrating fluorescent probes into MOFs are commonly facile to operate.47,49–71 Hence, MOFs also exhibit the superiority of simple operation compared with structural regulation.5. Conclusions and outlook
In summary, this review summarized the research works on the regulation of fluorescent probes with MOFs. The regulation effects of MOFs on fluorescent probes including accuracy, selectivity, sensitivity, recyclability and aggregation state were highlighted. In addition, the methods of integrating fluorescent probes into MOFs and the superiorities of MOFs in regulating fluorescent probes were presented. Despite the progress achieved in this field, there are other regulation effects of MOFs on fluorescent probes needing to be explored: (a) the solvent effect of fluorescent probes can be avoid via the microenvironment of MOF channels, so as to keep detection performances stable in different solvents; (b) fluorescent probes targeted at different analytes can be integrated into one MOF, so as to realize the detection of multiple substances; (c) fluorescent probes can be integrated into MOFs together with other probes, so as to achieve the multi-mode detection of analytes. It is desirably hoped that this review can provide a useful reference for the researchers interested in this subject.Conflicts of interest
There are no conflicts to declare.Acknowledgements
Thank the support from Hainan Provincial Natural Science Foundation of China (219QN154, 2019RC005), National Natural Science Foundation of China (21761010), the Research Start-up Fund Projects of Hainan University (KYQD(ZR)1926, KYQD(ZR)1806), and the Opening Project of Key Laboratory of Polyoxometalate Science (Ministry of Education), Northeast Normal University.References
- B. H. Wang, X. Lian and B. Yan, Talanta, 2020, 214, 120856 CrossRef CAS PubMed.
- S. Kadian and G. Manik, Food Chem., 2020, 317, 126457 CrossRef CAS.
- L. J. Han, Y. J. Kong, G. Z. Hou, H. C. Chen, X. M. Zhang and H. G. Zheng, Inorg. Chem., 2020, 59, 7181–7187 CrossRef CAS PubMed.
- C. Ling, M. Cui, J. Chen, L. Xia, D. Deng, Y. Gu and P. Wang, Talanta, 2020, 215, 120934 CrossRef CAS PubMed.
- W. L. Jiang, W. X. Wang, J. Liu, Y. F. Li and C. Y. Li, Sens. Actuators, B, 2020, 313, 128054 CrossRef CAS.
- Z. J. Meng, L. Yang, C. X. Yao, H. Li, Y. Fu, K. X. Wang, Z. J. Qu and Z. H. Wang, Dyes Pigm., 2020, 176, 108208 CrossRef CAS.
- Q. Z. Yang, S. Z. Wang, D. Li, J. Y. Yuan, J. Xu and S. J. Shao, Anal. Chim. Acta, 2020, 1103, 202–211 CrossRef CAS PubMed.
- S. T. Cai, C. Liu, X. J. Jiao, L. C. Zhao and X. S. Zeng, J. Mater. Chem. B, 2020, 8, 2269–2274 RSC.
- J. J. Yang, M. T. Fan, Y. Sun, M. Y. Zhang, Y. T. Xue, D. Z. Zhang, T. Wang and X. Y. Cui, Sens. Actuators, B, 2020, 307, 127652 CrossRef.
- P. Lesani, G. Singh, C. M. Viray, Y. Ramaswamy, D. M. Zhu, P. Kingshott, Z. Lu and H. Zreiqat, ACS Appl. Mater. Interfaces, 2020, 12, 18395–18406 CrossRef CAS PubMed.
- P. C. Xing, D. Wu, J. S. Chen, J. M. Song, C. J. Mao, Y. H. Gao and H. L. Niu, Analyst, 2019, 144, 2656–2661 RSC.
- L. R. Liu, G. B. Zhu, W. Zeng, Y. H. Yi, B. H. Lv, J. J. Qian and D. P. Zhang, Microchim. Acta, 2019, 186, 98–106 CrossRef.
- W. X. Zhong, L. Z. Wang, S. M. Fang, D. W. Qin, J. H. Zhou, G. Yang and H. D. Duan, RSC Adv., 2020, 10, 3048–3059 RSC.
- Y. Cai, J. K. Fang, B. F. Wang, F. S. Zhang, G. Shao and Y. J. Liu, Sens. Actuators, B, 2019, 292, 156–163 CrossRef CAS.
- K. N. Zhu, T. Y. Z. Lv, T. Y. Qin, Y. Y. Huang, L. Wang and B. Liu, Chem. Commun., 2019, 55, 13983–13986 RSC.
- L. Tao, C. J. Song, C. Y. Huo, Y. J. Sun, C. M. Zhang, X. H. Li, S. J. Yu, M. Y. Sun, B. Q. Jin, Z. J. Zhang and K. Yang, Analyst, 2016, 141, 4933–4940 RSC.
- L. J. Feng, G. J. Ren, S. A. Ding, F. X. Wang, W. T. Yang, Z. Q. Liang and Q. H. Pan, Appl. Organomet. Chem., 2019, 33, e5044 CrossRef.
- D. X. Gu, W. T. Yang, F. X. Wang, M. L. Li, L. J. Liu, H. H. Li and Q. H. Pan, Appl. Organomet. Chem., 2019, 33, e5179 CrossRef CAS.
- L. Long, Y. Han, W. Liu, Q. Chen, D. Yin, L. Li, F. Yuan, Z. Han, A. Gong and K. Wang, Anal. Chem., 2020, 92, 6072–6080 CrossRef CAS.
- S. J. Li, P. P. Wang, W. Q. Feng, Y. H. Xiang, K. Dou and Z. H. Liu, Chem. Commun., 2020, 56, 1050–1053 RSC.
- Z. Y. Qu, T. Yu and L. H. Bi, Microchim. Acta, 2019, 186, 635 CrossRef.
- X. L. Wu, P. L. Wu, M. Y. Gu and J. Xue, Anal. Chim. Acta, 2020, 1104, 140–146 CrossRef CAS.
- S. H. Han, X. X. Yue, J. P. Wang, Y. Zhang, B. H. Wang and X. Z. Song, New J. Chem., 2020, 44, 4554–4557 RSC.
- Y. L. Qiao, C. Y. Liu and X. W. Zheng, Sens. Actuators, B, 2018, 259, 211–218 CrossRef CAS.
- X. F. Wu, X. H. Li, H. Y. Li, W. Shi and H. M. Ma, Chem. Commun., 2017, 53, 2443–2446 RSC.
- Y. B. Gan, G. X. Yin, T. Yu, Y. Y. Zhang, H. T. Li and P. Yin, Talanta, 2020, 210, 120612 CrossRef CAS.
- X. F. Wu, L. H. Li, W. Shi, Q. Y. Gong and H. M. Ma, Angew. Chem., Int. Ed., 2016, 55, 14728–14732 CrossRef CAS.
- S. J. Dong, J. S. Hu, X. L. Zhang and M. D. Zheng, Inorg. Chem. Commun., 2018, 97, 180–186 CrossRef CAS.
- M. Li, Z. H. Cui, S. R. Pang, L. K. Meng, D. X. Ma, Y. Li, Z. Shi and S. H. Feng, J. Mater. Chem. C, 2019, 7, 11919–11925 RSC.
- S. J. Dong, J. S. Hu, K. Wu and M. D. Zheng, Inorg. Chem. Commun., 2018, 95, 111–116 CrossRef CAS.
- Z. G. Song, R. T. K. Kwok, D. Ding, H. Nie, J. W. Y. Lam, B. Liu and B. Z. Tang, Chem. Commun., 2016, 52, 10076–10079 RSC.
- V. J. Pastore, T. R. Cook and J. Rzayev, Chem. Mater., 2018, 30, 8639–8649 CrossRef CAS.
- S. Y. Zhang, Z. D. Yang, K. Gong, B. Xu, H. Mei, H. B. Zhang, J. X. Zhang, Z. X. Kang, Y. G. Yan and D. F. Sun, Nanoscale, 2019, 11, 9598–9607 RSC.
- D. Sompornpailin, C. Ratanatawanate, C. Sattayanon, S. Namuangruk and P. Punyapalakul, Sci. Total Environ., 2020, 720, 137449 CrossRef CAS PubMed.
- Y. F. Zhao, M. Y. Wan, J. P. Bai, H. Zeng, W. G. Lu and D. Li, J. Mater. Chem. A, 2019, 7, 11127–11133 RSC.
- D. A. Levenson, J. F. Zhang, B. S. Gelfand, S. P. Kammampata, V. Thangadurai and G. K. H. Shimizu, Dalton Trans., 2020, 49, 4022–4029 RSC.
- Y. Zorlu, D. Erbahar, A. Cetinkaya, A. Bulut, T. S. Erkal, A. O. Yazaydin, J. Beckmann and G. Yucesan, Chem. Commun., 2019, 55, 3053–3056 RSC.
- J. N. Hall and P. Bollini, ACS Catal., 2020, 10, 3750–3763 CrossRef CAS.
- A. Ghosh and G. Das, Microporous Mesoporous Mater., 2020, 297, 110039 CrossRef CAS.
- P. Tshuma, B. C. E. Makhubela, L. Ohrstrom, S. A. Bourne, N. Chatterjee, I. N. Beas, J. Darkwa and G. Mehlana, RSC Adv., 2020, 10, 3593–3605 RSC.
- M. Pander, A. Zelichowska and W. Bury, Polyhedron, 2018, 156, 131–137 CrossRef CAS.
- X. F. Liu, X. Y. Zhang, R. F. Li, L. Y. Du, X. Feng and Y. Q. Ding, Dyes Pigm., 2020, 178, 108347 CrossRef CAS.
- Y. F. Liu, D. y. Lin, W. T. Yang, X. Y. An, A. H. Sun, X. L. Fan and Q. H. Pan, Microporous Mesoporous Mater., 2020, 303, 110304 CrossRef CAS.
- C. Y. Sun, W. P. To, F. F. Hung, X. L. Wang, Z. M. Su and C. M. Che, Chem. Sci., 2018, 9, 2357–2364 RSC.
- X. Ke, X. Q. Song, N. Q. Qin, Y. R. Cai and F. Ke, J. Porous Mater., 2019, 26, 813–818 CrossRef CAS.
- H. H. Li, F. X. Fu, W. T. Yang, L. Ding, J. X. Dong, Y. Yang, F. X. Wang and Q. H. Pan, Sens. Actuators, B, 2019, 301, 127110 CrossRef CAS.
- Z. Sun, Y. Ling, S. G. Liu, Y. Z. Yang, X. H. Wang, Y. Z. Fan, N. B. Li and H. Q. Luo, Inorg. Chem., 2019, 58, 8388–8395 CrossRef CAS PubMed.
- X. J. Wu, F. Kong, C. Q. Zhao and S. N. Ding, Analyst, 2019, 144, 2523–2530 RSC.
- Y. Y. Wang, J. He, M. D. Zheng, M. D. Qin and W. Wei, Talanta, 2019, 191, 519–525 CrossRef CAS PubMed.
- X. Fu, R. Lv, J. Su, H. Li, B. Y. Yang, W. Gu and X. Liu, RSC Adv., 2018, 8, 4766–4772 RSC.
- Y. Q. Dong, J. H. Cai, Q. Q. Fang, X. You and Y. W. Chi, Anal. Chem., 2016, 88, 1748–1752 CrossRef CAS.
- J. Q. Liu, Y. Y. Zhao, X. L. Li, J. B. Wu, Y. D. Han, X. Zhang and Y. Xu, Cryst. Growth Des., 2020, 20, 454–459 CrossRef CAS.
- J. X. Wu and B. Yan, Dalton Trans., 2017, 46, 7098–7105 RSC.
- X. Y. Xu and B. Yan, J. Mater. Chem. C, 2016, 4, 1543–1549 RSC.
- Y. J. Ma, G. H. Xu, F. D. Wei, Y. Cen, Y. S. Ma, Y. Y. Song, X. M. Xu, M. L. Shi, S. Muhammad and Q. Hu, J. Mater. Chem. C, 2017, 5, 8566–8571 RSC.
- Q. Q. Tan, R. R. Zhang, G. Y. Zhang, X. Y. Liu, F. L. Qu and L. M. Lu, Anal. Bioanal. Chem., 2020, 412, 1317–1324 CrossRef CAS PubMed.
- R. Jalili, A. Khataee, M. R. Rashidi and R. Luque, Sens. Actuators, B, 2019, 297, 126775 CrossRef CAS.
- L. H. Xu, G. Z. Fang, J. F. Liu, M. F. Pan, R. R. Wang and S. Wang, J. Mater. Chem. A, 2016, 4, 15880–15887 RSC.
- Y. J. Ma, G. H. Xu, F. D. Wei, Y. Cen, X. M. Xu, M. L. Shi, X. Cheng, Y. Y. Chai, M. Sohail and Q. Hu, ACS Appl. Mater. Interfaces, 2018, 10, 20801–20805 CrossRef CAS.
- X. M. Lin, G. M. Gao, L. Y. Zheng, Y. W. Chi and G. N. Chen, Anal. Chem., 2014, 86, 1223–1228 CrossRef CAS.
- C. Fan, X. X. Lv, F. J. Liu, L. P. Feng, M. Liu, Y. Y. Cai, H. Liu, J. Y. Wang, Y. L. Yang and H. Wang, ACS Sens., 2018, 3, 441–450 CrossRef CAS PubMed.
- A. Y. Zhang, C. Y. Fan, W. Sun, L. Chen, R. X. Shi, Y. Q. Cao and P. Yang, J. Nanosci. Nanotechnol., 2019, 19, 8088–8094 CrossRef CAS.
- F. Asadi, S. N. Azizi and M. J. Chaichi, Mater. Sci. Eng., C, 2019, 105, 110058 CrossRef CAS.
- S. X. Yang, S. H. Lu, Y. Cheng, Z. X. Lu, X. L. Liu, Y. Qin, R. D. Zhao, L. Y. Zheng and Q. E. Cao, Microporous Mesoporous Mater., 2020, 294, 109959 CrossRef CAS.
- X. Hu, X. D. Liu, X. D. Zhang, H. X. Chai and Y. M. Huang, Biosens. Bioelectron., 2018, 105, 65–70 CrossRef CAS PubMed.
- K. Wang, N. Li, J. Zhang, Z. Q. Zhang and F. Q. Dang, Biosens. Bioelectron., 2017, 87, 339–344 CrossRef CAS.
- J. M. Yang, X. W. Hu, Y. X. Liu and W. Zhang, Microporous Mesoporous Mater., 2019, 274, 149–154 CrossRef CAS.
- H. H. Li, B. Fu, W. T. Yang, L. Ding, Y. Yang, J. X. Dong, F. X. Wang and Q. H. Pan, Spectrochim. Acta, Part A, 2020, 226, 117575 CrossRef CAS.
- S. Let, P. Samanta, S. Dutta and S. K. Ghosh, Inorg. Chim. Acta, 2020, 500, 119205 CrossRef CAS.
- D. Tian, X. J. Liu, R. Feng, J. L. Xu, J. Xu, R. Y. Chen, L. Huang and X. H. Bu, ACS Appl. Mater. Interfaces, 2018, 10, 5618–5625 CrossRef CAS.
- X. Fu, H. Li, R. Lv, D. Hong, B. Y. Yang, W. Gu and X. Liu, J. Solid State Chem., 2018, 264, 35–41 CrossRef CAS.
- H. Q. Zheng, Y. N. Zhang, L. F. Liu, W. Wan, P. Guo, A. M. Nystrom and X. D. Zou, J. Am. Chem. Soc., 2016, 138, 962–968 CrossRef CAS.
- C. Gucuyener, J. van den Bergh, J. Gascon and F. Kapteijn, J. Am. Chem. Soc., 2010, 132, 17704–17706 CrossRef.
- J. V. Morabito, L. Y. Chou, Z. H. Li, C. M. Manna, C. A. Petroff, R. J. Kyada, J. M. Palomba, J. A. Byers and C. K. Tsung, J. Am. Chem. Soc., 2014, 136, 12540–12543 CrossRef CAS.
- S. A. Moggach, T. D. Bennett and A. K. Cheetham, Angew. Chem., Int. Ed., 2009, 48, 7087–7089 CrossRef CAS.
- M. L. Li, W. T. Yang, P. F. Qiu, G. J. Ren, C. Y. Li, Z. Y. Chen, Y. H. Wang and Q. H. Pan, J. Lumin., 2019, 205, 380–384 CrossRef CAS.
- C. Cui, Q. B. Wang, C. H. Xin, Q. Y. Liu, X. Deng, T. T. Liu, X. H. Xu and X. M. Zhang, Microporous Mesoporous Mater., 2020, 299, 110122 CrossRef CAS.
- L. L. Xu, M. X. Wu, L. H. Zhao, H. Han, S. Q. Zhang, P. Y. Ma, Y. Sun, X. H. Wang and D. Q. Song, Talanta, 2020, 215, 120892 CrossRef CAS.
- L. Yang, F. Wang, X. Z. Luo, X. J. Kong, Z. W. Sun and J. M. You, Talanta, 2020, 209, 120517 CrossRef CAS PubMed.
- X. J. He, W. Xiong, L. Zhang, C. C. Xu, J. Y. Fan, Y. N. Qian, J. S. Wen, F. Ding and J. L. Shen, Dyes Pigm., 2020, 174, 108059 CrossRef CAS.
- J. M. Wang, Z. D. Teng, T. Cao, J. Qian, L. Zheng, Y. P. Cao, W. W. Qin and H. C. Guo, Sens. Actuators, B, 2020, 306, 127567 CrossRef CAS.
- P. Ju, E. S. Zhang, L. Jiang, Z. Zhang, X. Y. Hou, Y. Q. Zhang, H. Yang and J. J. Wang, RSC Adv., 2018, 8, 21671–21678 RSC.
- F. M. Wang, L. Zhou, W. P. Lustig, Z. C. Hu, J. F. Li, B. X. Hu, L. Z. Chen and J. Li, Cryst. Growth Des., 2018, 18, 5166–5173 CrossRef CAS.
- Y. Y. Jiang, L. B. Sun, J. F. Du, Y. C. Liu, H. Z. Shi, Z. Q. Liang and J. Y. Li, Cryst. Growth Des., 2017, 17, 2090–2096 CrossRef CAS.
- M. L. Li, G. J. Ren, F. X. Wang, Z. M. Li, W. T. Yang, D. X. Gu, Y. H. Wang, G. S. Zhu and Q. H. Pan, Inorg. Chem. Front., 2019, 6, 1129–1134 RSC.
- Y. Zhao, L. Wang, N. N. Fan, M. L. Han, G. P. Yang and L. F. Ma, Cryst. Growth Des., 2018, 18, 7114–7121 CrossRef CAS.
- W. T. Yu, M. B. Luo, Y. X. Yang, H. Wu, W. Huang, K. Zeng and F. Luo, J. Solid State Chem., 2019, 269, 264–270 CrossRef CAS.
- S. M. Mirsoleimani-azizi, P. Setoodeh, S. Zeinali and M. R. Rahimpour, J. Environ. Chem. Eng., 2018, 6, 6118–6130 CrossRef CAS.
- D. N. Liu, C. J. Wang, Y. M. Xiao, C. Liu, D. Luo, Z. X. Zhu, S. Chen and Y. Y. Wang, Inorg. Chem. Commun., 2020, 114, 107773 CrossRef CAS.
- H. F. Zhang, M. Zhao and Y. S. Lin, Microporous Mesoporous Mater., 2019, 279, 201–210 CrossRef CAS.
- J. Li, Z. Wu, Q. Y. Duan, X. D. Li, Y. Li, H. Alsulami, M. S. Alhodaly, T. Hayat and Y. B. Sun, J. Hazard. Mater., 2020, 393, 122398 CrossRef CAS.
- Y. F. Li, X. L. Yan, X. Y. Hu, R. Feng, M. Zhou and D. Z. Han, J. Porous Mater., 2020, 27, 1109–1117 CrossRef CAS.
- Y. R. Son, S. G. Ryu and H. S. Kim, Microporous Mesoporous Mater., 2020, 293, 109819 CrossRef CAS.
- H. Yang, X. W. He, F. Wang, Y. Kang and J. Zhang, J. Mater. Chem., 2012, 22, 21849–21851 RSC.
- J. A. Gee, J. Chung, S. Nair and D. S. Sholl, J. Phys. Chem. C, 2013, 117, 3169–3176 CrossRef CAS.
- X. X. Gao, H. Y. Zhong, Y. Y. Zhang, Y. N. Yao, D. L. Chen and Y. B. He, Eur. J. Inorg. Chem., 2020, 1683–1689 CrossRef CAS.
- A. H. Assen, Y. Belmabkhout, K. Adil, P. M. Bhatt, D. X. Xue, H. Jiang and M. Eddaoudi, Angew. Chem., Int. Ed., 2015, 54, 14353–14358 CrossRef CAS.
- J. Wang, J. J. Chen and T. Y. Xu, Solid State Sci., 2019, 98, 106032 CrossRef CAS.
- G. J. Ren, Z. M. Li, M. L. Li, Z. Q. Liang, W. T. Yang, P. F. Qiu, Q. H. Pan and G. S. Zhu, Inorg. Chem. Commun., 2018, 91, 108–111 CrossRef CAS.
- D. X. Gu, W. T. Yang, G. H. Ning, F. X. Wang, S. X. Wu, X. D. Shi, Y. H. Wang and Q. H. Pan, Inorg. Chem., 2020, 59, 1778–1784 CrossRef CAS.
- X. D. Zhang, G. J. Ren, M. L. Li, W. T. Yang and Q. H. Pan, Cryst. Growth Des., 2019, 19, 6308–6314 CrossRef CAS.
- W. X. Chen, P. Xie, X. X. Shan, H. Q. Zhao, Y. Wu, H. W. Zhou and X. L. Jin, J. Mol. Struct., 2020, 1207, 127822 CrossRef CAS.
- S. Z. Liu, D. Yang, Y. J. Liu, H. Pan, H. B. Chen, X. Z. Qu and H. M. Li, Sens. Actuators, B, 2019, 299, 126937 CrossRef CAS.
- Z. H. Wang, D. Chen, B. L. Gu, B. Gao, Z. D. Liu, Y. S. Yang, Q. L. Guo, X. H. Zheng and G. Wang, Diamond Relat. Mater., 2020, 104, 107749 CrossRef CAS.
- S. A. Nsibande and P. B. C. Forbes, RSC Adv., 2020, 10, 12119–12128 RSC.
- V. Glembockyte, M. Frenette, C. Mottillo, A. M. Durantini, J. Gostick, V. Strukil, T. Friscic and G. Cosa, J. Am. Chem. Soc., 2018, 140, 16882–16887 CrossRef CAS.
| This journal is © The Royal Society of Chemistry 2020 |


