 Open Access Article
High response photochromic films based on D–A diarylethenes and their application in holography†
Maria Chiara Manteroa,
Luca Oggionia,
Giorgio Pariania,
Fausto Ortica bc,
Silvano Toside,
Maurizio Canepaf,
Chiara Bertarelli
 gh,
Matteo Tommasini
 g and
Andrea Bianco
 *a
*a
aINAF – Osservatorio Astronomico di Brera, Via Bianchi 46, 23807, Merate, Italy. E-mail: andrea.bianco@inaf.it
bDipartimento di Chimica, Biologia e Biotecnologie, Università Degli Studi di Perugia, Via Elce di Sotto 8, Perugia, 06123, Italy
cIstituto Nazionale di Fisica Nucleare (INFN), Sezione di Perugia, Via Pascoli, Perugia, 06123, Italy
dDipartimento di Fisica, Università di Genova, Via Dodecaneso 33, Genova, 16146, Italy
eINFN, Sezione di Genova, Via Dodecaneso 33, Genova, 16146, Italy
fOPTMATLAB, Dipartimento di Fisica, Università di Genova, Via Dodecaneso 33, Genova, 16146, Italy
gDipartimento di Chimica, Materiali e Ingegneria Chimica, Politecnico di Milano, Piazza Leonardo da Vinci 32, 20133, Milano, Italy
hCenter for Nano Science and Technology, Istituto Italiano di Tecnologia, Via Pascoli 10, 20133, Milano, Italy
First published on 13th July 2020
Abstract
A set of photochromic dithienylethenes bearing amino and nitro groups are synthesised and embedded at high concentrations in a polymer matrix (Cellulose Acetate Butyrate, CAB) to produce films showing a large reversible modulation of the complex refractive index in the Vis-NIR spectral range, thanks to an interesting combination of remarkable response at the molecular level and very high load capability in the chosen matrix. The photochromic derivatives are characterized in solution and in CAB films by means of electronic and vibrational spectroscopy, complemented by DFT calculations. Both the real and imaginary part of the refractive index are determined by spectroscopic ellipsometry. The modulation of the refractive index in the near infrared is in the range 0.02–0.04. These are very large values for such kinds of systems and they are due to a favourable combination of very large solubility of the derivatives in CAB and a high polarisability change. As for the change in transparency in the visible, contrast values larger than 103 are easily achieved. Based on such films, holograms are written and reconstructed with a very high fidelity and efficiency.
Introduction
Nowadays, photochromic materials are considered in a broad perspective as light switches of microscopic and macroscopic properties. The modulation and control of fluorescence are widely studied1–4 for their potential use in high-resolution microscopy;5,6 the mechanical effect has also been highlighted7–9 and other examples include the use of photochromic molecules in photopharmacology and to trigger specific functions in biological systems.10,11In spite of such broader application spectrum, the optical field remains a key one where photochromic systems are valuable. In particular, this is the case of holography and holographic optical elements (HOEs).12–14
An HOE is a diffractive element that is produced by means of holography15 and that allows the production of very different optical functions, such as light focusing, light diffusing and 3D imaging, paving the way to new conceptual optical designs that are thin, light and efficient. Their principle of work is the diffraction by a periodic modulation of transparency and/or the refractive index impressed in the photosensitive material. Moreover, their diffraction efficiency is directly related to the modulation of transparency and refractive index.16,17
It is apparent how photochromic materials are good candidates for such application thanks to their reversible modulation of both transparency and refractive index.18 In particular, diarylethenes have a prominent role. Since the discovery of their photochromic properties by Irie,19,20 they have become the reference P-type photochromic materials with high fatigue resistance, high quantum yields and remarkable photochromic properties in solid phase (crystal and amorphous).21 Indeed, diarylethenes have been used in high response polymeric films.22–25 In these systems, it was demonstrated that changes in transparency and refractive index were remarkable18 if backbone photochromic polymers were used.26 Thanks to that, diarylethene-based HOEs have already been reported in the literature.27,28
To foster the application of photochromic molecules in holography, it would be highly desirable to find a good combination of diarylethene derivatives with peculiar structure and polymer matrix showing a very large solubility and modulation of optical properties.
Here we report about three dithienylethene derivatives that are very soluble in the CAB matrix and that are functionalised with donor and/or acceptor functional groups. Such molecules are designed to enhance the absorption properties and the refractive index modulation, thus improving the performance of the holograms. The study of the photochromic and spectroscopic performances is carried out in solution and then in the CAB matrix. We show the potential application of such systems in real devices by producing reliable phase and amplitude computer-generated holograms with performance comparable or better than that of backbone photochromic polymers.
Materials and methods
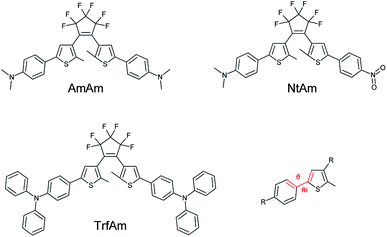
The three molecules considered feature the same basic structure, namely the 1,2 dithienylperfluorocyclopentene, functionalized with different side groups (R1 and R2) in the para position of the phenyl ring: two electron donor groups (dimethylaniline, diphenylaniline) and one electron acceptor group (nitrophenyl). Fig. 1 reports the chemical structure of the three derivatives in their open form, which is uncoloured, and the corresponding names used throughout the paper.Notably, the two symmetric molecules, have been already reported in the literature for improving the cycloreversion by means of a complexation (AmAm)29 and for the development of anti-counterfeiting inks (TrfAm),30 showing the effect on the switching properties. The asymmetric derivative (NtAm) was study from a theoretical point of view to evaluate the nonlinear optical properties.31
Chemical synthesis and film preparation
The synthesis of the molecules followed a Suzuki cross-coupling between 1,2-bis-(5-chloro-2-methyl-3-thienyl)hexafluorocyclo-pentene and commercial available boronic acids or pinacol esters,32 by catalysis with Pd(PPh3)4 or X-Phos and Pd(OAc)2.33Unless otherwise specified, all reagents, catalysts, solvents were commercial (Sigma-Aldrich, Alfa Aesar, Frontier Scientific). All reactions of air–water-sensitive reagents and intermediates were carried out in dried glassware and argon atmosphere. Solvents were previously dried by means of conventional methods and stored under argon. NMR spectra were recorded on a Bruker AXR 400 spectrometer at 400 MHz. Mass spectra were recorded on a Bruker Esquire 3000 plus.
![[thin space (1/6-em)]](https://www.rsc.org/images/entities/char_2009.gif) :
:![[thin space (1/6-em)]](https://www.rsc.org/images/entities/char_2009.gif) ethyl acetate, 1
ethyl acetate, 1![[thin space (1/6-em)]](https://www.rsc.org/images/entities/char_2009.gif) :
:![[thin space (1/6-em)]](https://www.rsc.org/images/entities/char_2009.gif) 0 to 19
0 to 19![[thin space (1/6-em)]](https://www.rsc.org/images/entities/char_2009.gif) :
:![[thin space (1/6-em)]](https://www.rsc.org/images/entities/char_2009.gif) 1 v/v). Powder of the desired compound (0.125 g, 0.21 mmol) was obtained in 36% yield.
1 v/v). Powder of the desired compound (0.125 g, 0.21 mmol) was obtained in 36% yield.1H-NMR (CDCl3) δ ppm: 7.43 (4H, Ph-H, d, J = 8.8 Hz), 7.12 (2H, Th-H, s), 6.74 (4H, Ph-H, br d, J = 7.8 Hz), 3.00 (6H, –N(CH3)2, s), 1.94 (6H, –CH3, s).
13C-NMR (101 MHz, CDCl3) δ ppm: 150.19, 142.88, 139.22, 126.58, 125.73, 121.89, 120.05, 112.55, 40.46, 14.44.
ESI-MS: m/z 607.2 [M + H+].
![[thin space (1/6-em)]](https://www.rsc.org/images/entities/char_2009.gif) :
:![[thin space (1/6-em)]](https://www.rsc.org/images/entities/char_2009.gif) dicloro methane, 1
dicloro methane, 1![[thin space (1/6-em)]](https://www.rsc.org/images/entities/char_2009.gif) :
:![[thin space (1/6-em)]](https://www.rsc.org/images/entities/char_2009.gif) 0 to 1
0 to 1![[thin space (1/6-em)]](https://www.rsc.org/images/entities/char_2009.gif) :
:![[thin space (1/6-em)]](https://www.rsc.org/images/entities/char_2009.gif) 2 v/v). Powder of the desired compound (0.06 g, 0.10 mmol) was obtained in 9% yield.
2 v/v). Powder of the desired compound (0.06 g, 0.10 mmol) was obtained in 9% yield.The NMR and mass spectra are reported in the ESI (Fig. S1, S2 and S3†).
1H-NMR (CDCl3) δ ppm: 8.24 (2H, Ph-H, d, J = 8.8 Hz), 7.66 (2H, Ph-H, d, J = 9.2 Hz), 7.42 (2H, Ph-H, d, J = 8.8 Hz), 7.41 (1H, Th-H, s), 7.08 (1H, Th-H, s), 6.80 (2H, Ph-H, br d, J = 7.8 Hz), 3.00 (6H, –N(CH3)2, s), 2.05 (3H, Th-CH3, s), 1.98 (3H, Th-CH3, s).
13C-NMR (101 MHz, CDCl3) δ ppm: 146.90, 144.18, 143.19, 139.44, 139.26, 126.79, 126.65, 125.82, 125.43, 125.29, 124.50, 120.04, 112.96, 14.73, 14.48.
ESI-MS: m/z 609.1 [M + H+].
![[thin space (1/6-em)]](https://www.rsc.org/images/entities/char_2009.gif) :
:![[thin space (1/6-em)]](https://www.rsc.org/images/entities/char_2009.gif) water. The combined organic layer was dried over Na2SO4, filtered and, after solvent removal, the raw product was purified by flash chromatography on silica gel (hexane
water. The combined organic layer was dried over Na2SO4, filtered and, after solvent removal, the raw product was purified by flash chromatography on silica gel (hexane![[thin space (1/6-em)]](https://www.rsc.org/images/entities/char_2009.gif) :
:![[thin space (1/6-em)]](https://www.rsc.org/images/entities/char_2009.gif) dichloromethane, 8
dichloromethane, 8![[thin space (1/6-em)]](https://www.rsc.org/images/entities/char_2009.gif) :
:![[thin space (1/6-em)]](https://www.rsc.org/images/entities/char_2009.gif) 2 v/v) to give 550 mg of the desired product in 47% yield.
2 v/v) to give 550 mg of the desired product in 47% yield.1H-NMR (CDCl3) δ ppm: 7.39 (4H, Ph-H, d, J = 8.6 Hz), 7.27 (8H, Ph-H, dd, J = 7.3 Hz, J = 8.4 Hz) 7.17 (2H, Th-H, s), 7.11 (8H, Ph-H, d, J = 7.6 Hz), 7.05 (two signals overlapping, 8H, Ph-H, d, J = 8.4 Hz), 1.96 (6H, –CH3, s).
13C-NMR (101 MHz, CDCl3) δ ppm: 147.68, 147.39, 142.11, 140.41, 129.36, 127.27, 126.43, 125.87, 124.61, 123.53, 123.28, 121.44, 14.55.
ESI-MS: m/z 854.2 [M+].
The molecules were converted to the closed form by means of UV illumination at 311 nm (Philips PL-S 9W/01). The back conversion was obtained using a halogen lamp filtered with a Schott OF570 longpass filter.
The three molecules have been chosen to produce thin films in cellulose acetate butyrate, CAB matrix (Eastman CAB-531-1) on silicon substrates for the study of the complex refraction index and on BK7 glass substrates to analyse the transparency modulation. The films have been obtained starting from a solution of butyl acetate (80% v/v) and chloroform (20% v/v) containing a concentration of CAB (3% wt/v for the modulation of refractive index and 9% for the modulation of transparency) and different concentrations of photochromic molecules. The films were obtained by spin coating (POLOS 200), using different revolution speed for the two substrates: 300–500 rpm in the case of silicon, obtaining thicknesses of 300/500 nm; 600–700 rpm in the case of BK7 obtaining a thickness of approximately 3 μm.
Quantum chemical calculations
Density functional theory (DFT) calculations were carried out on both open and closed forms for the evaluation of the equilibrium geometry, the normal modes of vibration, the IR spectrum and the electronic molecular polarisability at static electric field. We employed the B3LYP/6-31G(d,p) method and the quantum chemistry code Gaussian.34Spectroscopic and ellipsometry characterisation
The measurements of the light absorption properties of the photochromic solutions and films were performed with a Jasco V570 UV-Vis-NIR spectrometer. The absorption spectra are reported here as molar extinction coefficient ε (M−1 cm−1). The IR absorption spectra were collected with a Nicolet FT-IR spectrophotometer Magna IR 560 (64 scan, 2 cm−1 resolution), drop casting the molecules from solution on a ZnSe substrate. The spectra were then analysed with Omnic 7.1 software.Spectroscopic ellipsometry measurements were performed with a rotating compensator instrument (M2000, J.A. Wollam Co., Inc) and analysed using the VASE software. The measurements were carried out at incident angles of 60°, 65° and 70°.
The well-known, simple Cauchy model was found to fit data in the transparent region (null extinction), 1000–1700 nm. The real part of the refraction index and the extinction coefficient have been obtained by applying a multi-oscillator model to data in the 500–1700 nm range.26
Design and writing of computer generated holograms (CGH)
The CGHs adopted in this paper are Fresnel holograms calculated starting from black and white images as reported in the literature.35The calculated binary pattern was then transferred by means of a direct-laser writing machine36 equipped with visible lasers. The photochromic film is first completely converted to the coloured form by means of UV illumination, then the visible laser (638 nm, nominal power of 15 mW) is focused onto the film to convert it locally to the transparent form.
For the hologram reconstruction, a He–Ne laser (633 nm) was employed in case of amplitude reconstruction. The images were collected by a CCD camera (Thorlabs DCC1545M).
For the measurement of the diffraction efficiency of gratings, we used a tuneable Xenon light source (Newport TLS130B-300X). The wavelength was scanned from 500 to 1000 nm and sent through the grating at normal incidence. The diffracted light was measured by a silicon photodiode (Thorlabs S130VC) at the corresponding diffraction angle. The same measurement was performed without the grating to have the total intensity. The ratio of the two measurements was the efficiency.
Interferometry has been applied to measure the pattern distortion of the grating by means of a Zygo GPI interferometer.
Results and discussion
In this section, we report the results of our investigation. We start from the outcomes of the DFT calculations; then, we show the spectroscopic (UV-Vis/IR) characterisation of the solutions and films, and finally we report and discuss the results of the holographic writing.Molecular structure
Table 1 reports the dihedral angle θ between the thiophene ring and the phenyl ring (see Fig. 1 for the definition).| Dihedral angles θ (deg) | ||||||
|---|---|---|---|---|---|---|
| θ open | θ close | Δθ | ||||
| AmAm | 25.1° | 9.5° | 15.3° | |||
| TrfAm | 24.7° | 12.3° | 12.4° | |||
| NtAm | Am | Nt | Am | Nt | Am | Nt |
| 25.2° | 20.8° | 5.0° | 15.2° | 20.2° | 5.6° | |
θ is larger in the open form than in the closed form, in agreement with previous works.37 Such increase of the planarity of the molecule in the closed form leads to more effective π conjugation that competes with the steric hindrance of the facing hydrogen atoms of phenyl and thienyl rings.37 A further analysis reveals that the θ angle is larger in the open form when a donor group (Am) is present instead of an acceptor group (Nt). This is consistent with the increase of electron density on the phenyl ring caused by the donor, which increases the steric hindrance. Remarkably, switching to the closed form, the decrease of the θ angle (i.e., the planarisation of the molecule) is more pronounced in the molecules with donor groups. Interestingly, the largest change occurs in the asymmetric molecule (NtAm) on the amino side (Am) – see Table 1. This is not surprising since, in the closed form, the presence of the push–pull structure enhances charge transfer and π-delocalization through the whole molecule. Therefore, in this peculiar case (NtAm), a reduction of 20° in the θ angle occurs, with a final value of about 5°, which corresponds to an almost planar structure.
The inter-ring bond length Ri (Table 2) follows a trend consistent with that of the angle θ: Ri shortens on passing from the open to the closed form. This means that the single bond partially acquires a double bond character in the closed form, in relation with the increased effectiveness of π-delocalization.
| Bond length Ri (Å) | ||||||
|---|---|---|---|---|---|---|
| Ri open | Ri close | ΔRi | ||||
| AmAm | 1.465 | 1.455 | 0.010 | |||
| TrfAm | 1.465 | 1.457 | 0.008 | |||
| NtAm | Am | Nt | Am | Nt | Am | Nt |
| 1.464 | 1.464 | 1.452 | 1.462 | 0.012 | 0.002 | |
We are interested in the evaluation of the refractive index; therefore, we calculated the molecular polarisability tensor (α) since the macroscopic refractive index depends on it.38 From the DFT calculations of α we obtained the average molecular polarisability, P = (αxx + αyy + αzz)/3, and the average polarisability contribution per electron, PPE = P/Z (where Z is the sum of the atomic numbers of the molecule). The values of P and PPE are reported in Table 3. In the closed form, polarisabilities are always larger than in the open form. As already pointed out, upon photoisomerisation, the delocalization path of π electrons increases. This leads to the increase of polarisability, in agreement with literature.37,39 Accordingly, as shown in Table 3, we observe polarisability increments in the range 20–30%. The largest polarisability change occurs in TrfAm, thanks to the presence of the three phenyl rings on each side. The ΔPPE is even more intersting: this quantity reflects the specific increase of the electronic π-delocalization. We notice that the largest ΔPPE occurs in the push–pull structure (0.45 bohr3), whereas the two symmetric amine-based molecules show a smaller value (∼0.4 bohr3).
| Polarizability P (bohr3) | PPE (bohr3) | |||||
|---|---|---|---|---|---|---|
| PO | PC | ΔP | PPEO | PPEC | ΔPPE | |
| AmAm | 446 | 579 | 133 | 1.42 | 1.84 | 0.42 |
| NtAm | 429 | 569 | 140 | 1.37 | 1.82 | 0.45 |
| TrfAm | 694 | 876 | 182 | 1.57 | 1.98 | 0.41 |
Characterisation in solution and thin film
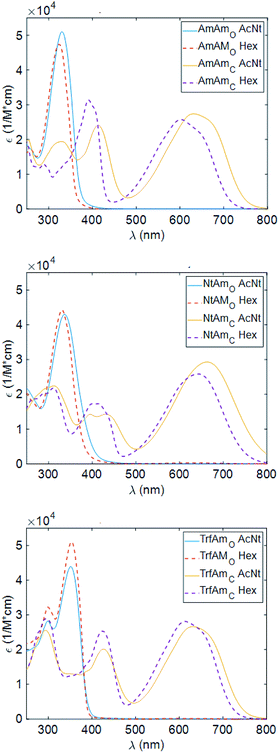
We show in Fig. 2 the UV/Vis absorption of the open and closed forms of the three diarylethenes in solution state (acetonitrile and hexane solvents). Table 4 reports the wavelength position of the absorption peaks with the corresponding molar extinction coefficients.| Acetonitrile | ΦO→C | Hexane | ΦO→C | |||||||
|---|---|---|---|---|---|---|---|---|---|---|
| λo | εo | λc | εc | λo | εo | λc | εc | |||
| AmAm | 330 | 4.94 | 635 | 2.94 | 0.02 | 324 | 4.58 | 607 | 2.22 | 0.79 |
| NtAm | 336 | 4.30 | 663 | 2.93 | 0.09 | 330 | 4.42 | 640 | 2.58 | 0.57 |
| TrfAm | 351 | 4.40 | 630 | 2.78 | 0.37 | 353 | 5.10 | 613 | 2.81 | 0.62 |
Considering the spectra of the open forms, we do not identify large differences between hexane and acetonitrile. We observe a small bathochromic effect increasing the polarity of the solvent,40,41 with NtAm showing a more pronounced effect.
The situation dramatically changes in the coloured form, the bathochromic effect is large, especially for AmAm and NtAm. As for the molar extinction coefficient ε, the three derivatives show values of the order of 30![[thin space (1/6-em)]](https://www.rsc.org/images/entities/char_2009.gif) 000 M−1 cm−1. They are very large if compared with those of systems based on the same phenylthienyl perfluorocyclopentene structure, that are in the 10
000 M−1 cm−1. They are very large if compared with those of systems based on the same phenylthienyl perfluorocyclopentene structure, that are in the 10![[thin space (1/6-em)]](https://www.rsc.org/images/entities/char_2009.gif) 000–20
000–20![[thin space (1/6-em)]](https://www.rsc.org/images/entities/char_2009.gif) 000 M−1 cm−1 range, depending on the enhancement of the π extension.35,42 We also notice the large intensity of the secondary peak in the region 400–450 nm for the coloured form of AmAm and TrfAm and its shape is different in the two solvents. Such large values will turn into high contrast values in transparency for polymeric films doped with such molecules.
000 M−1 cm−1 range, depending on the enhancement of the π extension.35,42 We also notice the large intensity of the secondary peak in the region 400–450 nm for the coloured form of AmAm and TrfAm and its shape is different in the two solvents. Such large values will turn into high contrast values in transparency for polymeric films doped with such molecules.
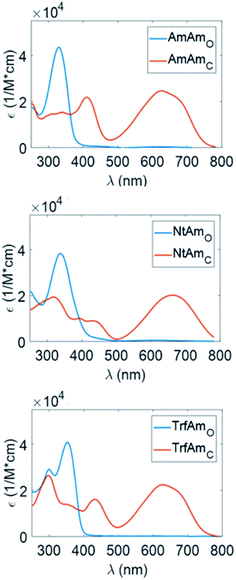
The three derivatives were added to the CAB for the production of thin films on silicon and quartz substrates. In Fig. 3, we report the wavelength dependence of the extinction coefficients of such films cast on quartz substrates.
The peak position (λo) and the corresponding molar extinction (εo) of the CAB films doped with the three diarylethene derivatives are reported in Table 5.
| Film CAB + molecule | ||||
|---|---|---|---|---|
| λo | εo | λc | εc | |
| AmAm | 330 | 4.35 | 627 | 2.46 |
| NtAm | 339 | 3.83 | 660 | 2.01 |
| TrfAm | 353 | 4.08 | 629 | 2.24 |
It is worth noting that the molar extinction coefficients are very similar in acetonitrile and in CAB films (see Tables 4 and 5 for comparison).
Infrared spectra
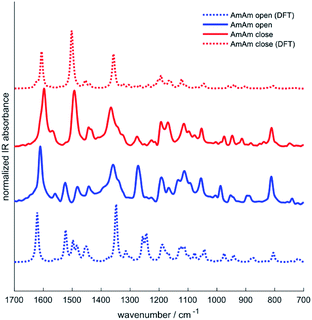
Infrared spectroscopy has been used in the past to study the chemical structure of diarylethenes and the effect of the substituents.37,43 For this purpose, the IR spectra of the three diarylethenes in open and closed form were recorded and compared to the spectra simulated from DFT calculations. We focused on the 1700–700 cm−1 spectral range, where we observe the largest differences between the open and closed form. We report in Fig. 4 the simulated and experimental IR spectra of AmAm (the spectra of the other two derivatives are in the ESI, Fig. S4†). We notice the good agreement of the theoretical spectra with their experimental counterparts.While going from the open to the closed form we observe a redshift of the collective CC stretching mode of the backbone, which is assigned to the intense band at ∼1600 cm−1. Another band with similar behaviour is observed at about 1500 cm−1, which is consistent with the results reported in the literature for analogous systems.44,45
The inspection of the total IR intensities computed by DFT for the three derivatives in the two forms reveals an interesting effect (Table 6). A strong increase in the IR intensity occurs from the open to the closed form. The effect is remarkable for the NtAm derivative that has a strong push–pull character in the closed form, which drives a large increase of the IR intensity of the normal modes involving the CC stretching of the molecular backbone. Indeed, such modes are coupled with sizeable π electron density variations.
| Conversion degree and intensity IR, I [km mol−1] | |||||
|---|---|---|---|---|---|
| Conversion degree | Itot open | Itot closed | Ic/Io | ΔI | |
| AmAm | 98.7% | 5652.8 | 10![[thin space (1/6-em)]](https://www.rsc.org/images/entities/char_2009.gif) 660.5 660.5 |
1.88 | 5007.6 |
| NtAm | 98.8% | 5457.1 | 11![[thin space (1/6-em)]](https://www.rsc.org/images/entities/char_2009.gif) 386.4 386.4 |
2.09 | 5929.3 |
| TrfAm | 87.7% | 6407.3 | 11![[thin space (1/6-em)]](https://www.rsc.org/images/entities/char_2009.gif) 863.8 863.8 |
1.85 | 5456.4 |
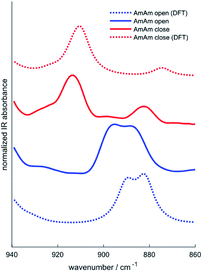
Another important information that can be achieved from the IR spectra is the degree of conversion of the diarylethenes from the uncoloured to the coloured forms. We identified a band around 910 cm−1, which is assigned by DFT to the bending of the two –CH3 groups linked to the thiophene rings. The inspection of this band allows monitoring the photochromic conversion because this band shifts to higher wavenumbers when going from the open to the closed form – see for instance the spectra of AmAm shown in Fig. 5.
When there is a complete conversion of the photochromic system the doublet of the open form disappears. This behaviour is common to all the molecules. The degree of conversion determined by IR spectroscopy of the 910 cm−1 band is reported in Table 6 with its definition. Such values are consistent with many diarylethene derivatives40,46–48 and with those bearing the same perfluorodithienylcyclopentene core,42 that show a degree of conversion of about 100% at the photostationary state in different solvents.
Modulation of transparency
Photochromic materials, in particular diarylethenes, have an important modulation of transparency:18,24,27 the systems described in this paper have the same feature according to the results obtained in solution. In order to quantify the modulation of transparency, we define the contrast as the ratio of transmittance between the uncoloured (open) and coloured (closed) forms:
 | (1) |
The visible band is the most important spectral region for applications, for instance, in holography.35 In this region, only the closed form has an absorption, therefore the visible contrast depends on the absorbance of the closed form, Ac(λ), as shown in eqn (1). It is therefore necessary to have films with a very high absorption in the visible. In the case of amplitude CGH, the efficiency is directly dependent on the contrast and values larger than 102 are required at the wavelength selected for the hologram reconstruction,28 for other applications that exploit a wider spectral range, such requirement must be extended to the target region.
In accordance with this requirement, CAB films doped with AmAm and TrfAm derivatives were obtained on BK7 glass substrates. The details of the films are reported in Table 7.
| Film | Molecule | Concentration | d (μm) | Abs closed form [633 nm] | Contrast, C [633 nm] |
|---|---|---|---|---|---|
| 1 | TrfAm | 16.2% | 3.7 | 2.5 | 326.5 |
| 2 | AmAm | 16.6% | 3.7 | 2.8 | 584.6 |
| 3 | AmAm | 16.6% | 4.4 | 3.6 | 3919 |
| 4 | AmAm | 18.7% | 2.8 | 2.8 | 828.5 |
One can see that the solubility of the photochromic molecules in CAB matrix is large. Such feature together with the large absorption coefficient of the closed form in the visible makes it possible to obtain large absorption and contrast in films with a thickness of a few μm. This is important, since it is easier to preserve a good optical quality in thin films.
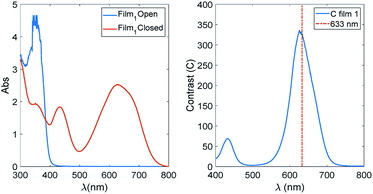
In Fig. 6, the spectra of Film 1 containing 16.2% of TrfAm are reported together with the contrast function for the same film.
We notice that the contrast threshold of 100 is exceeded in a spectral region of about 100 nm centred at 600 nm. Bearing in mind that this is the film with the lowest value of contrast, this means that is not difficult to have films matching the requirements of having efficient amplitude holograms and optical devices based on contrast in the visible.
Modulation of the refractive index
The modulation in transparency is suitable for amplitude holograms, whereas the modulation of the real part of the refractive index is crucial in order to have volume phase holograms.49The two key parameters that guide the refractive index and its change upon photoisomerisation are the molecular polarisability and the concentration of the photochromic moiety.35
Here, we exploited spectroscopic ellipsometry50 to determine the optical properties and in particular the refractive index of films contained CAB's matrix and different concentration of AmAm, NtAm and TrfAm deposited on silicon substrates in open and closed form.
We expect that the photochromic film can be described by multi-oscillator models with a trend of the refractive index reported in the literature:18 the open form does not absorb in the visible and in the NIR range, but only in the UV (see discussion of Fig. 3 for the films on quartz). In this situation, the extinction is null (κ = 0) and the real part of refractive index has a normal dispersion (see Fig. 7, top left). Instead, in the closed form (Fig. 7, top right), the normal dispersion is only present in the NIR range, because the structure is coloured and absorbs in the visible (κ > 0).
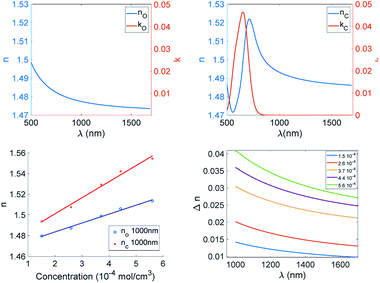 | ||
| Fig. 7 Top: Complex refractive index for the open (left panel) and closed (right panel) forms of the AmAm doped CAB film (the plots of the other two derivatives are reported in Fig. S5†). Bottom: (left panel) The real part of the refractive index at 1000 nm in the open and closed forms as a function of the molar concentration of AmAm in CAB; (right panel) refractive index difference (Δn = nC − nO) as function of the wavelength. | ||
To evaluate the dispersion curve of the real part of the refractive index, we selected a 2-terms Cauchy model to fit the data over the 1000–1700 nm range. Pure CAB films were used to determine the refractive index of the matrix and such value was used as a reference. In the bottom of Fig. 7, we show the refractive index at 1000 nm of CAB films doped with different amounts of the AmAm dye, together with the dispersion curve of Δn calculated as the refractive index difference between the closed and the open forms.
We report in Table 8 the values of the A and B parameters of the Cauchy model, the corresponding refractive index (n), and the refractive index difference Δn = nC − nO at 1000 nm for all concentrations. We observe a huge increase of the B parameter going from the open to the closed form. The B parameter is related to the dispersion and it is mainly dependent on the presence and position of the absorption band in the visible. Furthermore, we also observe a linear relationship of the refractive index with the concentration of the dye. The slope is much larger for the coloured form. This is expected since both the A and B values of the Cauchy formula increase with the concentration. This is due to the combination of the increase of polarisability going from the open to the closed form and to the pre-resonance effect which is more pronounced in the coloured form.
| C molar [10−4 mol cm−3] | Form | A | B [104 nm2] | n, 1000 nm | Δn, 1000 nm |
|---|---|---|---|---|---|
| AmAm | |||||
| 1.5 | Open | 1.473 | 0.667 | 1.480 | 0.014 |
| Closed | 1.480 | 1.346 | 1.494 | ||
| 2.6 | Open | 1.479 | 0.886 | 1.487 | 0.020 |
| Closed | 1.488 | 1.975 | 1.508 | ||
| 3.7 | Open | 1.489 | 0.966 | 1.499 | 0.030 |
| Closed | 1.506 | 2.377 | 1.529 | ||
| 4.4 | Open | 1.494 | 1.162 | 1.506 | 0.036 |
| Closed | 1.513 | 2.883 | 1.542 | ||
| 5.6 | Open | 1.503 | 1.088 | 1.514 | 0.041 |
| Closed | 1.522 | 3.207 | 1.555 | ||
![[thin space (1/6-em)]](https://www.rsc.org/images/entities/char_2009.gif) |
|||||
| NtAm | |||||
| 1.6 | Open | 1.474 | 0.887 | 1.483 | 0.013 |
| Closed | 1.480 | 1.558 | 1.496 | ||
| 2.5 | Open | 1.483 | 0.727 | 1.491 | 0.024 |
| Closed | 1.495 | 1.968 | 1.514 | ||
| 4.3 | Open | 1.492 | 0.874 | 1.501 | 0.030 |
| Closed | 1.506 | 2.571 | 1.531 | ||
![[thin space (1/6-em)]](https://www.rsc.org/images/entities/char_2009.gif) |
|||||
| TrfAm | |||||
| 1.2 | Open | 1.474 | 1.149 | 1.485 | 0.008 |
| Closed | 1.478 | 1.537 | 1.493 | ||
| 2.3 | Open | 1.490 | 0.783 | 1.498 | 0.016 |
| Closed | 1.499 | 1.538 | 1.514 | ||
| 3.2 | Open | 1.500 | 1.154 | 1.511 | 0.023 |
| Closed | 1.511 | 2.329 | 1.534 | ||
This trend is common to the three derivatives. To better understand the difference among such diarylethenes, we plot the modulation of the refractive index at 1000 nm as a function of dye concentration (Fig. 8).
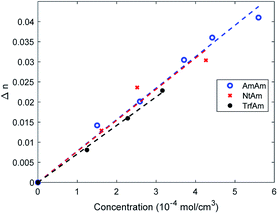 | ||
| Fig. 8 Trends of Δn at 1000 nm of CAB films as function of molar concentration of the three photochromic derivatives. | ||
It is clear that the dye concentration is the driving parameter inducing the modulation of the refractive index, and just small differences show up among the three diarylethenes investigated here.
The modulation of the refractive index in the NIR is very large and such values were achieved in the past only in backbone photochromic polymers18,24,26 indicating that a suitable combination of soluble derivative in a polymer matrix and a large modulation of polarisability induced by electroactive substituents is a winning strategy. We can conclude that efficient phase holograms can be obtained with such systems.
Holographic writing and reconstruction
To test the capability of writing photochromic holograms, we started with a diffraction grating, which can be considered as the simplest hologram. We wrote on Film 2 (see Table 7) a 10 mm × 10 mm grating with a line density of 125 L mm−1 and a duty cycle of 50%. The procedure for the device manufacturing is reported in Materials and methods. In Fig. 9, the microscope image of the pattern is reported.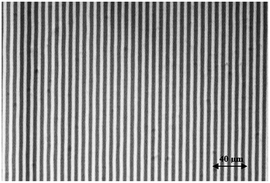 | ||
| Fig. 9 Microscope image of the binary grating written on Film 2 with photochromic AmAm collected by means of a standard optical microscope. | ||
We notice the good quality of the pattern; moreover, the measured value of the duty cycle (DC) was 45%, very close to the design value of 50%.
The pattern distortion has been evaluated by using a null interferometer with a plane reference. Indeed, by measuring the 0, −1 and +1 orders, it is possible to separate the component of the wave front due to the pattern defects and to the surface distortion.51 The RMS error in the pattern writing is 0.1 μm, which is low and confirms the high precision of the direct writing machine.
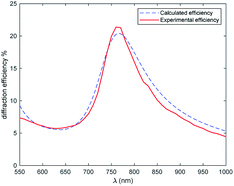
The diffraction efficiency of the +1 order was measured as function of the wavelength and light polarization. The plot is reported in Fig. 10.
Considering the absorption properties of the film, we can say that the grating is a pure phase grating at long wavelengths and it becomes a mix of amplitude and phase grating below 800 nm. We see how the efficiency increases from 1000 nm to shorter wavelengths52 and this is consistent with the increase of the modulation of the refractive index. Remarkable values of about 22% are measured at about 770 nm, then the efficiency drops quickly because of the increase in the absorption component and a corresponding decrease of Δn, due to the anomalous dispersion of the coloured form. Values of the order of 6% are measured around 630 nm, then, at shorter wavelength, the efficiency slightly increases since the absorption decreases and Δn is not negligible (the closed form shows a low index). The curve can be modelled by means of an RCWA approach, as shown in Fig. 10. We notice the good agreement with the experimental results.
The step forward has been the writing of a Fresnel lens on Film 1, which is doped with TrfAm molecule. The lens was designed to have a diameter of 7 mm and a focal length of 20 cm. In Fig. 11, two images of the CGH Fresnel lens are reported.
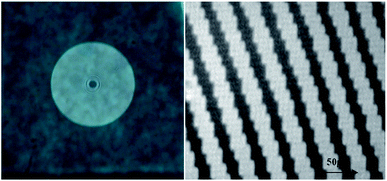 | ||
| Fig. 11 Left: Photo of the Fresnel lens written on the photochromic film; Right: Detail of Fresnel pattern recorded with a standard optic microscope. | ||
The pattern was illuminated with a collimated red laser at 633 nm and the intensity of the focused spot was measured with a photodiode, providing a diffraction efficiency of 6.7% in the first order.
A CCD camera has been also used to determine the focal position as reported in the top panels of Fig. 12, and the value of 20 cm was confirmed. In addition, we also recorded frames of first, second and third orders at the focal lengths L, L/2 and L/3, respectively (bottom panels of Fig. 12).
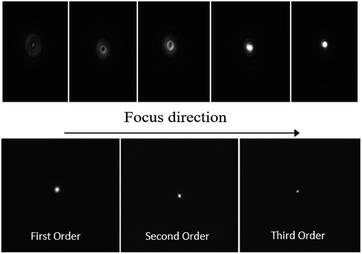 | ||
| Fig. 12 Top: Frames to achieve origin of first order focus of Fresnel lens. Bottom: Images of the focus spot for the three diffraction orders. | ||
The size of the focal spot decreases going from the first to the third order. This is consistent with the fact that the focal ratio F# = L/D decreases (L and D are the focal length and the diameter of Fresnel lens, respectively).
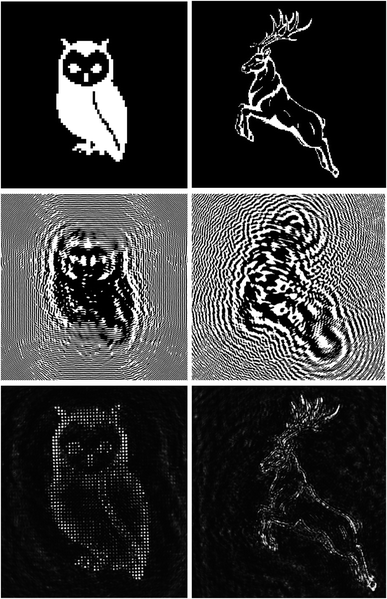
To prove the quality of the writing setup and of the substrate, we realized two Fresnel CGHs of two images using Film 2 and Film 3. In Fig. 13, the starting images, the corresponding calculated CGHs and the reconstructed images (at 633 nm) of an owl (Film 1) and a deer (Film 2) are reported.
The overall size of the holograms is 8 mm × 8 mm, the pixel size is 4 μm and in both cases the reconstructed image is 4 mm × 4 mm at a focal distance of 500 mm. However, the pixel sizes of the reconstructed images are different: 40 μm and 13 μm for the owl and the deer respectively. We notice that the reconstruction quality is in general high, with better details in the case of the owl. This is due to the fact that the deer has many tiny details that could be reconstructed only if the CGH had a larger resolution.
Conclusions
In this paper we studied three dithienylethene derivatives bearing both donor and acceptor groups with a unique combination of high solubility in CAB matrix and a large change in molecular properties. The UV-vis characterisation in solution showed the large absorption coefficients of the derivatives with at least one donor group. Looking at the equilibrium geometries, it is apparent how the increase in π conjugation going from the open to the closed form is enhanced when a D–A structure is present, which occurs for the nitro–dimethylamino compound (NtAm). This behaviour is due to the push–pull character of NtAm. Considering IR spectroscopy, we have shown that the increase of absorption intensity can reach a factor of two when going from the open to the closed form of NtAm. Based on IR spectroscopy in solution state we have also proved an almost total photoconversion between the two forms. CAB-based films doped with the photochromic derivatives were obtained and a very good solubility of the derivatives in the polymer matrix was found. This is crucial since it allowed increasing the doping level thus achieving, even for thin films, a large modulation of the transparency in the visible and a large change of the refractive index in the NIR (Δn). Such high response films were used as substrates for CGHs, starting from grating to images. It has been proved that the holograms can work both in amplitude (in the visible) and in phase (in the NIR) providing efficiencies larger than 20%. We can therefore consider such polymer films as rewritable films with very appealing potential in high performance hologram manufacturing.Conflicts of interest
There are no conflicts to declare.Acknowledgements
The authors thank Michele Magnozzi, Paola Moretti and Adalberto Cavalleri for experimental assistance and Chiara Toccafondi for help in modelling ellipsometry data.Notes and references
- A. Bianco, S. Perissinotto, M. Garbugli, G. Lanzani and C. Bertarelli, Laser Photonics Rev., 2011, 5, 711–736 CrossRef CAS.
- S. Ishida, D. Kitagawa, S. Kobatake, S. Kim, S. Kurihara and T. Fukaminato, Chem. Commun., 2019, 55, 5681–5684 RSC.
- T. Fukaminato, S. Ishida and R. Métivier, NPG Asia Mater., 2018, 10, 859–881 CrossRef CAS.
- A. Fernandez-Acebes and J. M. Lehn, Chem.–Eur. J., 1999, 5, 3285–3292 CrossRef CAS.
- D. Kim, K. Jeong, J. E. Kwon, H. Park, S. Lee, S. Kim and S. Y. Park, Nat. Commun., 2019, 10, 3089 CrossRef PubMed.
- Y. Arai, S. Ito, H. Fujita, Y. Yoneda, T. Kaji, S. Takei, R. Kashihara, M. Morimoto, M. Irie and H. Miyasaka, Chem. Commun., 2017, 53, 4066–4069 RSC.
- R. Kajiya, S. Sakakibara, H. Ikawa, K. Higashiguchi, K. Matsuda, H. Wada, K. Kuroda and A. Shimojima, Chem. Mater., 2019, 31, 9372–9378 CrossRef CAS.
- F. Tong, D. Kitagawa, X. Dong, S. Kobatake and C. J. Bardeen, Nanoscale, 2018, 10, 3393–3398 RSC.
- Mechanically Responsive Materials for Soft Robotics, ed. H. Koshima, John Wiley & Sons, 2020 Search PubMed.
- W. A. Velema, W. Szymanski and B. L. Feringa, J. Am. Chem. Soc., 2014, 136, 2178–2191 CrossRef CAS PubMed.
- P. D. Bregestovski and G. V. Maleeva, Neurosci. Behav. Physiol., 2019, 49, 184–191 CrossRef.
- H. F. O. Müller, Renewable Energy, 1994, 5, 935–941 CrossRef.
- J.-A. Piao, M.-L. Piao, E.-S. Kim and N. Kim, Proc. SPIE, 2013, 8644, 864419 CrossRef.
- F.-K. Bruder, F. Deuber, T. Faecke, R. Hagen, D. Hoenel, D. Jurbergs, M. Kogure, T. Roelle and M.-S. Weiser, J. Photopolym. Sci. Technol., 2009, 22, 257–260 CrossRef CAS.
- D. H. Close, Opt. Eng., 1975, 14, 145402 CrossRef.
- B. R. Brown and A. W. Lohmann, IBM J. Res. Dev., 1969, 13, 160–168 Search PubMed.
- H. Kogelnik, Bell Syst. Tech. J., 1969, 48, 2909–2947 CrossRef.
- C. Bertarelli, A. Bianco, R. Castagna and G. Pariani, J. Photochem. Photobiol., C, 2011, 12, 106–125 CrossRef CAS.
- M. Hanazawa, R. Sumiya, Y. Horikawa and M. Irie, J. Chem. Soc., Chem. Commun., 1992, 206–207 RSC.
- S. Nakamura and M. Irie, J. Org. Chem., 1988, 53, 6136–6138 CrossRef CAS.
- M. Irie, T. Fukaminato, K. Matsuda and S. Kobatake, Chem. Rev., 2014, 114, 12174–12277 CrossRef CAS PubMed.
- Q. Luo, H. Cheng and H. Tian, Polym. Chem., 2011, 2, 2435–2443 RSC.
- T. J. Wigglesworth, A. J. Myles and N. R. Branda, Eur. J. Org. Chem., 2005, 1233–1238 CrossRef CAS.
- L. Oggioni, C. Toccafondi, G. Pariani, L. Colella, M. Canepa, C. Bertarelli and A. Bianco, Polymers, 2017, 9, 462 CrossRef PubMed.
- G. Pariani, R. Castagna, G. Dassa, S. Hermes, C. Vailati, A. Bianco and C. Bertarelli, J. Mater. Chem., 2011, 21, 13223–13231 RSC.
- C. Toccafondi, L. Occhi, O. Cavalleri, A. Penco, R. Castagna, A. Bianco, C. Bertarelli, D. Comoretto and M. Canepa, J. Mater. Chem. C, 2014, 2, 4692–4698 RSC.
- A. Bianco, C. Bertarelli, R. Castagna, G. Pariani and A. Zanutta, Proc. SPIE, 2012, 8281, 828104 Search PubMed.
- G. Pariani, C. Bertarelli, G. Dassa, A. Bianco and G. Zerbi, Opt. Express, 2011, 19, 4536–4541 CrossRef CAS PubMed.
- S. Lee, Y. You, K. Ohkubo, S. Fukuzumi and W. Nam, Chem. Sci., 2014, 5, 1463–1474 RSC.
- H. Wan, H. Xue, Y. Ling, Y. Qiao, Y. Chen and G. Zhou, Phys. Chem. Chem. Phys., 2018, 20, 14348–14356 RSC.
- K. J. Chen, A. D. Laurent and D. Jacquemin, J. Phys. Chem. C, 2014, 118, 4334–4345 CrossRef CAS.
- S. Hermes, G. Dassa, G. Toso, A. Bianco, C. Bertarelli and G. Zerbi, Tetrahedron Lett., 2009, 50, 1614–1617 CrossRef CAS.
- J. Yang, S. Liu, J.-F. Zheng and J. Steve Zhou, Eur. J. Org. Chem., 2012, 2012, 6248–6259 CrossRef CAS.
- M. J. Frisch, G. W. Trucks, H. B. Schlegel, G. E. Scuseria, M. A. Robb, J. R. Cheeseman, G. Scalmani, V. Barone, B. Mennucci, G. A. Petersson, H. Nakatsuji, M. Caricato, X. Li, H. P. Hratchian, A. F. Izmaylov, J. Bloino and G. Zhe, Gaussian 09, Revision E.01, 2009 Search PubMed.
- L. Oggioni, G. Pariani, C. Bertarelli and A. Bianco, Materials, 2019, 12, 2810 CrossRef CAS PubMed.
- A. Bianco, M. Mantero, L. Oggioni, G. Pariani, C. Bertarelli and F. Zamkotsian, Proc. SPIE, 2019, 11030, 110300B Search PubMed.
- G. Callierotti, A. Bianco, C. Castiglioni, C. Bertarelli and G. Zerbi, J. Phys. Chem. A, 2008, 112, 7473–7480 CrossRef CAS PubMed.
- C. J. F. Bottcher, Theory of electric polarisation, Elsevier, Amsterdam, 1952 Search PubMed.
- N. Adami, D. Fazzi, A. Bianco, C. Bertarelli and C. Castiglioni, J. Photochem. Photobiol., A, 2010, 214, 61–68 CrossRef CAS.
- S. Kobatake, Y. Terakawa and H. Imagawa, Tetrahedron, 2009, 65, 6104–6108 CrossRef CAS.
- H. H. Liu and Y. Chen, J. Mater. Chem., 2011, 21, 1246–1249 RSC.
- J. J. D. de Jong, L. N. Lucas, R. Hania, A. Pugzlys, R. M. Kellogg, B. L. Feringa, K. Duppen and J. H. van Esch, Eur. J. Org. Chem., 2003, 2003, 1887–1893 CrossRef.
- A. Takata, S. Yokojima, H. Nakagawa, Y. Matsuzawa, A. Murakami, S. Nakamura, M. Irie and K. Uchida, J. Phys. Org. Chem., 2007, 20, 998–1006 CrossRef CAS.
- A. Bianco, C. Bertarelli, J. F. Rabolt and G. Zerbi, Chem. Mater., 2005, 17, 869–874 CrossRef CAS.
- J. J. D. de Jong, W. R. Browne, M. Walko, L. N. Lucas, L. J. Barrett, J. J. McGarvey, J. H. van Esch and B. L. Feringa, Org. Biomol. Chem., 2006, 4, 2387–2392 RSC.
- M. Irie, Chem. Rev., 2000, 100, 1685–1716 CrossRef CAS PubMed.
- M. Herder, B. M. Schmidt, L. Grubert, M. Pätzel, J. Schwarz and S. Hecht, J. Am. Chem. Soc., 2015, 137, 2738–2747 CrossRef CAS PubMed.
- S. Fredrich, R. Göstl, M. Herder, L. Grubert and S. Hecht, Angew. Chem., Int. Ed., 2016, 55, 1208–1212 CrossRef CAS PubMed.
- F. K. Bruder, R. Hagen, T. Rölle, M. S. Weiser and T. Fäcke, Angew. Chem., Int. Ed., 2011, 50, 4552–4573 CrossRef CAS PubMed.
- M. Canepa, in Surface Science Technique, ed. G. Bracco and B. Holst, Springer-Verlag, Heidelberg, 2013, pp. 99–135 Search PubMed.
- S. Reichelt, C. Pruss and H. J. Tiziani, Proc. SPIE, 2002, 4778, 206–217 CrossRef.
- A. Bianco, G. Pariani, C. Bertarelli and F. M. Zerbi, Proc. SPIE, 2010, 7739, 77394P CrossRef.
Footnote |
| † Electronic supplementary information (ESI) available: IR spectra of two derivatives, trend of complex refractive index of two derivatives. See DOI: 10.1039/d0ra05535b |
| This journal is © The Royal Society of Chemistry 2020 |

