 Open Access Article
Corrosion behavior and mechanism of ductile iron with different degrees of deterioration of cement mortar lining in reclaimed water pipelines†
Yunhui Liua,
Yimei Tiana,
Rufang Zhanga,
Hao Guob,
Weigao Zhaoa and
Jianjun Huang *a
*a
aSchool of Environmental Science and Engineering, Tianjin University, Tianjin 300350, China. E-mail: hjj@tju.edu.cn
bThe Institute of Seawater Desalination and Multipurpose Utilization, MNR (Tianjin), Tianjin 300192, China
First published on 29th October 2020
Abstract
The deterioration of cement mortar lining (CML) has a significant impact on the corrosion of ductile iron pipes, and further affects the water quality of transported reclaimed water. In this study, the different coverage levels of CML (such as lined (100%), 90% and 50% lining coverage and unlined) were used for simulating different degrees of deterioration of CML. Electrochemical measurements, water quality testing and corrosion product microanalysis were carried out to monitor the corrosion process and investigate the corrosion mechanism. The results showed that the order of maximum corrosion rate under different conditions was: 50% lining coverage (0.159 mm a−1) > unlined (0.110 mm a−1) > 90% lining coverage (0.042 mm a−1) > 100% lining coverage (0.007 mm a−1). The complete lining can provide a higher pH to passivate the ductile iron to achieve perfect protection. When the damage of CML was very small, the self-healing of the lining can restore the protection ability to a great extent. The corrosion of the ductile iron with 50% lining was even more serious than the unlined ductile iron. The negative effect of the silicate dissolved from the lining on the crystal structure, growth and stabilization process of the corrosion products was considered to be the reason for the more acute corrosion of the pipeline with a large area lining spalling.
1. Introduction
Water shortage has always been a major problem to address and work for a possible solution.1 For this reason, many countries began to use more and more reclaimed water to alleviate the water-apply pressure.2–4 The ductile iron pipe with cement mortar lining (CML) was widely used as a water pipeline,5 and was also commonly used for the transportation of recycled water. CML can be used to passivate the metal surface by means of providing an alkaline environment after hydration. It acts as a physical barrier between the water flow and iron pipeline, and thus effectively reduces corrosion.6,7 In actual operation, cement mortar was gradually dissolved by water erosion or peeled off by external damage during installation and use, which was one of the important reasons for the lining failure and iron corrosion.8,9 As the degree of corrosion developed, the secondary pollution problem caused by the dissolution of the lining and iron corrosion of the reclaimed water pipe network often occurred. Therefore, it is important to explore the corrosion of ductile iron pipes with CML in reclaimed water. It plays an important role in ensuring the water quality and prolonging the service life of the reclaimed water pipeline network.At present, electrochemical technology has become one of the most commonly used techniques for studying metal corrosion and passivation.10–12 During the application of electrochemical technology in mortar metal systems, it was common to characterize the performance and corrosion of reinforced concrete structures in the construction field.13–15 In recent years, some scholars began to use electrochemical technology to study the corrosion of ductile iron pipelines with CML.
Sun and coworkers had analysed the passive behavior of ductile iron in a simulated cement-mortar pore solution by using open circuit potential (OCP), Tafel polarization curve (TP) and electrochemical impedance spectroscopy (EIS). Based on the published data, it can be said that passivation of the iron surface in SCM was enhanced in the high pH environment. On the contrary, the surface protection ability decreased at low pH due to the production of the corrosion morphology of rust with low Fe2+/Fe3+ ratio.16 Zou and coworkers had designed an accelerated corrosion test to investigate the corrosion behavior of the slag-cement-mortar-lined ductile iron pipe in flowing solutions (pure water, NH4NO3 solution and NH4Cl solution) through electrochemical measurements (TP and EIS) and microscopic analysis (SEM/EDS, XRD). It was found that the corrosion situation in the NH4Cl solution was the most severe.17 Song and coworkers systematically established three equivalent circuits for simulating different corrosion behaviors, and reported the electrochemical corrosion characteristics of reclaimed water in ductile iron pipes with CML. The results differentiated two corrosion phases: (a) passivation, and (b) initiation and propagation of corrosion.18
However, the research studies on the corrosion of ductile iron with CML are currently more concentrated on the tap water environment, and it is less considered in the reclaimed water environment. CML was found to be more easily eroded by reclaimed water due to the presence of higher anionic concentration than that in tap water.18,19 This increased the risk of exposure to the inner metal pipe, resulting in the deterioration of the water quality. Meanwhile, most of the studies focused on the influence of the water quality factors, such as pH and anions, on the corrosion of ductile iron with CML, and had not considered the effect caused by the spalling of the CML. Based on various studies, the metal corrosion reaction at the imperfections of its protective layer was more severe. Zhao and coworkers found that the corrosion behaviour of magnesium alloys was governed by a partially protective surface film, with the corrosion reactions occurring predominantly at the breaks or imperfections of the partially protective film.20 It was evident from the research of Shi and coworkers that the corrosion resistance of steel was negatively influenced by the defects at the steel-mortar interface. First, the passive films gradually lose their stability. Secondly, the chlorides were prone to accumulate in the defects and attack the passive films of steel.21 Similar phenomena were likely to occur for cast iron. Since the erosion of reclaimed water was much higher than that of normal tap water, it can inevitably cause greater iron corrosion damage at the spalling area of CML, and it was necessary to carry out relevant research.
Thus, the ductile iron specimen and electrodes with different CML coverage levels were designed to simulate the different deterioration degrees of the ductile iron pipe lining. A dynamic device was set up to simulate the reclaimed water transportation in the actual pipe. In addition, the original three-electrode electrolytic cell device was improved to ensure that it could maintain the same full-flow anaerobic state as the water supply network. Based on that, the main water quality indicators were tested during the operation, and the corrosion process of the cement mortar-ductile iron system was monitored with electrochemical measurements such as TP and EIS. Finally, the corrosion products were determined by SEM and XRD. The primary objective of this study was to investigate the interaction between the corrosion of the CML and the ductile iron, and then to extrapolate the corrosion mechanism of the ductile iron pipeline with different degrees of CML deterioration in reclaimed water on the basis of the analysis results.
2. Experimental
2.1 Materials
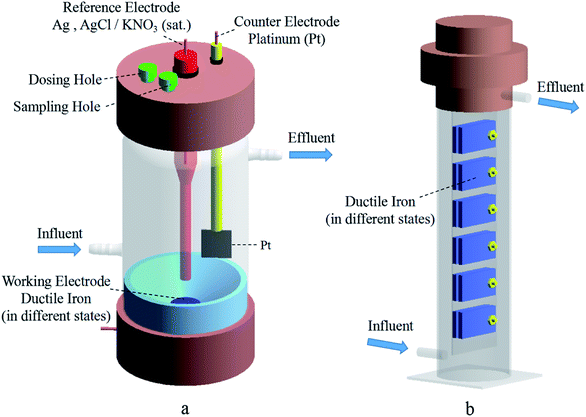
The reclaimed water used in the present study was obtained from a water reclamation plant in Tianjin, China. The water quality parameters are shown in Table 1. Fig. 1a shows the four types of specimens designed for the experiments. The ductile iron with 100% lining coverage was used to simulate a well-lined pipe, and the ductile iron with 90% and 50% lining coverage represented pipes with partial CML spalling and large-scale CML spalling, respectively. Peeling was usually caused by problems in production and installation, or damage by external forces during use. The unlined pipe was directly exposed ductile iron pipe without any coating. The dimensions for each ductile iron sheet (Jiangsu Yangzhou Xiangwei Machinery Co. Ltd., China) were length × width × thickness = (50.0 ± 0.1) mm × (25.0 ± 0.1) mm × (2.0 ± 0.1) mm. Its composition is shown in Table 2. The cement mortar was prepared with Ordinary Portland Cement (OPC, 42.5 N), and its thickness was 3 mm. The weight ratio of the materials was OPC![[thin space (1/6-em)]](https://www.rsc.org/images/entities/char_2009.gif) :
:![[thin space (1/6-em)]](https://www.rsc.org/images/entities/char_2009.gif) standard sand
standard sand![[thin space (1/6-em)]](https://www.rsc.org/images/entities/char_2009.gif) :
:![[thin space (1/6-em)]](https://www.rsc.org/images/entities/char_2009.gif) water = 1
water = 1![[thin space (1/6-em)]](https://www.rsc.org/images/entities/char_2009.gif) :
:![[thin space (1/6-em)]](https://www.rsc.org/images/entities/char_2009.gif) 1.5
1.5![[thin space (1/6-em)]](https://www.rsc.org/images/entities/char_2009.gif) :
:![[thin space (1/6-em)]](https://www.rsc.org/images/entities/char_2009.gif) 0.5. CMLs were coated in the same manner with molds to ensure their reproducibility. The cement mortar was cured in a humidity chamber maintaining 95% RH at temperature 20 ± 2 °C for 28 days. After that, the remaining parts of each specimen (except the reaction surface) were sealed with anhydrous silicone to eliminate interference.
0.5. CMLs were coated in the same manner with molds to ensure their reproducibility. The cement mortar was cured in a humidity chamber maintaining 95% RH at temperature 20 ± 2 °C for 28 days. After that, the remaining parts of each specimen (except the reaction surface) were sealed with anhydrous silicone to eliminate interference.
| Water quality | Value |
|---|---|
| pH | 8.33 ± 0.5 |
| DO (mg L−1) | 7.35 ± 0.5 |
| TDS (mg L−1) | 805 ± 12 |
| Conductivity (μs cm−1) | 1602 ± 70 |
| Turbidity (NTU) | 0.48 ± 0.2 |
| Hardness (mg L−1, as CaCO3) | 315 ± 15 |
| Alkalinity (mg L−1, as CaCO3) | 367.8 ± 11 |
| SiO32− (mg L−1) | 9.51 ± 0.2 |
| Cl− (mg L−1) | 271.4 ± 5 |
| SO42− (mg L−1) | 165.1 ± 5 |
| Fe (mg L−1) | 0.024 ± 0.002 |
| Temperature (°C) | 25 ± 1 |
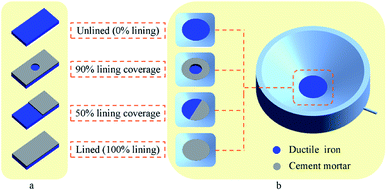 | ||
| Fig. 1 (a) Ductile iron specimens with different CML coverage levels. (b) Ductile iron electrodes with different CML coverage levels. | ||
| Element | C | Si | Mn | P | S | Fe |
| Wt (%) | 3.48 | 2.6 | 0.38 | 0.04 | 0.014 | 93.486 |
The composition of the ductile iron working electrodes used in the experiment was the same as that of the specimens. The diameter of the electrode disc was 2.0 cm. The electrodes were prepared with the same CML covering treatment, as shown in Fig. 1b.
2.2 Electrochemical corrosion experiment
The corrosion behavior and mechanism of the ductile iron with CML were studied by varying the lining coverage (lining deterioration) as an independent variable. Fig. 2 shows the three-electrode electrolytic cell and specimen-hanging device. The volume of the electrolytic cell was 250 mL, and the bottom of the cell was designed as an arc slope to reduce the erosion effect of the water flow on the working electrode.The dynamic simulation system for the corrosion of the reclaimed water pipe network was composed of a water tank (water source), a peristaltic pump, a electrolytic cell and a specimen hanging devices, as shown in Fig. S1 of ESI.† Each device was connected through a silicone tube with an inner diameter of 8 mm. Black Teflon film was used for shading to wrap the water tank, electrolytic cell and specimen hanging device. Furthermore, the reclaimed water was replaced regularly to simulate the pipe network flow update.
According to preliminary experiments, due to the unstable initial corrosion product film, the water quality and electrochemical reaction data fluctuated greatly after water source update. The system had been operated for 15 days with reclaimed water to reach a more stable state before the formal experiment started. The electrochemical corrosion experiment lasted for 75 days.
2.3 Measurement methods
During the simulation study period, regular water quality monitoring was performed. All electrochemical measurements were carried out on a CS350 electrochemical working station (Wuhan Corrtest Instruments Corp., Ltd., China). In this study, polarization curve tests were conducted in the voltage range of −0.07 V–0.07 V around the open-circuit potential with a scan rate of 0.5 mV s−1 during which the OCP was steady. Electrochemical impedance spectra (EIS) measurements were performed in the frequency range of 100 kHz to 10 mHz with an amplitude of 10 mV. EIS was performed on the steady-state open circuit potential (OCP), which was recorded before measurement. The stabilization time of OCP was more than half an hour, and its change range did not exceed 1 mV. The obtained impedance spectra were fitted to the equivalent circuit models through the ZSimpWin 3.60 software.Furthermore, the specimens were collected for the microcosmic test. After vacuum freeze drying for 24 h, the corrosion scale of the specimens was examined by a HITACHIS-4800 field emission scanning electron microscope (SEM, Hitachi Co., Japan) for the surface corrosion morphology, and inspected by the energy dispersive spectrometer (EDS) for the element composition. Afterwards, the crystal structure was analyzed by X-ray diffraction (XRD, D/MAX-2500, Rigaku Co., Japan) with a scanning speed of 5° min−1 and scanning range of 10°–90°.
3. Results and discussion
3.1 Electrochemical analysis of the corrosion process
Th polarization curves shown in Fig. 3 were obtained through the dynamic potential scanning test. Table S1† in ESI reported the corrosion current density and Tafel slopes of ductile iron with different CML coverage levels. It was found that the slope of the anodic polarization curve (βa) of the lined ductile iron was much larger than that of the cathodic polarization curve (βc). This showed that its corrosion process was controlled by an anode reaction. For the other three ductile irons with lining coverage, βa and βc were not much different, indicating that the cathode and anode reactions both had a significant effect on the corrosion rate.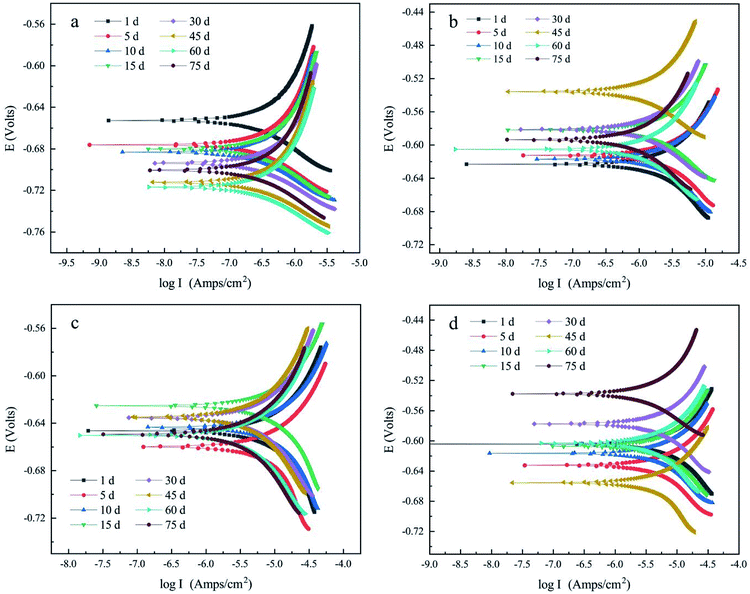 | ||
| Fig. 3 Polarization curve of (a) lined ductile iron (100% lining), (b) ductile iron with 90% lining, (c) ductile iron with 50% lining and (d) unlined ductile iron. | ||
The corrosion current density, icorr, was obtained by extrapolating the cathode and anode polarization curves to their intersection points. The corrosion rate, v, was calculated by the equation below based on Faraday's law (eqn (1)) with reference to relevant studies.11
| v = 3.27 × 10⁻³icorrM/(nρ) | (1) |
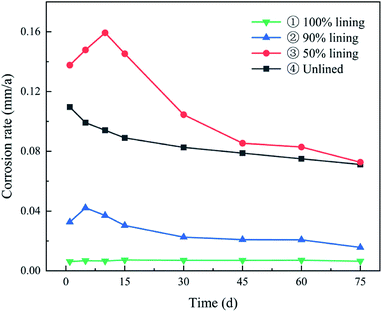
The ductile iron with different levels of lining was compared based on the corrosion rate and found to be in the order of ③ > ④ > ② > ①, as can be seen from Fig. 4. The electrochemical corrosion was the most serious under the condition of 50% CML lining coverage, and its maximum corrosion rate was 0.159 mm a−1. It was about 1.45 times that of the unlined electrode (0.110 mm a−1), 3.78 times that of the electrode with 90% lining (0.042 mm a−1), and 22 times that of the completely lined electrode (0.007 mm a−1). It was evident from the results that with the rising degree of lining deterioration, an overall upward trend of the corrosion was observed. In particular, when the CML of the ductile iron pipe was damaged to a large extent, the corrosion was even more serious than that of the unlined pipe. This indicated that when the deterioration of CML reached a certain level (>50%), the damaged CML instead promoted the corrosion of ductile iron. The defects at the steel-mortar interface also played significantly in influencing the corrosion behavior of steel negatively, as supported by previous researchers.21 The corrosion reaction rate of electrode ① had been extremely low with the good protective coverage of the intact CML. The corrosion rate of electrode ② and electrode ③ both increased first, and then decreased. This was because the bare metal surface of the electrode was covered by a dense corrosion product film as the reaction proceeded, which gradually hindered the further dissolution of the anode and the diffusion of the depolarizer to the cathode, so the reaction rate tended to be stable.
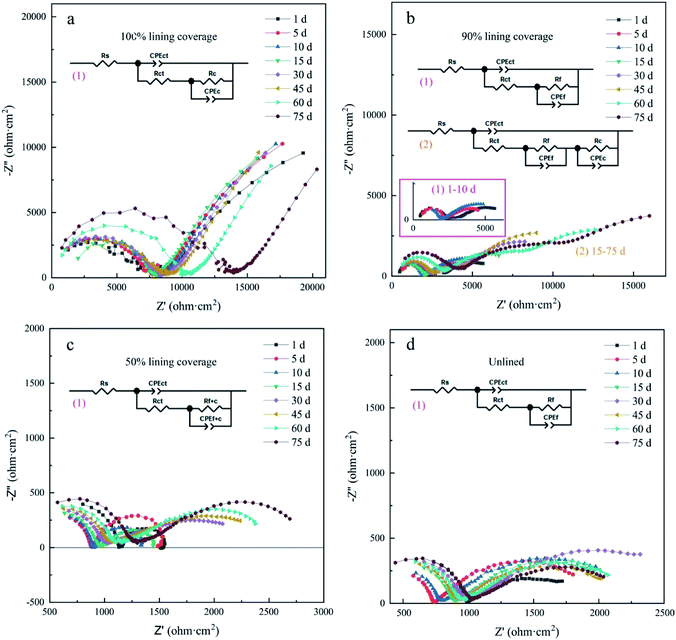
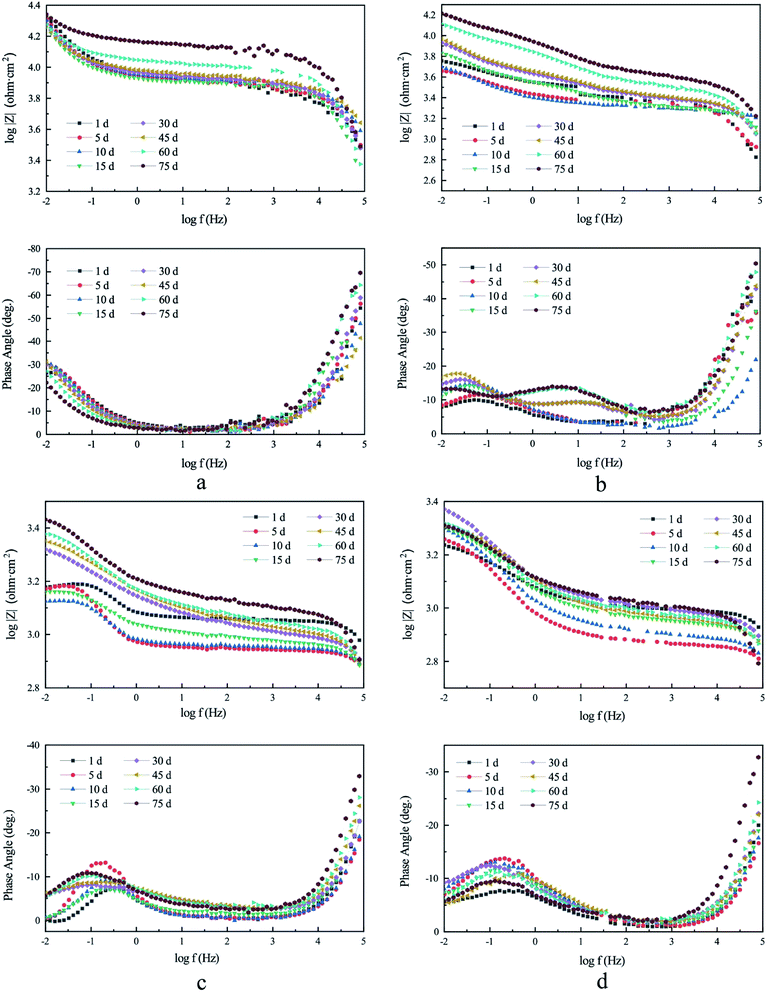
The AC impedance Nyquist diagram and Bode diagram of the four electrodes are shown in Fig. 5 and 6, respectively. Two electrical circuit models (ECM) were used to simulate them according to their characteristics.22,23 The OCP data are shown in Table S2,† and the fitting results are shown in Table S3 to S6 of ESI.†
In ECM(1) and ECM(2), Rs is the solution resistance, Rct is the charge transfer resistance, Rf is the corrosion product film resistance, Rc is the CML resistance, and Rf+c is the resistance of the mixed lining layer composed of the corrosion product film and CML. The constant phase angle element (CPE) was used to replace the capacitive element in ECM because the complex plane impedance contained a ‘depressed’ semicircle, indicating that the dispersion effect occurred in the corrosion process.24–26 CPEct is the electric double layer capacitance of the electrode, CPEf is the capacitance of the iron oxide film and CPEc is the capacitance of CML, while CPEf+c is the capacitance of the mixed lining layer. nct, nc, nf and nf+c are their dispersion effect coefficients, respectively.
In the initial phase of the experiment (1–5 days), the water exchange before the formal experiment was causing the sudden decrease of the radius of the capacitive arc, and of the modulus and phase angle on the Bode diagram. This was due to the disturbance in the corrosion product film. However, it did not affect the overall trend.
According to the experiment results of electrode ① (lined ductile iron), the Nyquist plots were composed of a capacitive arc in each of the high- and low-frequency regions, as shown in Fig. 5a. This can be explained by relating the low frequency arc with the metal corrosion product film formed on the electrode surface, the high frequency arc with the charge transfer process, and the radius of the arc with the resistance of transfer.27 The maximum Rc value of its ECM reached 86![[thin space (1/6-em)]](https://www.rsc.org/images/entities/char_2009.gif) 901 Ω cm2, and it was always significantly higher than Rct (ESI Table S3†), indicating that the protective effect of the lining was extremely good. This was attributed to the reclaimed water penetrating the interior of CML, and forming a highly alkaline environment between the metal surface and the lining. Then, the ductile iron was gradually passivated,16 which was consistent with the result of the polarization curve. The corrosion process of electrode ① was controlled by the anode all the time, which indicated that the passivation state of the ductile iron electrode surface had been maintained. The SiO32− dissolved from the CML also helped to form a uniform passive film, and played an important role in improving the barrier effect of the iron surface.28 Therefore, the process of electron loss in ductile iron was the determining step of corrosion under the barrier of the lining. Additionally, the Bode plot (Fig. 6a) showed that its capacitive arcs always maintained large slopes in the high- and low-frequency regions. It also proved that the complete cement mortar lining had a good protection effect by maintaining the passive state of the ductile iron surface the entire time.17
901 Ω cm2, and it was always significantly higher than Rct (ESI Table S3†), indicating that the protective effect of the lining was extremely good. This was attributed to the reclaimed water penetrating the interior of CML, and forming a highly alkaline environment between the metal surface and the lining. Then, the ductile iron was gradually passivated,16 which was consistent with the result of the polarization curve. The corrosion process of electrode ① was controlled by the anode all the time, which indicated that the passivation state of the ductile iron electrode surface had been maintained. The SiO32− dissolved from the CML also helped to form a uniform passive film, and played an important role in improving the barrier effect of the iron surface.28 Therefore, the process of electron loss in ductile iron was the determining step of corrosion under the barrier of the lining. Additionally, the Bode plot (Fig. 6a) showed that its capacitive arcs always maintained large slopes in the high- and low-frequency regions. It also proved that the complete cement mortar lining had a good protection effect by maintaining the passive state of the ductile iron surface the entire time.17
According to the experimental results of electrode ② (ductile iron with 90% lining) as shown in Fig. 5b, the Nyquist plot was composed of a capacitive reactance arc in the high- and low-frequency regions individually during 1–10 d. After it rose for 10 days, Rf was about 4700 Ω cm2 (ESI Table S4†). This reflected that the partially exposed metal had been covered by a stable corrosion product film. Electrode ② had three capacitive reactance arcs from the 15th day. This indicated that the corrosion products and CML were no longer only at the same horizontal interface, but were stacked vertically in some areas. This was probably due to the self-healing ability of the cement mortar lining. Previous studies have shown that Ca2+ dissolved from cementitious materials can react with CO32− or HCO3− in the solution to form CaCO3 precipitation.29 Furthermore, the small damage can be self-healed by the recrystallization of calcite.30,31 In this experiment, the CML damaged part of electrode ② was only 10%, and the exposed area of the ductile iron was very small. The CaCO3 formed after the cement mortar dissolved was likely to interpenetrate with the outer layer of the corrosion products, and combine to form a new lining there. According to the ECM fitting result, the maximum resistance of the new lining reached about 25![[thin space (1/6-em)]](https://www.rsc.org/images/entities/char_2009.gif) 000 Ω cm2. This proved that when the damage of the lining was tiny, the self-healing of CML could fill the defects, and the protection effect was restored to some extent. Combined with the result of the polarization curve, the cathode and anode both had a significant effect on the reaction rate of electrode ②. Consequently, its corrosion control step was different from that of electrode ①. The loss of electrons in iron was no longer the main resistance. In the whole reaction, the sum of Rf and Rc was always larger than Rct. It revealed that the mass transport process became the control step, and the diffusion of oxygen was the rate-determining step of the reaction.
000 Ω cm2. This proved that when the damage of the lining was tiny, the self-healing of CML could fill the defects, and the protection effect was restored to some extent. Combined with the result of the polarization curve, the cathode and anode both had a significant effect on the reaction rate of electrode ②. Consequently, its corrosion control step was different from that of electrode ①. The loss of electrons in iron was no longer the main resistance. In the whole reaction, the sum of Rf and Rc was always larger than Rct. It revealed that the mass transport process became the control step, and the diffusion of oxygen was the rate-determining step of the reaction.
According to the experimental results of electrode ③ (ductile iron with 50% lining) and electrode ④ (unlined ductile iron), their Nyquist plots (Fig. 5c and d) were composed of two capacitive arcs, indicating that there were two time constants in the reaction. Similar to electrode ②, the polarization curve analysis showed that the corrosion reactions of electrode ③ and ④ were controlled by both cathode and anode. For electrode ③, the Rf+c value had increased dramatically from days 10–15, and then gradually stabilized to about 2200 Ω cm2. Its CPEf+c also decreased significantly at the same time. The radius of the arc in the low-frequency region of the Nyquist plot increased in response, and it was larger than the radius of the arc in the high-frequency region after 10 days. Correspondingly, the value of Rf+c then became larger than Rct (ESI Table S5†). This indicated that the mass transport replaced the charge transfer, and became the control step in the later stage of the reaction. For electrode ④, the Rf value increased and stabilized to about 1600 Ω cm2, and was always larger than the Rct value. Therefore, the inhibition of the corrosion product film on the mass transport process was the main obstacle to the reaction. In addition, the diffusion of oxygen through the corrosion product film was the rate-determining step of the reaction. The CPEf value of electrode ④ showed a general decreasing trend concurrently with the increase of Rf (ESI, Table S6†). It was evident from the results that the film thickness of the corrosion product had been enhanced, and finally reached an essentially steady state.32
Compared with electrode ④, the initial oxide film resistance of electrode ③ was lower. This meant that the corrosion product film of electrode ③ was looser and had poorer protection against corrosion. Accordingly, the corrosion rate of ductile iron with 50% lining had a larger increase in the corrosion rate than that of the unlined one during 1–10 d (Fig. 4). However, 15 days later, the Rf+c value of electrode ③ rose rapidly to about 2000 Ω cm2, and the hindrance to the reaction was greatly strengthened, so the corrosion rate was affected and obviously reduced. The Rf value of electrode ④ just rose slowly, so the corrosion rate gradually decreased from the beginning.
The EIS results showed that compared with electrodes ① and ②, the maximum phase angle and the impedance in the Bode plots of electrodes ③ and ④ were smaller (Fig. 6). It also confirmed that the protective effect of the corrosion product film was much poorer than that of CML. This also resulted in the corrosion rate of electrodes ③ and ④ being much higher than that of electrodes ① and ② after it was stable (Fig. 4).
The values of the polarization resistance (Rp) calculated by the polarization curve measurement and EIS are shown in Table S7 of ESI.† The Rp values of the lined ductile iron and ductile iron with 90% lining kept rising during the experiment. In contrast, the Rp of ductile iron with 50% lining and unlined ductile iron increased to a stable value after 45 days in general, and their maximum values were much smaller than the two with the larger lining coverage. This proved that the CML had a much stronger protection than the dense corrosion products.
It was also found that the difference value between the two methods increased when the electrode surface was covered with a high impedance layer. This was because there was no obvious Tafel zone in the polarization curve when the ductile iron was passivated or the mass transfer resistance was very strong. Thus, the Rp based on the Tafel zone fitting had a large error. In contrast, EIS was not affected by the high impedance layer. Thus, the value of Rp fitted with the EIS data was more accurate than with the polarization curve.
3.2 Variations in the water quality
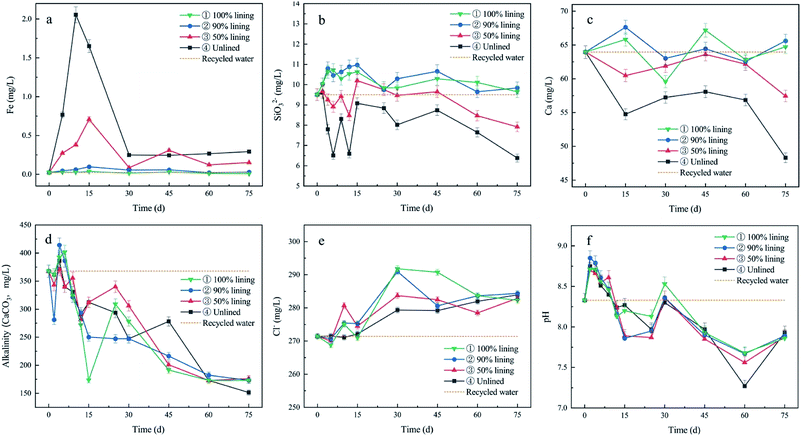
The change trend was not affected by the fluctuation of the water quality caused by the time and frequency of the water source update, and the sampling in the early stage of the experiment.Fig. 7a shows that the soluble iron of the devices increased in the initial stage, except the one with the well-lined ductile iron. The growth of Fe was higher with a more unlined area, which was due to the continuous dissolution of the ductile iron. Afterward, the soluble iron content decreased and then the same remained unchanged. This signified the dense accumulation of the corrosion products in the reaction, and the inhibition of further corrosion of the iron. Among them, the Fe concentrations of devices ③ and ④ were still higher than that of the reclaimed water in the later period. This proved that the corrosion reaction continued at most of the lining degradation stage, which is the same as the unlined ductile iron.
Fig. 7b shows that the concentration of silicate increased in devices ③ and ④ with SiO32− continuously dissolved out of the lining, and finally approached the reclaimed water. On the contrary, a decrease in the silicate concentration with varying magnitude was observed in the devices, which were due to the adsorption of silicate by iron corrosion products.33,34 However, it was not clear whether a complex of Fe and silicate was formed.
According to Fig. 7c and d, the Ca2+ and alkalinity in the water were continuously consumed as the reaction proceeded, which was caused by the generation of CaCO3 precipitation. However, the specimens of CML also dissolved Ca2+ into water. So, the concentration of Ca2+ in their devices was not reduced compared to the uncoated ductile iron.
According to Fig. 7e, the Cl− concentration in all four devices increased and then stabilized. This was mainly because CML was prepared with tap water, Portland cement and quartz sand, and the original chloride ion in the tap water was also incorporated. When the lining gradually dissolved, this part of the chloride ions came into contact with the water part of the device. The existence of Cl− easily aggravated the iron corrosion,35,36 so it was necessary to pay attention to the dissolution of Cl− in the actual pipeline.
According to Fig. 7f, it was a fluctuated downward tent after the initial rise of the pH value in the four devices. It was evident that the consumption of OH− in the corrosion system had been persistently taking place. Although the dissolution of alkaline substances (such as Ca(OH)2 from the lining) was taking place, more OH− was needed to form the corrosion products.
3.3 Micro analysis of corrosion products
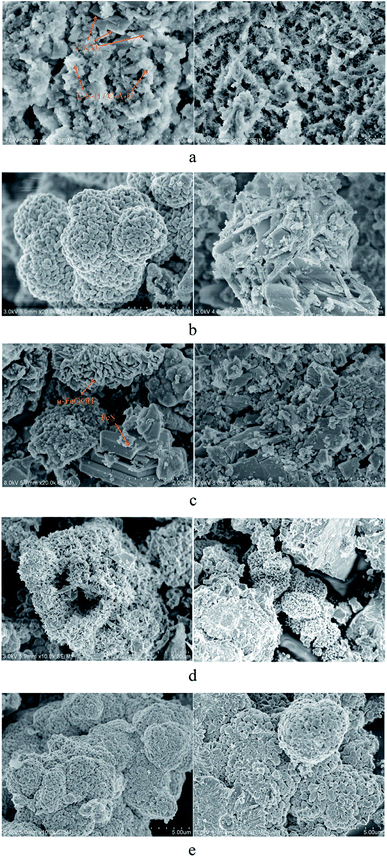
The microscopic morphology of the four kinds of ductile iron with different CML coverage levels is shown in Fig. 8. For the ductile iron with 50% lining, the corrosion products at the exposed part of the iron and the interface between the iron and cement mortar were tested by SEM. The corrosion products on the surface of the ductile iron were also scraped for XRD analysis, and the results are shown in Fig. 9.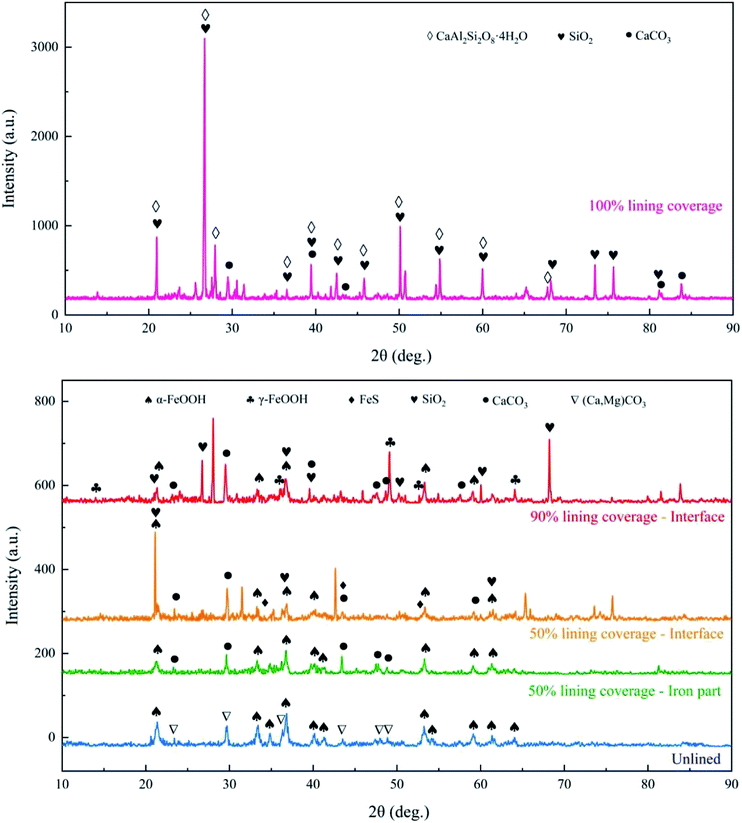 | ||
| Fig. 9 XRD pattern of the corrosion products from ductile iron with different cement mortar lining coverage on day 75. | ||
As shown in Fig. 8a, the square flakes and prisms were found on the surface of the lined ductile iron, and they were CaCO3 as confirmed by other researchers.37,38 In addition, there were flocculent substances. SiO2 and CaAl2Si2O8·4H2O (CASH) were present, as confirmed from the XRD analysis results. CASH had also been detected in the corrosion research of the slag cement mortar, and was a hydrate gel of the cement mortar.17 Furthermore, the SEM results clearly showed that the surface of the lining became irregular as the calcium dissolved, and the structure was gradually loosened, which had been initially eroded.
As shown in Fig. 8b, the corrosion products from the interface of ductile iron with 90% lining were mainly α-FeOOH, and some sheet γ-FeOOH interspersed together.39,40 Based on the results of XRD, the spherical substance scattered on the surface may be spherical CaCO3. This also supported the result that CaCO3 penetrated and combined with the outer layer corrosion products to form a new lining. SiO2 was also found in both corrosion products by XRD. That is because the adhesion of CML decreased with the mortar dissolution, which made the quartz sand easy to peel.
In addition to the obvious α-FeOOH structure at the interface of the ductile iron with 50% lining, a stacked sheet structure was observed, as can be seen from Fig. 8c. It was recognized as FeS from the XRD results.41 The crack-like irregular square and prismatic shapes substance that can be seen from Fig. 8c was supposed to be CaCO3.
Fig. 8d and e show the iron corrosion products of the unlined ductile iron and ductile iron with 50% lining, respectively. There were a large number of gathered usual acicular or rod-like shape structures. Combining the XRD results, the main product was α-FeOOH. It can be observed that the α-FeOOH in Fig. 8e was denser, while the α-FeOOH crystals in Fig. 8d were finer, and there were many holes or gaps left after crystal aggregation. The reason for this difference was probably due to the large amount of dissolved silicate at the corrosion reaction interface of ductile iron with 50% lining coverage. Previous research found that silicon has a negative effect on the local structure and morphology of the ferric hydroxides formed by corrosion, resulting in α-FeOOH with poor crystallinity.42–45
In addition, a small amount of (Ca,Mg)CO3 (calcite, magnesian) was found in the corrosion products of the unlined ductile iron by XRD, which was generated by the reaction of Ca2+, Mg2+ and bicarbonate in the reclaimed water near the electrode. CaCO3 was also present on the surface of the 50% lining spalling ductile iron, which was mainly precipitated by the dissolved Ca2+ in the high-alkaline recycled water, and finally adhered to the corrosion product film.
In the early stage of corrosion, the exposed iron quickly dissolved (eqn (2)), and the dissolved oxygen (DO) in the water gained electrons. After the redox reaction, Fe(OH)2 was formed46 (eqn (3)). Since Fe(OH)2 was extremely unstable, it was further oxidized as γ-FeOOH12 (eqn (4)). Finally, some of γ-FeOOH could transform into a more stable α-FeOOH47 (eqn (5)).
 | (2) |
 | (3) |
 | (4) |
 | (5) |
At the same time, Fe2+ was also converted into ferrihydrite (eqn (6)). Due to the metastable property of ferrihydrite, it has usually been seen as a precursor of α-FeOOH48 (eqn (7)).
 | (6) |
 | (7) |
According to the existing research, the increase of dissolved silicate concentration gradually hindered the oxidation of Fe(II) in neutral solution. In the corrosion reaction, Fe(II) can be adsorbed by corrosion products and catalyze the conversion of ferrihydrite to more thermodynamically stable oxyhydroxide.49–51 Handler et al. and Pedersen et al. used the isotope tracer method to prove that Fe(II) can catalyze the reductive dissolution of Fe atoms initially bound within an Fe oxide.52,53 Then, its secondary mineralization was promoted into a more stable structure, such as goethite, through Ostwald ripening.54 However, compared with the unlined ductile iron, ductile iron with 50% lining dissolved a lot of silicate. The adsorption of silicate by iron corrosion products inhibited the direct adsorption of Fe(II) onto the mineral surface.55 In addition, Si also prevented recrystallisation into a more stable iron corrosion product to a certain extent because of its ability to inhibit the polymerisation of thermodynamically stable Fe(III) minerals.56 So, silicate also increased the oxidation time of the precursor to goethite, and had a certain degree of inhibition on the growth of the goethite particles.42,57
The inhibitory effect of silicate can also explain the difference of the corrosion rate between the ductile iron with 50% lining and the ductile iron with other lining coverage, as shown in Fig. 4. For the lined ductile iron, the XRD results showed that the dissolution of CML resulted in the gradual exposure of the hydrate gel and quartz sand. Although the regularity and compactness of CML became worse, the protective effect on the ductile iron did not fail, so the corrosion rate had been maintained at an extremely low level. For the ductile iron with 90% lining, the deterioration area of CML was very small and it can achieve self-healing. Therefore, the rise and decline process of the corrosion rate took a short time. The variation of the corrosion rate was not large, and it quickly stabilized. The difference in the form of the corrosion products was the main reason for the discrepancy in the corrosion rate of the unlined ductile iron and ductile iron with 50% lining. Due to the deterioration of the lining to a greater extent, the higher concentration of silicate had sufficient opportunity to contact the exposed iron in a large area. The presence of silicate not only weakened the catalytic effect of Fe(II) on the conversion of ferrihydrite to goethite and other stable products,55,58 but also made the goethite particles smaller and the corrosion products looser.44,45 In this case, the iron oxide film had poor protection towards corrosion. The reclaimed water had a better opportunity to infiltrate from the gap that was formed. The unstable product film was also susceptible to changes in water conservancy and water quality conditions, so it was easy to peel by water flow. As a result, the corrosion rate had a longer rise time and a greater increase when most of the lining peeled off. That was why pipes with damaged lining were sometimes even more vulnerable to corrosion than unlined pipes.
However, the loose corrosion products also provided more adsorption sites, which could adsorb more Fe(II), thus accelerating the growth of the corrosion product film in the later stage of corrosion. This was probably the reason why the corrosion rate of the ductile iron with 50% lining decreased faster than the unlined ductile iron.
4. Conclusions
This study focused on the corrosion behavior of the ductile iron with different degrees of deterioration of cement mortar lining (① 100% lining coverage, ② 90% lining coverage, ③ 50% lining coverage, ④ unlined) in reclaimed water pipelines. The results showed that:(1) Analysis of the polarization curve showed that the order of the maximum corrosion rate under different conditions was: ③ (0.159 mm a−1) > ④ (0.110 mm a−1) > ② (0.042 mm a−1) > ① (0.007 mm a−1). The corrosion was most severe when the lining deteriorated to a large area, and it was even more serious than the unlined ductile iron.
(2) The results of the EIS and polarization curve showed that when the lining was intact (ductile iron ①), the corrosion process was controlled by the anode reaction. CML provided a high pH environment for the ductile iron and kept the iron in a passivated state, so as to achieve the effect of corrosion prevention.
When the damage of the lining was tiny (ductile iron ②), the corrosion products and CML were stacked vertically in some areas. It indicated that the lining with little defects would also provide good protection through the CML self-healing ability.
According to the ECM fitting data, in the early stages of corrosion, the corrosion product film of the ductile iron with a large area lining spalling (ductile iron ③) was looser than that of the unlined ductile iron (ductile iron ④), and its resistance was smaller.
(3) Analysis of SEM and XRD also proved that the α-FeOOH crystals caused by the corrosion of ductile iron ③ were finer than ductile iron ④, and the overall structure of the corrosion product film was looser. So, the ductile iron with a large area of lining spalling failed to get better impact resistance and isolation capability, resulting in bad protection. This situation was largely due to the competitive adsorption between silicate and Fe(II). Silicate weakened the catalytic effect of Fe(II) on the conversion of ferrihydrite into stable products, and deteriorated the morphology of the α-FeOOH particles.
Conflicts of interest
There are no conflicts to declare.Acknowledgements
This work was supported by the National Natural Science Foundation of China (No. 51478307).Notes and references
- S. X. Deng, X. T. Yan, Q. Q. Zhu and C. Y. Liao, The utilization of reclaimed water: Possible risks arising from waterborne contaminants, Environ. Pollut., 2019, 254 CrossRef CAS.
- Y. Du, X.-T. Lv, Q.-Y. Wu, D.-Y. Zhang, Y.-T. Zhou, L. Peng and H.-Y. Hu, Formation and control of disinfection byproducts and toxicity during reclaimed water chlorination: A review, J. Environ. Sci., 2017, 58, 51–63 CrossRef.
- Z. Zhu and J. Dou, Current status of reclaimed water in china: An overview, IDA J. Desalination Water Reuse, 2018, 8, 293–307 CrossRef.
- D. P. Liu, C. Rong, J. T. Jin, S. C. Liang and J. S. Zhang, Characteristics of biofilm community structure in a reclaimed water cast iron pipeline, J. Environ. Sci. Water Resour., 2018, 4, 1489–1500 RSC.
- G. Smith and R. Mielke, Large-diameter transmission pipeline corrosion control state-of-the-art: advances in the steel water pipe industry, Fort Worth, TX, 2013, DOI:10.1061/9780784413012.004.
- D. L. McPherson, Analysis of cement mortar lining in the presence of hydrodynamic loading, Portland, OR, 2014, DOI:10.1061/9780784413692.152.
- D. J. Robert, R. Jiang, P. Rajeev and J. Kodikara, Contribution of Cement Mortar Lining to Structural Capacity of Cast Iron Water Mains, ACI Mater. J., 2016, 113, 295–306 Search PubMed.
- Y. Gao, Y. Zhang and Q. Bi, Investigation of the Leaching Behavior of Mortar Pipe Lining in Drinking Water, J. Wuhan Univ. Technol.-Materials Sci. Ed., 2010, 25, 893–896 CrossRef CAS.
- V. Nguyen, C. White and H. Jefferson, Field Trial: inspection of cement mortar lined ductile iron pipe, Portland, OR, 2014, DOI:10.1061/9780784413692.019.
- H. Sun, H. Wang, H. Wang and Q. Yan, Enhanced removal of heavy metals from electroplating wastewater through electrocoagulation using carboxymethyl chitosan as corrosion inhibitor for steel anode, J. Environ. Sci. Water Resour., 2018, 4, 1105–1113 RSC.
- H. Tong, X. Hu, P. Zhao, H. Zhang and Y. Tian, Iron Corrosion in Occluded Water in Drinking Water Distribution Systems, Int. J. Electrochem. Sci., 2019, 14, 10213–10226 CrossRef CAS.
- H. Zhang, L. Zhao, D. Liu, J. Wang, X. Zhang and C. Chen, Early period corrosion and scaling characteristics of ductile iron pipe for ground water supply with sodium hypochlorite disinfection, Water Res., 2020, 176 CAS.
- K. Doi, S. Hiromoto, H. Katayama and E. Akiyama, Effects of Oxygen Pressure and Chloride Ion Concentration on Corrosion of Iron in Mortar Exposed to Pressurized Humid Oxygen Gas, J. Electrochem. Soc., 2018, 165, C582–C589 CrossRef CAS.
- M. Sanchez, J. Gregori, C. Alonso, J. J. Garcia-Jareno, H. Takenouti and F. Vicente, Electrochemical impedance spectroscopy for studying passive layers on steel rebars immersed in alkaline solutions simulating concrete pores, Electrochim. Acta, 2007, 52, 7634–7641 CrossRef CAS.
- J. Shi, W. Sun, J. Jiang and Y. Zhang, Influence of chloride concentration and pre-passivation on the pitting corrosion resistance of low-alloy reinforcing steel in simulated concrete pore solution, Construct. Build. Mater., 2016, 111, 805–813 CrossRef CAS.
- X.-H. Sun, X.-B. Zuo, G.-J. Yin, K. Jiang and Y.-J. Tang, Electrochemical and microscopic investigation on passive behavior of ductile iron in simulated cement-mortar pore solution, Construct. Build. Mater., 2017, 150, 703–713 CrossRef CAS.
- S. Zou, X.-B. Zuo, A. F. a. Abubakar, S.-L. He and W.-Y. Huang, Experimental investigation on corrosion behavior of slag-cement-mortar-lined ductile iron pipe in flowing solutions, Construct. Build. Mater., 2018, 193, 1–12 CrossRef CAS.
- Y. Song, Y. Tian, X. Zhao, H. Guo and H. Zhang, Corrosion Process of Ductile Iron with Cement Mortar Linings as Coatings in Reclaimed Water, Int. J. Electrochem. Sci., 2016, 11, 7031–7047 CrossRef CAS.
- P. Jjemba, W. Johnson, Z. Bukhari and M. LeChevallier, Review of the leading challenges in maintaining reclaimed water quality during storage and distribution, IDA J. Desalination Water Reuse, 2014, 4, 209–237 CrossRef CAS.
- M.-C. Zhao, M. Liu, G.-L. Song and A. Atrens, Influence of pH and chloride ion concentration on the corrosion of Mg alloy ZE41, Corros. Sci., 2008, 50, 3168–3178 CrossRef CAS.
- J. Shi and J. Ming, Influence of defects at the steel-mortar interface on the corrosion behavior of steel, Construct. Build. Mater., 2017, 136, 118–125 CrossRef CAS.
- A. Hernandez-Espejel, M. A. Dominguez-Crespo, R. Cabrera-Sierra, C. Rodriguez-Meneses and E. M. Arce-Estrada, Investigations of corrosion films formed on API-X52 pipeline steel in acid sour media, Corros. Sci., 2010, 52, 2258–2267 CrossRef CAS.
- C.-Q. Ye, R.-G. Hu, S.-G. Dong, X.-J. Zhang, R.-Q. Hou, R.-G. Du, C.-J. Lin and J.-S. Pan, EIS analysis on chloride-induced corrosion behavior of reinforcement steel in simulated carbonated concrete pore solutions, J. Electroanal. Chem., 2013, 688, 275–281 CrossRef CAS.
- M. D. D. Ayagou, G. R. Joshi, T. M. T. Thi, B. Tribollet, E. Sutter, C. Mendibide, C. Duret-Thual and J. Kittel, Impact of oxygen contamination on the electrochemical impedance spectroscopy of iron corrosion in H2S solutions, Corros. Sci., 2020, 164 Search PubMed.
- I. M. Gadala and A. Alfantazi, A study of X100 pipeline steel passivation in mildly alkaline bicarbonate solutions using electrochemical impedance spectroscopy under potentiodynamic conditions and Mott-Schottky, Appl. Surf. Sci., 2015, 357, 356–368 CrossRef CAS.
- M. S. Morad, An electrochemical study on the inhibiting action of some organic phosphonium compounds on the corrosion of mild steel in aerated acid solutions, Corros. Sci., 2000, 42, 1307–1326 CrossRef CAS.
- Y.-W. Choi, S. Shin, D.-W. Park and J. Choi, Surface treatment of iron by electrochemical oxidation and subsequent annealing for the improvement of anti-corrosive properties, Curr. Appl. Phys., 2014, 14, 641–648 CrossRef.
- T. Li, G. K. Huang, Y. P. Feng, M. Yang, L. Y. Wang, D. Q. Cui and X. Zhang, Effects of Different Ions and Temperature on Corrosion Behavior of Pure Iron in Anoxic Simulated Groundwater, Materials, 2020, 13 Search PubMed.
- S. Qian, J. Zhou, M. R. de Rooij, E. Schlangen, G. Ye and K. van Breugel, Self-healing behavior of strain hardening cementitious composites incorporating local waste materials, Cement Concr. Compos., 2009, 31, 613–621 CrossRef CAS.
- H. W. Reinhardt and M. Jooss, Permeability and self-healing of cracked concrete as a function of temperature and crack width, Cement Concr. Res., 2003, 33, 981–985 CrossRef CAS.
- P. Sarin, V. L. Snoeyink, D. A. Lytle and W. M. Kriven, Iron corrosion scales: Model for scale growth, iron release, and colored water formation, J. Environ. Eng., 2004, 130, 364–373 CrossRef CAS.
- Y. J. Zhang, C. W. Yan, F. H. Wang and W. F. Li, Electrochemical behavior of anodized Mg alloy AZ91D in chloride containing aqueous solution, Corros. Sci., 2005, 47, 2816–2831 CrossRef CAS.
- L. Dyer, P. D. Fawell, O. M. G. Newman and W. R. Richmond, Synthesis and characterisation of ferrihydrite/silica co-precipitates, J. Colloid Interface Sci., 2010, 348, 65–70 CrossRef CAS.
- P. Kraal, C. M. van Genuchten, T. Behrends and A. L. Rose, Sorption of phosphate and silicate alters dissolution kinetics of poorly crystalline iron (oxyhydr)oxide, Chemosphere, 2019, 234, 690–701 CrossRef CAS.
- E.-S. M. Sherif, R. M. Erasmus and J. D. Comins, In situ Raman spectroscopy and electrochemical techniques for studying corrosion and corrosion inhibition of iron in sodium chloride solutions, Electrochim. Acta, 2010, 55, 3657–3663 CrossRef CAS.
- Y. Song, E. Wightman, Y. Tian, K. Jack, X. Li, H. Zhong, P. L. Bond, Z. Yuan and G. Jiang, Corrosion of reinforcing steel in concrete sewers, Sci. Total Environ., 2019, 649, 739–748 CrossRef CAS.
- A. Rodriguez, S. Gutierrez-Gonzalez, M. I. Prieto, A. Cobo and V. Calderon, Analysis of long-term corrosion behavior in mortars containing recycled ladle furnace slag using computerized tomography and SEM, Mater. Corros., 2015, 66, 199–205 CrossRef CAS.
- Q. Ye, C. Shen, S. Sun, R. Chen and H. Song, The sulfate corrosion resistance behavior of slag cement mortar, Construct. Build. Mater., 2014, 71, 202–209 CrossRef.
- Y. Cui, S. Liu, K. Smith, K. Yu, H. Hu, W. Jiang and Y. Li, Characterization of corrosion scale formed on stainless steel delivery pipe for reclaimed water treatment, Water Res., 2016, 88, 816–825 CrossRef CAS.
- H. Liu, K. D. Schonberger, C.-Y. Peng, J. F. Ferguson, E. Desormeaux, P. Meyerhofer, H. Luckenbach and G. V. Korshin, Effects of blending of desalinated and conventionally treated surface water on iron corrosion and its release from corroding surfaces and pre-existing scales, Water Res., 2013, 47, 3817–3826 CrossRef CAS.
- F. Shi, L. Zhang, J. Yang, M. Lu, J. Ding and H. Li, Polymorphous FeS corrosion products of pipeline steel under highly sour conditions, Corros. Sci., 2016, 102, 103–113 CrossRef CAS.
- J. A. M. Gomez, V. G. de Resende, J. Antonissen and E. De Grave, Characterization of the effects of silicon on the formation of goethite, Corros. Sci., 2011, 53, 1756–1761 CrossRef.
- S.-K. Kwon, K. i. Kimijima, K. Kanie, S. Suzuki, A. Muramatsu, M. Saito, K. Shinoda and Y. Waseda, Influence of silicate ions on the formation of goethite from green rust in aqueous solution, Corros. Sci., 2007, 49, 2946–2961 CrossRef CAS.
- S.-K. Kwon, K. Shinoda, S. Suzuki and Y. Waseda, Influence of silicon on local structure and morphology of gamma-FeOOH and alpha-FeOOH particles, Corros. Sci., 2007, 49, 1513–1526 CrossRef CAS.
- B. F. Li, B. F. Trueman, M. S. Rahman, Y. H. Gao, Y. Park and G. A. Gagnon, Understanding the impacts of sodium silicate on water quality and iron oxide particles, J. Environ. Sci. Water Resour., 2019, 5, 1360–1370 RSC.
- P. Sarin, V. L. Snoeyink, D. A. Lytle and W. M. Kriven, Iron corrosion scales: Model for scale growth, iron release, and colored water formation, J. Environ. Eng., 2004, 130, 364–373 CAS.
- Y. T. Ma, Y. Li and F. H. Wang, Corrosion of low carbon steel in atmospheric environments of different chloride content, Corros. Sci., 2009, 51, 997–1006 CAS.
- H. Liu, M. R. Ma, M. Qin, L. J. Yang and Y. Wei, Studies on the controllable transformation of ferrihydrite, J. Solid State Chem., 2010, 183, 2045–2050 CrossRef CAS.
- D. D. Boland, R. N. Collins, C. J. Glover and T. D. Waite, An in situ quick-EXAFS and redox potential study of the Fe(II)-catalysed transformation of ferrihydrite, Colloids Surf., A, 2013, 435, 2–8 CrossRef CAS.
- C. S. Liu, Z. K. Zhu, F. B. Li, T. X. Liu, C. Z. Liao, J. J. Lee, K. M. Shih, L. Tao and Y. D. Wu, Fe(II)-induced phase transformation of ferrihydrite: The inhibition effects and stabilization of divalent metal cations, Chem. Geol., 2016, 444, 110–119 CrossRef CAS.
- L. L. Wu, B. L. Beard, E. E. Roden and C. M. Johnson, Stable Iron Isotope Fractionation Between Aqueous Fe(II) and Hydrous Ferric Oxide, Environ. Sci. Technol., 2011, 45, 1847–1852 CrossRef CAS.
- R. M. Handler, B. L. Beard, C. M. Johnson and M. M. Scherer, Atom Exchange between Aqueous Fe(II) and Goethite: An Fe Isotope Tracer Study, Environ. Sci. Technol., 2009, 43, 1102–1107 CrossRef CAS.
- H. D. Pedersen, D. Postma, R. Jakobsen and O. Larsen, Fast transformation of iron oxyhydroxides by the catalytic action of aqueous Fe(II), Geochim. Cosmochim. Acta, 2005, 69, 3967–3977 CrossRef CAS.
- L. Yang, C. I. Steefel, M. A. Marcus and J. R. Bargar, Kinetics of Fe(II)-Catalyzed Transformation of 6-line Ferrihydrite under Anaerobic Flow Conditions, Environ. Sci. Technol., 2010, 44, 5469–5475 CrossRef CAS.
- A. S. Kinsela, A. M. Jones, M. W. Bligh, A. N. Pham, R. N. Collins, J. J. Harrison, K. L. Wilsher, T. E. Payne and T. D. Waite, Influence of Dissolved Silicate on Rates of Fe(II) Oxidation, Environ. Sci. Technol., 2016, 50, 11663–11671 CrossRef CAS.
- A. M. Jones, R. N. Collins, J. Rose and T. D. Waite, The effect of silica and natural organic matter on the Fe(II)-catalysed transformation and reactivity of Fe(III) minerals, Geochim. Cosmochim. Acta, 2009, 73, 4409–4422 CrossRef CAS.
- G. Sahoo, S. Fujieda, K. Shinoda, S. Yamaguchi, M. Korosaki and S. Suzuki, Influence of silicon species on the transformation of green rust I(Cl-) in aqueous solution by oxidation, Corros. Sci., 2011, 53, 4001–4009 CrossRef CAS.
- R. Kaegi, A. Voegelin, D. Folini and S. J. Hug, Effect of phosphate, silicate, and Ca on the morphology, structure and elemental composition of Fe(III)-precipitates formed in aerated Fe(II) and As(III) containing water, Geochim. Cosmochim. Acta, 2010, 74, 5798–5816 CrossRef CAS.
Footnote |
| † Electronic supplementary information (ESI) available. See DOI: 10.1039/d0ra08042j |
| This journal is © The Royal Society of Chemistry 2020 |

