 Open Access Article
Aliovalent-doped sodium chromium oxide (Na0.9Cr0.9Sn0.1O2 and Na0.8Cr0.9Sb0.1O2) for sodium-ion battery cathodes with high-voltage characteristics†
Woon Bae Park‡
a,
Muthu Gnana Theresa Nathan‡ a,
Su Cheol Hana,
Jin-Woong Leeb,
Kee-Sun Sohn
 *b and
Myoungho Pyo
 *a
*a
aDepartment of Printed Electronics Engineering, Sunchon National University, Chonnam 57922, Republic of Korea. E-mail: mho@sunchon.ac.kr
bFaculty of Nanotechnology and Advanced Materials Engineering, Sejong University, Seoul 05006, Republic of Korea. E-mail: kssohn@sejong.ac.kr
First published on 27th November 2020
Abstract
NaCrO2 with high rate-capability is an attractive cathode material for sodium-ion batteries (NIBs). However, the amount of reversibly extractable Na+ ions is restricted by half, which results in relatively low energy density for practical NIB cathodes. Herein, we describe aliovalent-doped O3–Na0.9[Cr0.9Sn0.1]O2 (NCSnO) and O3–Na0.8[Cr0.9Sb0.1]O2 (NCSbO), both of which show high-voltage characteristics that translate to an increase in energy density. In contrast to NaCrO2, NCSnO and NCSbO can be reversibly charged to 3.80 and 3.95 V, respectively, delivering 0.5 Na+ along with Cr3+/4+ redox alone. The reversible chargeability to Na0.4[Cr0.9Sn0.1]O2 and Na0.3[Cr0.9Sb0.1]O2 is not associated with the suppression of Cr6+ formation. Both compounds show concentrations of Cr6+ that are higher than that of Na0.3CrO2, with an absence of O3′ phases. This implies that aliovalent-doping contributes to a suppression of the Cr6+ migration into tetrahedral sites in the interslab space, which reduces the possibility of irreversible comproportionation. NCSnO and NCSbO deliver capacities comparable to that of NaCrO2, but show a higher average discharge voltage (2.94 V for NaCrO2; 3.14 V for NCSnO; 3.21 V for NCSbO), which leads to a noticeable increase in energy densities. The high-voltage characteristics of NCSnO and NCSbO are also validated via density-functional-theory calculations.
Introduction
With continuous expansion of the use of lithium-ion batteries (LIBs) as an almost unique power source for ubiquitous energy demands,1,2 sustainability is becoming more and more important these days. One of the most promising solutions to this persistent issue for LIBs could be the development of sodium-ion batteries (NIBs), because sodium is plentiful in nature and has a reduction potential that is comparable to that of lithium.3 Therefore, various Na-storage materials have been developed as NIB cathode candidates,4–14 most of which are based on a layered structure. P2–Na2/3[Mg0.28Mn0.72]O2,15 O3–Na[Fe0.50Co0.50]O2,16 and P3/P2/O3–Na0.76Mn0.5Ni0.3Fe0.1Mg0.1O2 (ref. 17) are only a few of the cathode materials with a high energy density of ca. 500 W h kg−1.The crystallographic structure and electrochemical properties of layered NIB cathodes are often compared to those of layered LIB cathodes because the fundamental chemistry of the former is similar to that of the latter. A slight difference in the ionic size of mobile ions (Li+ = 0.76 Å vs. Na+ = 1.02 Å), however, significantly affects the structural stability, which causes distinctively different phase-transition and voltage behaviors during charge/discharge (C/D). In general, large Na+ ions tend to reside in a prismatic site rather than in an octahedral site, which induces multiple phase transitions with x variations during C/D in NaxMO2 (M = first-series transition metals). For example, while O3–LiCoO2 is generally known to maintain its hexagonal structure up to Li∼0.5CoO2,18–20 the O3 phase of NaCoO2 is frequently changed to O′3 (Na0.95CoO2), P′3 (Na0.9CoO2), and P3 (Na0.82CoO2) during a charge process, which leads to inferior cyclic stability of O3–NaCoO2 compared with that of O3–LiCoO2.13,21
Another interesting example of the dramatic effect of ionic size is NaCrO2. In contrast to O3–LiCrO2, which suffers from the hindrance of Li+ diffusion due to Cr6+ ions generated during charging,22 O3–NaCrO2 shows reversible Na+ intercalation/de-intercalation within a reasonable voltage window.22–31 Unless the high-voltage cutoff (Ehigh) exceeds ca. 3.6 V, the hexagonal O3 phase of NaCrO2 is reversibly transformed to a monoclinic P′3 type via the monoclinic O′3 phase and delivers a capacity of ca. 120 mA h g−1 (Na0.5CrO2).23–25 Further charging beyond 3.6 V results in the irreversible formation of another O3 phase (O3′) and a rock-salt structure with Cr6+ in tetrahedral sites and Cr4+ in octahedral sites between interslabs, respectively.26,27 The Ehigh during C/D in NaCrO2, therefore, is usually limited to 3.6 V to avoid a detrimental structure-transformation, which signifies that the voltage limitation must be solved to increase the energy density of NaCrO2. To tackle this issue in NaCrO2, Cr-based multi-metallic systems have been studied and possible increases in average operating voltage have been addressed.32–35 For example, Cao et al. claimed that the disproportionation reaction can be effectively suppressed in NaCr1/3Fe1/3Mn1/3O2 due to the presence of Fe3+ and Mn4+ when charged to 4.2 V.32 However, although Cr3+/4+ redox is involved in these multi-metallic compounds, a significant fraction of electroactivity was the result of other metallic species, and the contribution from Cr3+/4+ redox was not substantial. An effort aimed at structural stabilization by sodium-site doping with calcium has also been examined.36,37
In this work, we describe aliovalent doping and its effect of on the electrochemical behaviors in NaCrO2 (O3–Na0.9[Cr0.9Sn0.1]O2 and O3–Na0.8[Cr0.9Sb0.1]O2), in which Sn4+ and Sb5+ ions are electrochemically inert and their fraction is relatively small, in contrast to previous studies. First, we evaluate the structural stability via density functional theory (DFT) calculation and find that NaCrO2 with higher contents of Sn4+ and Sb5+ does not retain the O3 structure. We also experimentally demonstrate that the title compounds can be reversibly charged to voltages exceeding 3.6 V until 0.5 Na+ is extracted (3.80 V in Na0.4[Cr0.9Sn0.1]O2 and 3.95 V in Na0.3[Cr0.9Sb0.1]O2), which results in a higher energy density than pristine NaCrO2. The origin of the reversibility and the high-voltage features are discussed based on structural analysis and theoretical computation.
Experimental
All chemicals were purchased from Sigma-Aldrich unless otherwise mentioned. The O3–NaCrO2 was synthesized via a conventional solid-state method reported elsewhere.10 For the synthesis of O3–Na0.9[Cr0.9Sn0.1]O2 and O3–Na0.8[Cr0.9Sb0.1]O2, stoichiometric amounts of Na2CO3, Cr2O3, CrSbO4, and SnO2 were used as starting materials. CrSbO4 was obtained by heating a mixture of Cr2O3 and Sb2O3 at 1100 °C for 12 h under an air atmosphere.38 The precursors were mixed in a mortar and the mixture was pressed into pellets (5 wt% excess of Na2CO3 was used in order to compensate for Na loss at high temperature). The pellets were sintered at 750 °C for 3 h, and then at 1200 °C for 8 h under a continuous flow of Ar. The samples were naturally cooled and stored in an Ar-filled glove box until further use.Ex situ X-ray diffraction (XRD) was carried out to identify the crystalline phases of the as-prepared powders as well as C/D cycled electrodes. The measurements were performed using an X-ray diffractometer (Rigaku ULTIMA 4) with monochromatic Cu Kα radiation (λ = 1.5406 Å). To prevent the exposure of samples to the atmosphere during XRD measurements, the samples were sealed in an air-sensitive holder covered with Kapton film. The XRD patterns of pristine powders and electrochemically charged films were characterized via Rietveld refinement using FullProf software. The surface morphologies and the compositions of the synthesized compounds were examined using a JEOL JSM-7100F field emission scanning electron microscope (FESEM) and energy dispersive X-ray (EDX). A Thermo Fisher X-ray photoelectron spectrometer (XPS) with an Al Kα X-ray source was used to investigate the chemical state of chromium.
To prepare the electrodes, active material (80 wt%), acetylene black (10 wt%), and polyvinylidene fluoride (10 wt%) were mixed with N-methyl-2-pyrrolidone. The slurry was pasted onto Al foil using a doctor blade and was then vacuum-dried at 100 °C for 2 h. The electrodes were cut into a circular disk with a diameter of 16 mm. The typical mass loading of active material was ca. 2 mg cm−2. For electrochemical tests, 2032 coin-type half-cells were fabricated in an Ar-filled glove box using Na metal as a counter/reference electrode, a separator (Whatman glass filter), and 1 M NaPF6 dissolved in ethylene carbonate![[thin space (1/6-em)]](https://www.rsc.org/images/entities/char_2009.gif) :
:![[thin space (1/6-em)]](https://www.rsc.org/images/entities/char_2009.gif) diethyl carbonate (EC
diethyl carbonate (EC![[thin space (1/6-em)]](https://www.rsc.org/images/entities/char_2009.gif) :
:![[thin space (1/6-em)]](https://www.rsc.org/images/entities/char_2009.gif) DEC, 1
DEC, 1![[thin space (1/6-em)]](https://www.rsc.org/images/entities/char_2009.gif) :
:![[thin space (1/6-em)]](https://www.rsc.org/images/entities/char_2009.gif) 1) as electrolytes. Galvanostatic C/D tests were carried out using a WonATech (WBCS 3000) battery tester.
1) as electrolytes. Galvanostatic C/D tests were carried out using a WonATech (WBCS 3000) battery tester.
Result and discussion
In this study, we selected Sn4+ and Sb5+ ions for aliovalent doping of O3–NaCrO2 because of the similarity in the ionic radii (r[Cr3+] = 0.615, r[Sn4+] = 0.69, and r[Sb5+] = 0.60 Å) and the possession of the highest oxidation states, in which the latter ensures electrochemical inertness during a high-voltage charge. We first compared the structural stabilities of Na1−x[Cr1−xSnx]O2 and Na1−2x[Cr1−xSbx]O2 in different phases (O3, P2, and P3) via ab initio DFT calculation. The total energies (ET) for O3, P2, and P3 were calculated using R![[3 with combining macron]](https://www.rsc.org/images/entities/char_0033_0304.gif) m, P63/mmc, and R3m space groups, respectively. The 3 × 2 × 1 (O3 and P3) and 3 × 3 × 1 (P2) supercells, which contain the same number of formula units (18 units), were used to estimate the possible configurations for each composition (i.e., Na16[Cr16Sn2]O36 for x = 0.1; Na14[Cr14Sn4]O36 for x = 0.2; Na13[Cr13Sn5]O36 for x = 0.3; Na14[Cr16Sb2]O36 for x = 0.1; Na12[Cr15Sb3]O36 for x = 0.15; Na10[Cr14Sb4]O36 for x = 0.2). The total number of configurations for each composition was checked using a supercell program developed by Okhotnikov et al.39 Among them, we randomly selected 10 configurations for each composition, which appeared to be distinctive from each other and to be entropically plausible.
m, P63/mmc, and R3m space groups, respectively. The 3 × 2 × 1 (O3 and P3) and 3 × 3 × 1 (P2) supercells, which contain the same number of formula units (18 units), were used to estimate the possible configurations for each composition (i.e., Na16[Cr16Sn2]O36 for x = 0.1; Na14[Cr14Sn4]O36 for x = 0.2; Na13[Cr13Sn5]O36 for x = 0.3; Na14[Cr16Sb2]O36 for x = 0.1; Na12[Cr15Sb3]O36 for x = 0.15; Na10[Cr14Sb4]O36 for x = 0.2). The total number of configurations for each composition was checked using a supercell program developed by Okhotnikov et al.39 Among them, we randomly selected 10 configurations for each composition, which appeared to be distinctive from each other and to be entropically plausible.
DFT calculations were executed using the Vienna ab initio simulation package (VASP5.3),40 in which a GGA-PBE (generalized gradient approximation parameterized by Perdew, Burke, and Ernzerhof) exchange correlation functional,41 a PAW (projector-augmented-wave) potential with an energy cutoff of 500 eV,42,43 and a 3 × 3 × 2 k-mesh determined by the Monkhorst–Pack scheme were implemented.44 The atomic position and lattice size were allowed to relax until the total energy accuracy and ionic force components converged to 10−5 eV and 0.01 eV Å−1, respectively. The on-site interaction (Hubbard U) value was set to 4.0 for a Cr d orbital.45
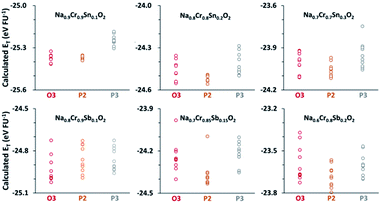
The ET values for each composition with different structures, as compared in Fig. 1, clearly show that the most stable structure strongly depends on the composition. For example, the average ET value of −24.94 eV per FU for the O3 type of Na0.8[Cr0.9Sb0.1]O2 was appreciably lower than the −24.83 eV per FU for either P2 or P3 types. The O3 preference was also the case in Na0.9[Cr0.9Sn0.1]O2. The stability of Na0.8[Cr0.9Sb0.1]O2 and Na0.9[Cr0.9Sn0.1]O2, therefore, indicated that the O3 structure could be stable in a wide range of Na+ content after aliovalent substitution in contrast to the brief existence of an O3 phase in NaCrO2 during charge.23–27 Further increases in the amounts of substituents (Sn4+ and Sb5+), and thereby a decrease in the content of Na+, changed the most stable phase to a P2 type, but the energetic preference over O3 was not so conspicuous as that for Na0.9[Cr0.9Sn0.1]O2 and Na0.8[Cr0.9Sb0.1]O2.
Na0.9[Cr0.9Sn0.1]O2 (NCSnO) and Na0.8[Cr0.9Sb0.1]O2 (NCSbO), which were predicted to retain the O3 structures in DFT calculations, were synthesized via a conventional solid-state method and subjected to XRD measurements along with pristine O3–NaCrO2 (NCO) (Fig. 2). We selected these two compounds because the goal of this research was to investigate the effect of aliovalent doping on the electrochemical behaviors of O3–NCO when Cr3+/4+ alone is involved in a redox process. Ex situ XRD revealed the formation of O3 layered structures in both NCSnO and NCSbO in accordance with the DFT results. The characteristic peaks of O3 phases (space group = R![[3 with combining macron]](https://www.rsc.org/images/entities/char_0033_0304.gif) m) were evident with small impurities (Na2CrO4 denoted by asterisks). The most intense (003) and (104) peaks showed well-defined symmetric shapes with neither peak-splitting nor shoulders, which indicated the absence of monoclinically distorted phases (O′3, space group = C2/m) in as-prepared compounds. The negligible peak intensities of (015) relative to (104) also suggested that Na+ ions resided in the octahedral sites (i.e., no P3 or P′3 phases) for all compounds. It was also obvious that the c-axis length increased with the incorporation of Sn4+ or Sb5+ because of a decrease in Na+ content with a concomitant increase in electrostatic repulsion between the MO6 layers. The (003) peak located at 16.62° in NCO was shifted to lower 2θ angles of 16.34° and 16.28° in NCSnO and NCSbO, respectively. This also implied that Sn4+ and Sb5+ ions were unlikely to occupy the octahedral sites in Na+ layers; otherwise, the c-axis lengths could be shortened in NCSnO and NCSbO. An increase in the relative intensities of (101)/(012) after substitution was another indication for the existence of Sn4+ and Sb5+ in the transition metal layers.
m) were evident with small impurities (Na2CrO4 denoted by asterisks). The most intense (003) and (104) peaks showed well-defined symmetric shapes with neither peak-splitting nor shoulders, which indicated the absence of monoclinically distorted phases (O′3, space group = C2/m) in as-prepared compounds. The negligible peak intensities of (015) relative to (104) also suggested that Na+ ions resided in the octahedral sites (i.e., no P3 or P′3 phases) for all compounds. It was also obvious that the c-axis length increased with the incorporation of Sn4+ or Sb5+ because of a decrease in Na+ content with a concomitant increase in electrostatic repulsion between the MO6 layers. The (003) peak located at 16.62° in NCO was shifted to lower 2θ angles of 16.34° and 16.28° in NCSnO and NCSbO, respectively. This also implied that Sn4+ and Sb5+ ions were unlikely to occupy the octahedral sites in Na+ layers; otherwise, the c-axis lengths could be shortened in NCSnO and NCSbO. An increase in the relative intensities of (101)/(012) after substitution was another indication for the existence of Sn4+ and Sb5+ in the transition metal layers.
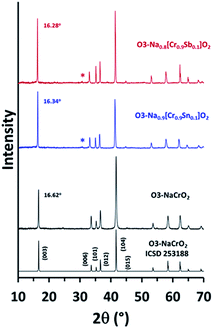 | ||
| Fig. 2 Comparison of the ex situ XRD patterns of NCO, NCSnO, and NCSbO. Asterisks indicate a small impurity phase (Na2CrO4). | ||
Prior to the extraction of detailed crystallographic information via Rietveld refinement, EDX studies were performed to confirm the chemical composition of as-synthesized compounds (Fig. S1†). FESEM images showed no morphological changes after substitutions with Sn4+ and Sb5+.46,47 The particles retained platelet shapes, which reflected the characteristic morphology of layered materials. The corresponding elemental maps also showed a homogeneous distribution of individual elements. The EDX spectra revealed the compositions of Na0.89±0.02Cr0.91±0.02Sb0.09±0.01O2 and Na0.80±0.02Cr0.91±0.02Sb0.09±0.00O2 for NCSnO and NCSbO, respectively, which indicated that the final compositions agreed well with the nominal compositions.
The change in the lattice parameters and atomic positions after aliovalent doping was estimated via Rietveld refinement (Fig. S2†). The positions of Na+ and Cr3+ (Sn4+, Sb5+) were fixed at special sites. Only the z coordinate of O2− was refined. The possibility for a site disorder between Na+ and Cr3+ (Sn4+, Sb5+) was excluded because the simulated profiles deviated substantially from the XRD patterns, particularly at relative intensities of (006)/(101). Excellent agreement between the experimental and calculated patterns was obtained using the space group of R![[3 with combining macron]](https://www.rsc.org/images/entities/char_0033_0304.gif) m for all compounds (Table 1). The refinement results indicated that the interslab distance (dinterslab) was slightly increased after substitution, which was due to the enhanced electrostatic repulsion between MO6 layers. In fact, the thickness of the Na+ layers was significantly increased from 3.069 Å (NCO) to 3.168 (NCSnO) and 3.186 Å (NCSbO), but the simultaneous contraction in the thickness of MO6 layers (2.258 Å for NCO → 2.208 Å for NCSnO and 2.214 Å for NCSbO) resulted in relatively small changes in dinterslab (Fig. 3). The volumes of MO6 octahedra in both NSCnO and NCSbO (11.343 and 11.302 Å3) were also slightly smaller than that in NCO (11.557 Å3), despite the inclusion of larger cations in NCSnO.
m for all compounds (Table 1). The refinement results indicated that the interslab distance (dinterslab) was slightly increased after substitution, which was due to the enhanced electrostatic repulsion between MO6 layers. In fact, the thickness of the Na+ layers was significantly increased from 3.069 Å (NCO) to 3.168 (NCSnO) and 3.186 Å (NCSbO), but the simultaneous contraction in the thickness of MO6 layers (2.258 Å for NCO → 2.208 Å for NCSnO and 2.214 Å for NCSbO) resulted in relatively small changes in dinterslab (Fig. 3). The volumes of MO6 octahedra in both NSCnO and NCSbO (11.343 and 11.302 Å3) were also slightly smaller than that in NCO (11.557 Å3), despite the inclusion of larger cations in NCSnO.
| Atom | Wyckoff symbol | NaCrO2 | Na0.9[Cr0.9Sn0.1]O2 | Na0.8[Cr0.9Sb0.1]O2 | |||
|---|---|---|---|---|---|---|---|
| z/c | U (Å2) | z/c | U (Å2) | z/c | U (Å2) | ||
a Space group: R![[3 with combining macron]](https://www.rsc.org/images/entities/char_0033_0304.gif) m; number of formula per unit cell (z) = 3; NaCrO2: a = 2.977727 (4) Å, c = 15.9805 (5) Å, Rp = 2.82, Rwp = 3.68, Rexp = 1.92 and χ2 = 3.68; Na0.9[Cr0.9Sn0.1]O2: a = 2.9833 (1) Å, c = 16.1285 (5) Å, Rp = 4.96, Rwp = 7.00, Rexp = 4.37 and χ2 = 2.57; Na0.8[Cr0.9Sb0.1]O2: a = 2.9735 (1) Å, c = 16.1993 (7) Å, Rp = 4.65, Rwp = 6.31, Rexp = 4.37 and χ2 = 2.09. m; number of formula per unit cell (z) = 3; NaCrO2: a = 2.977727 (4) Å, c = 15.9805 (5) Å, Rp = 2.82, Rwp = 3.68, Rexp = 1.92 and χ2 = 3.68; Na0.9[Cr0.9Sn0.1]O2: a = 2.9833 (1) Å, c = 16.1285 (5) Å, Rp = 4.96, Rwp = 7.00, Rexp = 4.37 and χ2 = 2.57; Na0.8[Cr0.9Sb0.1]O2: a = 2.9735 (1) Å, c = 16.1993 (7) Å, Rp = 4.65, Rwp = 6.31, Rexp = 4.37 and χ2 = 2.09. |
|||||||
| Na+ | 3b | 0.5 | 0.0091 (10) | 0.5 | 0.0055 (12) | 0.5 | 0.0052 (14) |
| Cr3+ | 3a | 0 | 0.0140 (7) | 0 | 0.0053 (6) | 0 | 0.0052 (10) |
| Sn4+ | 3a | 0 | 0.0053 (6) | ||||
| Sb5+ | 3a | 0 | 0.0052 (10) | ||||
| O2− | 6c | 0.2627 (2) | 0.0007 (9) | 0.2649 (2) | 0.0056 (13) | 0.265 (2) | 0.0067 (13) |
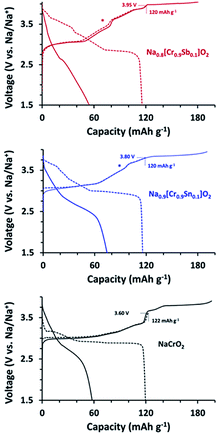
The title compounds along with NCO were subjected to galvanostatic C/D at 20 mA g−1 to examine how the substitution influenced to the voltage behaviors (Fig. 4). As well known, NCO showed the good reversibility when the Ehigh is limited to 3.60 V with a charge capacity of 122 mA h g−1 (Na∼0.5CrO2).23–25 An increase in the Ehigh to 3.90 V resulted in serious decay in the corresponding discharge capacity due to the formation of O3′ and/or rock-salt phases.26,27 The charge profiles of NCSnO and NCSbO also indicated that Na0.5MO2 can be attained by charging to ca. 3.6 V with capacities of 97 and 77 mA h g−1, respectively. The sharp increase of the voltages in NCO, however, were substantially alleviated in NCSnO and NCSbO, which indicated that the presence of immobile Sn4+ and Sb5+ hinders the charge re-distribution (Na+/vacancy ordering) within MO6 layers. Interestingly, further increases of Ehigh were possible to allow a reversible capacity of ca. 120 mA h g−1 (i.e., Na0.4[Cr0.9Sn0.1]O2 and Na0.3[Cr0.9Sb0.1]O2) with no negative impact on the subsequent discharge process. As Fig. 4 (dotted lines) shows, by charging to 3.80 (NCSnO) and 3.95 V (NCSbO), ca. 0.5 Na+ could be reversibly extracted. A subsequent discharge profile showed the retention of high-voltage characteristics via the delivery of ca. 50–60% of the total discharge capacity above 3.0 V. This implies that the charge process at voltages higher than 3.60 V in NCSnO and NCSbO was not ascribed to kinetic limitations (i.e., overpotential). Instead, it was caused by the intrinsically high equilibrium potentials. Although NCSnO and NCSbO were stable up to 3.80 and 3.95 V, however, further charge resulted in a significant loss of reversibility. Fig. 4 (solid lines) shows that discharge capacities were reduced to 74 and 54 mA h g−1 after charging to 3.95 and 4.05 V in NCSnO and NCSbO, respectively. It is of note that the reversible capacities were not noticeably varied with mass loading in a range of 1.5 and 4.0 mg cm−2, in contrast to sensitive dependance in LiFePO4.48,49
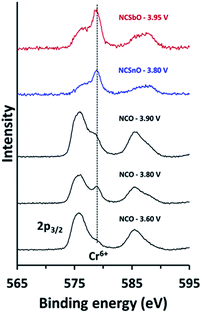
In order to understand the reversibility of NCSnO and NCSbO within a wider potential window, we compared the oxidation states of chromium for fully charged NCSnO and NCSbO with those in NCO (Fig. 5). XPS spectra revealed that, while NCO charged to 3.60 V (Na∼0.5CrO2) contains negligible amounts of Cr6+, the Cr6+ content is substantial in NCO charged to 3.80 V (Na∼0.3CrO2) due to the disproportionation of Cr4+. The intense Cr6+ peak in Na∼0.3CrO2, however, became weaker again in NCO charged to 3.90 V (Na∼0.2CrO2), because of the comproportionation reaction to a rock-salt structure (CrNa+layer6+ + 2CrMO6 layer3+ → 3Crrock-salt4+).26 In contrast, fully charged NCSnO and NCSbO (Na0.4[Cr0.9Sn0.1]O2 and Na0.3[Cr0.9Sb0.1]O2) showed strong Cr6+ peaks, which implied that the presence of Sn4+ and Sb5+ had not hampered the close proximity of Cr4+ ions for a disproportionation reaction (3CrMO6 layer4+ → CrMO6 layer6+ + 2CrMO6 layer3+). Despite the high concentration of Cr6+ in fully charged NCSnO and NCSbO, therefore, the electrochemical reversibility appeared to be maintained due to the prevention of Cr6+ migration into the Na+ layers, which is the route for the irreversible formation of O3′ and/or rock-salt phases.
Since the electrochemical reversibility of NCSnO and NCSbO with high Ehigh is not ascribed to the suppression of Cr6+ formation, we investigated the difference in the structural evolution to understand the high-voltage features of the two compounds. Ex situ XRD patterns during charge were recorded at various states-of-charge with an interval of 0.1 in Na+ content. For NCO, the change in the XRD patterns agreed well with the previously reported results (Fig. 6A). On charging, (003) and (006) peaks of an O3 phase were split with a new peak appearing at a lower 2θ. Two separated peaks were observed in 0.9 Na+ that immediately merged into a single peak when further charged to 0.8 Na+ and 0.7 Na+. Note that the (104) peak in the O3 phase was also split into two peaks with substantial intensities ((111) and (20-2)), which is a signature for the formation of a monoclinically distorted O′3 phase. Therefore, the change in the XRD patterns indicated a phase transition from O3 to O′3 through a mixed O3/O′3 phase when NCO was charged to Na0.7CrO2. The O′3 phase was immediately transformed to a P′3 phase with a further charge, which was evident from the abrupt weakening of the (111) and (20-2) peaks of O′3 and the appearance of intense (201) and (11-2) peaks of P′3 in a 2θ range of 44° and 45.5°. In appearance, the P′3 phase seemed to be maintained up to Na0.3CrO2 (charge to 3.80 V).
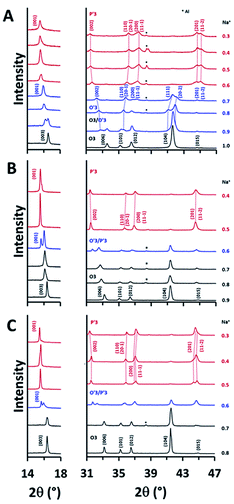 | ||
| Fig. 6 Evolution of XRD patterns during Na+ extraction in (A) NCO and (B) NCSnO with Ehigh of 3.80 V and (C) NCSbO with Ehigh of 3.95 V. | ||
NCSnO and NCSbO showed phase transition behaviors that were noticeably different from those of NCO (Fig. 6B and C). During a charge, the O3 phases were maintained up to Na0.7MO2. Separation of the (003) and (006) peaks became evident at Na0.6MO2 in contrast to the incipient appearance in NCO (Na0.9CrO2). Furthermore, the structure of the two phases in Na0.6MO2 seemed to be different from that in Na0.9CrO2. The appreciable peak intensity at 2θ of ca. 44.7° strongly signified the inclusion of a P′3 phase. Despite no clear peak splitting, we also considered the presence of an O′3 phase in Na0.6MO2 from the peak broadening of (104). This two-phase region (O′3/P′3) was short-lived. It was immediately transformed to a P′3 phase, which was maintained to the fully charged states (Na0.4[Cr0.9Sn0.1]O2 and Na0.3[Cr0.9Sb0.1]O2).
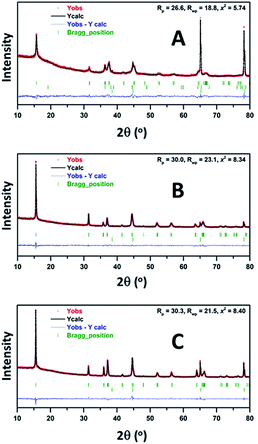
It is noteworthy that, although all three compounds appeared to have the P′3 structures in a fully charged state (Na0.3CrO2, Na0.4[Cr0.9Sn0.1]O2, and Na0.3[Cr0.9Sb0.1]O2), closer examination revealed that, while Na0.4[Cr0.9Sn0.1]O2 and Na0.3[Cr0.9Sb0.1]O2 are composed of a single P′3 phase, Na0.3CrO2 contains O3′–NaδCrO2 along with P′3–Na0.4CrO2. The generation of O3′ and rock-salt structures in NaxCrO2 (x < 0.4), which led to irreversibility in Na+ migration, was addressed in a previous report.26 Our Rietveld refinement results also showed the presence of an O3′–NaδCrO2 wherein one-third of Cr ions reside in the tetrahedral sites of Na+ layers (Fig. 7A, Tables S1 and S2†). We obtained good agreement between the experimental data and the calculated pattern by using a relative P′3–Na0.4CrO2/O3–NaδCrO2 ratio of 84.4/15.6. Note that the addition of rock-salt CrO2 was avoided because of the strong diffraction peaks of an Al substrate, which closely overlapped those from rock-salt CrO2. In contrast, the XRD patterns of Na0.4[Cr0.9Sn0.1]O2 and Na0.3[Cr0.9Sb0.1]O2 films were fitted well with a single P′3 phase and no O3′–NaδCrO2 (Fig. 7B, C, Tables S3 and S4†). Aliovalent doping, therefore, is likely to suppress the formation of O3′–NaδCrO2 in Na0.4[Cr0.9Sn0.1]O2 and Na0.3[Cr0.9Sb0.1]O2, which enables a charge to higher voltages in NCSnO and NCSbO.
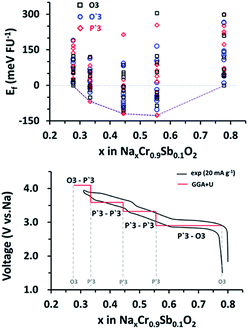
The high-voltage characteristics of NCSbO were further validated via DFT calculations. The formation energy (Ef) was obtained for O3, O′3, and P′3 phases at various states-of charge, using 3 × 2 × 1, 3 × 2 × 1, and 1 × 3 × 3 supercells, respectively (Fig. 8). The electrochemical potential was calculated using the configuration with the lowest Ef for each x value. Eqn (1) was used, where E(Nax1Cr0.9Sb0.1O2) and E(Nax2Cr0.9Sb0.1O2) indicate the total energies of NCSbO with Na contents of x1 and x2, respectively. Ebulk(Na) is the total energy of Na metal in a body-centered cubic (Im![[3 with combining macron]](https://www.rsc.org/images/entities/char_0033_0304.gif) m) structure, which corresponds to the chemical potential of Na in the anode. F is the Faraday constant.
m) structure, which corresponds to the chemical potential of Na in the anode. F is the Faraday constant.
 | (1) |
The DFT-calculated voltage changes were well matched with the experimental C/D curves with the similar profile shapes and voltage transitions, which validated the introduction of the high-voltage features by incorporating Sb5+ ions into NCO.
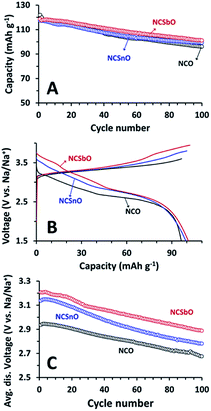
Finally, retention of the capacities and high-voltage characteristics of NCSnO and NCSbO were compared during 100 C/D cycles. With respect to the initial values, the capacities of NCSnO and NCSbO were gradually decreased with cycling, which was similar to the behavior of NCO (Fig. 9A). The degree of capacity fading was marginally different, showing fading rates of 0.26, 0.18, and 0.17 mA h g−1 cycle−1 for NCO, NCSnO, and NCSbO, respectively. As a result, the capacities delivered after 100 C/D were comparable for three compounds (96 mA h g−1 for NCO, 99 mA h g−1 for NCSnO, and 101 mA h g−1 for NCSbO).
The high-voltage C/D properties of NCSnO and NCSbO were also maintained during 100 cycles. A comparison of the 100th voltage profiles revealed that, though the profile shapes were slightly distorted and the C/D voltages were lowered with respect to the 1st voltage profiles (Fig. 4), the high-voltage features in NCSnO and NCSbO were maintained (Fig. 9B). Indeed, the average discharge voltages were continuously decreased with cycling, but the relative superiority of NCSnO and NCSbO was not diminished (Fig. 9C). The average discharge voltages of 3.14 and 3.21 V during the 1st C/D for NCSnO and NCSbO were higher than that of NCO (2.94 V) by 0.20 and 0.27 V, respectively. These high-voltage features were maintained during 100 C/D cycles and resulted in the higher energy densities of NCSnO and NCSbO (275 and 292 mW g−1 vs. 263 mW g−1 for NCO after 100 cycles). We believe that, though not conspicuous (ca. 11% increase in NCSbO), the modification of reversible voltages and the increase of energy densities by electrochemically inert aliovalent doping in NCO suggest a new strategy to enhance the practicality of NaCrO2 for use as a NIB cathode.
Conclusions
NCSnO and NCSbO, both of which retain an O3 structure, were synthesized and their electrochemical properties were examined in comparison to NCO. Despite a lower Na+ content, NCSnO and NCSbO could reversibly intercalate/de-intercalate 0.5 Na+ (Na0.9[Cr0.9Sn0.1]O2 ↔ Na0.4[Cr0.9Sn0.1]O2 and Na0.8[Cr0.9Sb0.1]O2 ↔ Na0.3[Cr0.9Sb0.1]O2) when charged to 3.80 and 3.95 V, respectively. The high-voltage characteristics were retained during subsequent discharge, showing average discharge voltages of 3.14 and 3.21 V for NCSnO and NCSbO, respectively, vs. 2.94 V for NCO. The higher C/D voltages of NCSnO and NCSbO were maintained during 100 C/D cycles with no impact on reversible capacities, which resulted in an improvement in energy density compared with that of NCO.Elucidation of the high-voltage characteristics of NCSnO and NCSbO revealed that, although the aliovalent doping did not prevent the disproportionation of Cr4+ at a fully charged state, it hampered the formations of O3′–NaδCrO2 and/or rock-salt structures and enabled reversible Na+ intercalation at voltages above 3.60 V. These experimental results were also validated via DFT calculation.
Conflicts of interest
There are no conflicts to declare.Acknowledgements
This research was supported by Creative Materials Discovery Program through the NRF of Korea funded by the Ministry of Science, ICT and Future (2015M3D1A1069710), Basic Science Research Program (NRF-2014R1A6A1030419) and the NRF grant (2018R1C1B6006943), and the Technology Innovation Program (Alchemist Project, 20012196, Al based supercritical materials discovery) funded by the Ministry of Trade, Industry & Energy, Korea.References
- A. Mauger and C. M. Julien, Critical review on lithium-ion batteries: are they safe? sustainable?, Ionics, 2017, 23, 1933–1947 CrossRef CAS.
- M. Sawicki and L. L. Shaw, Advances and challenges of sodium ion batteries as post lithium ion batteries, RSC Adv., 2015, 5, 53129–53154 RSC.
- C. Delmas, Sodium and sodium-ion batteries: 50 years of research, Adv. Energy Mater., 2018, 8, 1703137 CrossRef.
- Y. Niu, Y. Zhang and M. Xu, A review on pyrophosphate framework cathode materials for sodium-ion batteries, J. Mater. Chem. A, 2019, 7, 15006–15025 RSC.
- F. Sauvage, L. Laffont, J.-M. Tarascon and E. Baudrin, Study of the insertion/deinsertion mechanism of sodium into Na0.44MnO2, Inorg. Chem., 2007, 46, 3289–3294 CrossRef CAS.
- S. Xu, Y. Wang, L. Ben, Y. Lyu, N. Song, Z. Yang, Y. Li, L. Mu, H.-T. Yang, L. Gu, Y.-S. Hu, H. Li, Z.-H. Cheng, L. Chen and X. Huang, Fe-based tunnel-type Na0.61[Mn0.27Fe0.34Ti0.39]O2 designed by a new strategy as a cathode material for sodium-ion batteries, Adv. Energy Mater., 2015, 5, 1501156 CrossRef.
- M. Chen, W. Hua, J. Xiao, D. Cortie, X. Guo, E. Wang, Q. Gu, Z. Hu, S. Indris, X.-L. Wang, S.-L. Chou and S.-X. Dou, Understanding a new nasicon-type high voltage cathode material for high-power sodium-ion batteries, Angew. Chem., Int. Ed., 2020, 59, 2449–2456 CrossRef CAS.
- L. Bi, Z. Miao, X. Li, Z. Song, Q. Zheng and D. Lin, Improving electrochemical performance of Na3(VPO4)2O2F cathode materials for sodium ion batteries by constructing conductive scaffold, Electrochim. Acta, 2020, 337, 135816 CrossRef CAS.
- J. Li, X. He, S. Ostendorp, L. Zhang, X. Hou, D. Zhou, B. Yan, D. M. Meira, Y. Yang, H. Jia, G. Schumacher, J. Wang, E. Paillard, G. Wilde, M. Winter and J. Li, Tin modification of sodium manganese hexacyanoferrate as a superior cathode material for sodium ion batteries, Electrochim. Acta, 2020, 342, 135928 CrossRef CAS.
- N. Naveen, W. B. Park, S. C. Han, S. P. Singh, Y. H. Jung, D. Ahn, K.-S. Sohn and M. Pyo, Reversible K+-insertion/deinsertion and concomitant Na+-redistribution in P′3-Na0.52CrO2 for high-performance potassium-ion battery cathodes, Chem. Mater., 2018, 30, 2049–2057 CrossRef CAS.
- Q. Liu, Z. Hu, M. Chen, C. Zou, H. Jin, S. Wang, S.-L. Chou and S.-X. Dou, Recent progress of layered transition metal oxide cathodes for sodium-ion batteries, Small, 2019, 15, 1805381 CrossRef.
- S. C. Han, E. G. Bae, H. Lim and M. Pyo, Non-crystalline oligopyrene as a cathode material with a high-voltage plateau for sodium ion batteries, J. Power Sources, 2014, 254, 73–79 CrossRef CAS.
- S. J. R. Prabakar, J. Jeong and M. Pyo, Highly crystalline Prussian blue/graphene composites for high-rate performance cathodes in Na-ion batteries, RSC Adv., 2015, 5, 37545–37552 RSC.
- S. Song, M. Kotobuki, Y. Chen, S. Manzhos, C. Xu, N. Hu and L. Lu, Na-rich layered Na2Ti1−xCrxO3−x/2 (x = 0, 0.06): Na-ion battery cathode materials with high capacity and long cycle life, Sci. Rep., 2017, 7, 373 CrossRef.
- N. Yabuuchi, R. Hara, K. Kubota, J. Paulsen, S. Kumakura and S. Komaba, A new electrode material for rechargeable sodium batteries: P2-type Na2/3[Mg0.28Mn0.72]O2 with anomalously high reversible capacity, J. Mater. Chem. A, 2014, 2, 16851 RSC.
- H. Yoshida, N. Yabuuchi and S. Komaba, NaFe0.5Co0.5O2 as high energy and power positive electrode for Na-ion batteries, Electrochem. Commun., 2013, 34, 60–63 CrossRef CAS.
- M. Keller, D. Buchholz and S. Passerini, Layered Na-ion cathodes with outstanding performance resulting from the synergetic effect of mixed P- and O-type phases, Adv. Energy Mater., 2016, 6, 1501555 CrossRef.
- H. Xia, L. Lu, Y. S. Meng and G. Ceder, Phase transitions and high-voltage electrochemical behavior of LiCoO2 thin films grown by pulsed laser deposition, J. Electrochem. Soc., 2007, 154, A337–A342 CrossRef CAS.
- T. Ohzuku and A. Ueda, Solid-state redox reactions of LiCoO2 (R
![[3 with combining macron]](https://www.rsc.org/images/entities/char_0033_0304.gif) m) for 4 volt secondary lithium cells, J. Electrochem. Soc., 1994, 141, 2972–2977 CrossRef CAS.
m) for 4 volt secondary lithium cells, J. Electrochem. Soc., 1994, 141, 2972–2977 CrossRef CAS. - W. G. Han, W. B. Park, S. P. Singh, M. Pyo and K.-S. Sohn, Determination of possible configurations for Li0.5CoO2 delithiated Li-ion battery cathodes via DFT calculations coupled with a multiobjective non-dominated sorting genetic algorithm (NSGA-III), Phys. Chem. Chem. Phys., 2018, 20, 26405–26413 RSC.
- C. Delmas, J.-J. Braconnier, C. Fouassier and P. Hagenmuller, Electrochemical intercalation of sodium in NaxCoO2 bronze, Solid State Ionics, 1981, 3–4, 165–169 CrossRef CAS.
- S. Komaba, C. Takei, T. Nakayama, A. Ogata and N. Yabuuchi, Electrochemical intercalation activity of layered NaCrO2 vs. LiCrO2, Electrochem. Commun., 2010, 12, 355–358 CrossRef CAS.
- S. Komaba, T. Nakayama, A. Ogata, T. Shimizu, C. Takei, S. Takada, A. Hokura and I. Nakai, Electrochemically reversible sodium intercalation of layered NaNi0.5Mn0.5O2 and NaCrO2, ECS Trans., 2009, 16, 43–55 CrossRef CAS.
- C.-Y. Chen, K. Matsumoto, T. Nohira, R. Hagiwara, A. Fukunaga, S. Sakai, K. Nitta and S. Inazawa, Electrochemical and structural investigation of NaCrO2 as a positive electrode for sodium secondary battery using inorganic ionic liquid NaFSA–KFSA, J. Power Sources, 2013, 237, 52–57 CrossRef CAS.
- Y.-N. Zhou, J.-J. Ding, K.-W. Nam, X. Yu, S.-M. Bak, E. Hu, J. Liu, J. Bai, H. Li, Z.-W. Fu and X.-Q. Yang, Phase transition behavior of NaCrO2 during sodium extraction studied by synchrotron-based X-ray diffraction and absorption spectroscopy, J. Mater. Chem. A, 2013, 1, 11130–11134 RSC.
- S.-H. Bo, X. Li, A. J. Toumar and G. Ceder, Layered-to-rock-salt transformation in desodiated NaxCrO2 (x < 0.4), Chem. Mater., 2016, 28, 1419–1429 CrossRef CAS.
- K. Kubota, I. Ikeuchi, T. Nakayama, C. Takei, N. Yabuuchi, H. Shiiba, M. Nakayama and S. Komaba, New insight into structural evolution in layered NaCrO2 during electrochemical sodium extraction, J. Phys. Chem. C, 2015, 119, 166–175 CrossRef CAS.
- L. Liang, X. Sun, D. K. Denis, J. Zhang, L. Hou, Y. Liu and C. Yuan, Ultralong layered NaCrO2 nanowires: a competitive wide-temperature-operating cathode for extraordinary high-rate sodium-ion batteries, ACS Appl. Mater. Interfaces, 2019, 11, 4037–4046 CrossRef CAS.
- Y. Tsuchiya, A. M. Glushenkov and N. Yabuuchi, Effect of nanosizing on reversible sodium storage in a NaCrO2 electrode, ACS Appl. Nano Mater., 2018, 1, 364–370 CrossRef CAS.
- Y. Wang, W. Li, G. Hu, Z. Peng, Y. Cao, H. Gao, K. Du and J. B. Goodenough, Electrochemical performance of large-grained NaCrO2 cathode materials for Na-ion batteries synthesized by decomposition of Na2Cr2O7·2H2O, Chem. Mater., 2019, 31, 5214–5223 CrossRef CAS.
- X. Xia and J. R. Dahn, NaCrO2 is a fundamentally safe positive electrode material sfor sodium-ion batteries with liquid electrolytes, Electrochem. Solid-State Lett., 2012, 15, A1–A4 CrossRef CAS.
- M.-H. Cao, Y. Wang, Z. Shadike, J.-L. Yue, E. Hu, S.-M. Bak, Y.-N. Zhou, X.-Q. Yang and Z.-W. Fu, Suppressing the chromium disproportionation reaction in O3-type layered cathode materials for high capacity sodium-ion batteries, J. Mater. Chem. A, 2017, 5, 5442–5448 RSC.
- M. Cao, T. Wang, Z. Shadike, K. Nam, Y. Zhou and Z. Fu, Reversible multi-electron transfer of Cr2.8+/Cr4.4+ in O3-type layered Na0.66Fe1/3Cr1/3Ti1/3O2 for sodium-ion batteries, J. Electrochem. Soc., 2018, 165, A565–A574 CrossRef CAS.
- M.-H. Cao, Z. Shadike, Y.-N. Zhou and Z.-W. Fu, Sodium-deficient O3-type Na0.83Cr1/3Fe1/3Mn1/6Ti1/6O2 as a new cathode material for Na-ion batteries, Electrochim. Acta, 2019, 295, 918–925 CrossRef CAS.
- Y. Wang, P. Cui, W. Zhu, Z. Feng, M.-J. Vigeant, H. Demers, A. Guerfi and K. Zaghib, Enhancing the electrochemical performance of an O3–NaCrO2 cathode in sodium-ion batteries by cation substitution, J. Power Sources, 2019, 435, 226760 CrossRef CAS.
- L. Zheng, J. C. Bennett and M. N. Obrovac, Stabilizing NaCrO2 by sodium site doping with calcium, J. Electrochem. Soc., 2019, 166, A2058–A2064 CrossRef CAS.
- S. C. Han, H. Lim, J. Jeong, D. Ahn, W. B. Park, K.-S. Sohn and M. Pyo, Ca-doped NaxCoO2 for improved cyclability in sodium ion batteries, J. Power Sources, 2015, 277, 9–16 CrossRef CAS.
- M. G. T. Nathan, W. B. Park, N. Naveen, S. Park, K.-S. Sohn and M. Pyo, A Comparison of as-synthesized P2-K0.70[Cr0.85Sb0.15]O2 and ion-exchanged P2-K0.62Na0.08[Cr0.85Sb0.15]O2 demonstrates the superiority of the latter as a potassium-ion battery cathode, J. Electrochem. Soc., 2020, 167, 100507 CrossRef CAS.
- K. Okhotnikov, T. Charpentier and S. Cadars, Supercell program: a combinatorial structure-generation approach for the local-level modeling of atomic substitutions and partial occupancies in crystals, J. Cheminf., 2016, 8, 17 Search PubMed.
- G. Kresse and J. Furthmüller, Efficient iterative schemes for ab initio total-energy calculations using a plane-wave basis set, Phys. Rev. B: Condens. Matter Mater. Phys., 1996, 54, 11169–11186 CrossRef CAS.
- J. P. Perdew, A. Ruzsinszky, G. I. Csonka, O. A. Vydrov, G. E. Scuseria, L. A. Constantin, X. Zhou and K. Burke, Restoring the density-gradient expansion for exchange in solids and surfaces, Phys. Rev. Lett., 2008, 100, 136406 CrossRef.
- P. E. Blöchl, Projector augmented-wave method, Phys. Rev. B: Condens. Matter Mater. Phys., 1994, 50, 17953–17979 CrossRef.
- G. Kresse and D. Joubert, From ultrasoft pseudopotentials to the projector augmented-wave method, Phys. Rev. B: Condens. Matter Mater. Phys., 1999, 59, 1758–1775 CrossRef CAS.
- H. J. Monkhorst and J. D. Pack, Special points for Brillouin-zone integrations, Phys. Rev. B: Condens. Matter Mater. Phys., 1976, 13, 5188–5192 CrossRef.
- A. Jain, G. Hautier, S. P. Ong, C. J. Moore, C. C. Fischer, K. A. Persson and G. Ceder, Formation enthalpies by mixing GGA and GGA calculations, Phys. Rev. B: Condens. Matter Mater. Phys., 2011, 84, 045115 CrossRef.
- B. Wang, B. Xu, T. Liu, P. Liu, C. Guo, S. Wang, Q. Wang, Z. Xiong, D. Wang and X. S. Zhao, Mesoporous carbon-coated LiFePO4 nanocrystals co-modified with graphene and Mg2+ doping as superior cathode materials for lithium ion batteries, Nanoscale, 2014, 6, 986–995 RSC.
- T. Ruan, B. Wang, F. Wang, R. Song, F. Jin, Y. Zhou, D. Wang and S. Dou, Stabilizing the structure of LiMn0.5Fe0.5PO4 via the formation of concentration-gradient hollow spheres with Fe-rich surfaces, Nanoscale, 2019, 11, 3933–3944 RSC.
- B. Wang, W. A. Abdulla, D. Wang and X. S. Zhao, A three-dimensional porous LiFePO4 cathode material modified with a nitrogen-doped graphene aerogel for high-power lithium ion batteries, Energy Environ. Sci., 2015, 8, 869–875 RSC.
- B. Wang, D. Wang, Q. Wang, T. Liu, C. Guo and X. Zhao, Improvement of the electrochemical performance of carbon-coated LiFePO4 modified with reduced graphene oxide, J. Mater. Chem. A, 2013, 1, 135–144 RSC.
Footnotes |
| † Electronic supplementary information (ESI) available: EDX results and Rietveld refinement fits for as-synthesized samples, and tables summarizing Rietveld refinement results for fully charged samples. See DOI: 10.1039/d0ra08332a |
| ‡ These authors contributed equally to this work. |
| This journal is © The Royal Society of Chemistry 2020 |

