 Open Access Article
Crystalline phase regulation of anatase–rutile TiO2 for the enhancement of photocatalytic activity
Kuang Wangab,
Yan Zhuoa,
Jiayi Chena,
Dawei Gaoa,
Yu Renb,
Chunxia Wangab and
Zhenming Qi *a
*a
aCollege of Textiles and Clothing, Yancheng Institute of Technology, Yancheng, China. E-mail: cxwang@mail.dhu.edu.cn
bSchool of Textile and Clothing, Nangtong University, Nantong, China
First published on 9th December 2020
Abstract
Biphasic TiO2 with adjustable crystalline phases was prepared by the hydrothermal-calcination method assisted by nitric acid (HNO3) and hydrogen peroxide (H2O2), using potassium titanate oxalate (K2TiO(C2O4)2) as the titanium source. The influences of H2O2 volume on anatase and rutile contents and photocatalytic activity of biphasic TiO2 were investigated and the photocatalytic mechanism was explored. X-ray diffraction (XRD), scanning electron microscopy (SEM), transmission electron microscopy (TEM), X-ray photoelectron spectroscopy (XPS), UV-vis diffuse reflectance spectroscopy (UV-vis DRS) and specific surface area (BET) were employed to characterize crystal structure, physical morphology, absorbable light, chemical composition, specific surface area and pore size distribution. The photocatalytic degradation efficiency towards a methylene blue (MB) solution under xenon light was tested, and the photocatalytic stability of the sample was investigated by photocatalytic cycle experiments. The prepared biphasic TiO2 was nanorod-shaped and had a large specific surface area. The results showed the anatase TiO2 content increased and the photocatalytic efficiency was enhanced as the H2O2 volume solution increased. Among the catalysts, the biphasic TiO2 prepared with 30 mL of H2O2 had the best photocatalytic effect and could entirely degrade the MB solution after 30 minutes under irradiation. After three repeated degradations, the photocatalytic degradation rate was still estimated to be as high as 95%. It is expected that the work will provide new insights into fabricating heterophase junctions of TiO2 for environmental remediation.
1. Introduction
With rapid agricultural and industrial growth, water pollution has become a great challenge to human beings and any other forms of life. How to eliminate pollutants from water and restore ecological water has become our top priority. To address this issue, semiconductor photocatalysis has been regarded as an efficient approach for sewage water purification by utilizing solar energy.1,2 In recent years, many kinds of semiconductors, such as TiO2,3–5 BiOBr,6 Ag3PO4,7 SnO2,8 etc, have been well explored in developing promising photocatalysts. Among them, titanium dioxide (TiO2) has attracted considerable attentions due to its outstanding photocatalytic activity, low cost, adorable chemical and thermal stability, corrosion resistance, nontoxicity and other favorable properties.9 However, as the n-type broad bandgap semiconductor, TiO2 can only be excited by ultraviolet light to produce electron–hole pairs. Single phase TiO2 also suffered from high rate recombination of photogenerated carriers. All these literally hindered its performance on practical applications.10Semiconductors composite and heterophase interfaces are effective strategies to improve photocatalytic activity of TiO2. Recently, more interests are mainly focused on the composite of semiconductors. For instance, TiO2/WO3,11 TiO2/BiVO4,12 TiO2/CuO,13 TiO2/CdS,14 and etc., are of great benefit for the transmission and detachment of photogenerated charge carriers.15 Zhu and his team presented a in situ synthesis technique in preparing g-C3N4/P25, and results revealed that g-C3N4/P25 has superior photodegradation performance than P25.16 BiOBr/TiO2 nanorod heterojunction composite was prepared by Xue and his colleagues via electrochemical anodization method, and products exhibited remarkable reduction efficiency of Cr(VI).17 According to Chi and his coworkers, porous TiO2 nanotubes/Ag3PO4 heterojunction was synthesized by facile electrospinning and chemical co-deposition route, and obtained sample featured an exceptive enhancement by the photodegradation of methylene blue.18 TiO2 heterophase interfaces have been proved to have more superior photocatalytic activity than pure anatase or rutile phase TiO2 by many researchers. Lyu et al.19 fabricated a TiO2 hollow heterophase junction by coating anatase TiO2 hollow spheres with porous amorphous TiO2, and the obtained TiO2 exhibited preferable adsorption capability, light harvesting ability, and charge-separation efficiency. It was reported that TiO2 heterophase junction had controllable contact area between rutile and anatase phase, which is favorable for the separation and transition of photo-generated carriers at the heterojunction region.20 E et al.21 reported that various contents of hydrochloric acid could lead to different crystallizations of TiO2. Biphasic TiO2 with different contents of anatase and rutile have been successfully prepared in an acidic hydrothermal system by Li et al.22 Tartaric acid (C4H6O6) was employed as the phase content regulator and TiCl3 as the titanium source, and result demonstrated that TiO2 with 77% anatase and 23% rutile had the optimized photocatalytic performance. However, K2TiO(C2O4)2 as precursor and H2O2 as phase content regulator to adjust the anatase and rutile contents of biphasic TiO2 has not been reported. Hence, it is of profound significance to adjust the anatase and rutile contents to further study the photocatalytic performance of biphasic TiO2.
This work aims to promote the photodegradation of organic pollutants by synthesizing a novel kind of spindle-like biphasic TiO2 nanorods via hydrothermal-calcination route. The anatase and rutile contents in biphasic TiO2 were adjusted by controlling different volumes of H2O2. The influence of H2O2 volume on the photocatalytic performance of biphasicTiO2 was discussed and the mechanism of photocatalytic degradation was explored.
2. Experimental
2.1. Materials
Potassium titanium oxalate (K2TiO(C2O4)2) was purchased from Shanghai Titan Technology Co., Ltd. (Shanghai, China). Hydrogen peroxide (H2O2, 30%) and nitric acid (HNO3, 65%) were provided by Jiangsu Tongsheng Chemical Reagent Co., Ltd. (Wuxi, China). Absolute ethanol was obtained from Sinopharm Chemical Reagent Co., Ltd. (Shanghai, China). All the reagents were of analytical grade and used without further purification.2.2. Sample preparation
In a typical synthetic procedure: K2TiO(C2O4)2 (5 mmol) was completely dissolved in a certain volume of H2O2 (30%) and deionized water under magnetic stirring to obtain a mixture solution of 50 mL. 65% HNO3 (1.7 mL) was added dropwise into the aforementioned solution to obtain the precursor solution. The solution was then sealed within a Telfon-lined autoclave (150 mL) and maintained 150 °C for 12 h. After the vessel was cooled down to room temperature naturally, the precipitate was centrifuged and washed three times by deionized water and absolute ethanol, and dried at 60 °C. Subsequently the dry powder was calcined at 500 °C in muffle furnace for 4 h and pulverized to biphasic TiO2 powder. The volumes of 30% H2O2 were 0 mL, 5 mL, 10 mL, 15 mL, 20 mL, 25 mL and 30 mL, and the samples were denoted as S-0, S-5, S-10, S-15, S-20, S-25 and S-30, respectively.2.3. Characterization
The X-ray diffractometer (XRD) (PANalytical, Dutch) was performed to analyze the phase of the obtained sample. The morphology of the sample was observed by Nova Nano SEM 450 field emission scanning electron microscope (FEI, America) and JEM-2100F field emission transmission electron microscope (JEOL, Japan). Optical absorption spectrum was detected by TU-1901 UV-vis DRS (Persee, China). The elemental composition was further revealed by ESCALAB 250Xi X-ray photoelectron spectrometer model (Thermo Fisher Scientific, America). A fully automatic specific surface and pore analyzer model TriStar II 3020 (Micromeritics, America) was applied to evaluate the specific surface area, total pore volume, and average pore diameter of the sample.2.4. Photocatalytic activity measurement
Methylene blue (MB) was employed as a simulated pollutant. A time-dependent experiment was conducted to investigate the photocatalytic activity in the degradation of MB by the as-prepared sample. Typically, the sample (0.1 g) was scattered into MB solution (100 mL, 20 mg L−1). Before light illumination, the mixed suspension of MB and sample were stirred for 30 min to reach the adsorption–desorption equilibrium. Therewith the mixed solution was irradiated by a 300 W Xe lamp (LS-SXE300/300UV). MB solution (3 mL) was sampled at 5 min interval and centrifuged to remove the particles. The absorbance of MB solution was recorded by the maximum absorption-band at λ = 664 nm on a UV-vis spectrophotometer.Repeat experiments were carried out to evaluate the photocatalytic stability of the sample. S-30 was selected as the target object. After the first photocatalytic degradation, aqueous MB (2 mL, 1 g L−1) and deionized water were consecutively added in the residual solution to obtain mixed solution (100 mL). The above process was repeated two times to test the duration of the photocatalytic performance. The photocatalytic activity of the sample was determined by degradation rate, which was calculated by eqn (1):
 | (1) |
Langmuir–Hinshelwood pseudo-first-order kinetic model was applied to investigate the kinetics of photocatalytic performance in the photodegradation of MB, as demonstrated in eqn (2):
| ln(C0/Ct) = Kt | (2) |
3. Results and discussion
3.1. XRD analysis
Fig. 1 illustrates the XRD patterns of biphasic TiO2 prepared with different H2O2 volumes. As shown in Fig. 1, XRD diffractogram of TiO2 exhibited the main peaks at 25.28°, 36.98°, 37.93°, 48.34°, 53.99°, 54.93°, 62.69°, 68.84°, 70.09° and 75.03°, corresponding to (101), (103), (004), (200), (105), (211), (204), (113), (220) and (215), which coincided with the tetragonal anatase TiO2 (JCPDS no. 21-1272). The main XRD peaks of rutile TiO2 at about 27.33°, 36.09°, 41.23°, 44.14°, 54.36°, 56.46°could be indexed to (110), (101), (111), (210), (211) and (220), which were in accordance with the standard card (JCPDS no. 21-1276). No other diffraction peaks were observed in the XRD pattern, indicating no other impurities generated in the preparation of TiO2. All the patterns suggested the existence of anatase and rutile crystalline phases. The content of rutile phase was calculated by eqn (3):
 | (3) |
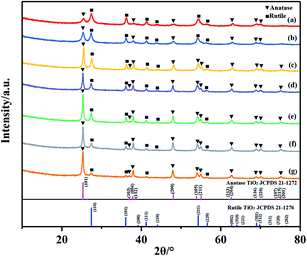 | ||
| Fig. 1 XRD patterns of TiO2 prepared with different volumes of H2O2: (a) S-0, (b) S-5, (c) S-10, (d) S-15, (e) S-20, (f) S-25 and (g) S-30. | ||
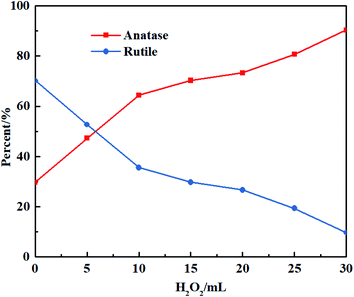
Fig. 2 depicts the influence of H2O2 volume on the contents of anatase and rutile in the biphasic TiO2. With increasing H2O2 volume, the contents of anatase TiO2 and rutile TiO2 enhanced and declined, respectively. The as-prepared sample contained more rutile TiO2 than anatase TiO2 without the presence of H2O2, which could be ascribed to the remarkable differences in the growing rate and surface energy. When H2O2 was added, anatase TiO2 gradually came up with rutile TiO2 in content and outnumbered rutile ultimately. The explanation might be that: hydrolysis occurred in K2TiO(C2O4)2 to generate hydrogen titanate, which was likely transformed into rutile TiO2 under the acid condition.27 With the addition of H2O2, [C2O4]2− was substituted by excess O2− in the acid medium from H2O2 to form peroxo-complexes.28 Afterwards, the oxygen was released via a complex decomposition reaction, and amorphous TiO2 accumulated toward oxygen and anatase TiO2 was formed as a result. The TiO6 octahedron was inclined to face sharing, leading to more generation of anatase TiO2. More oxygen was produced as the increasing addition of H2O2, which further enhanced the anatase content. The entire reactions can be formulated as follows:
| K2TiO(C2O4)2 + 2H2O2 + H2O → TiO2 + K2CO3 + 3H2CO3 | (4) |
 | (5) |
3.2. SEM observation
The morphology of as-synthesized samples was observed by SEM. As illustrated in Fig. 3, the morphologies of biphasic TiO2 before and after calcination were spindle-like nanorods, which were approximately 300 nm in length and 50 nm in width. It was considered that the biphasic TiO2 before calcination was prone to agglomerate. And the biphasic TiO2 after calcination possessed more distinctive nanorod shape.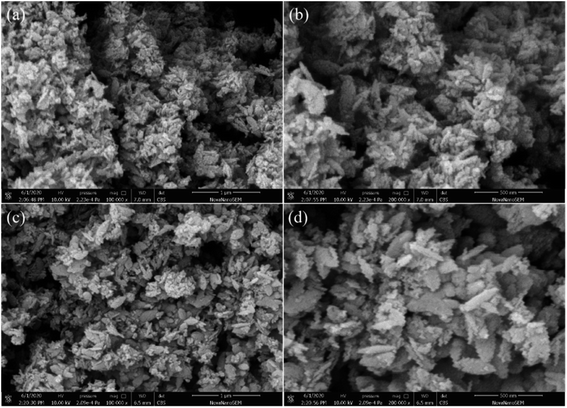 | ||
Fig. 3 SEM photos of S-30: (a) before calcination (×100![[thin space (1/6-em)]](https://www.rsc.org/images/entities/char_2009.gif) 000), (b) before calcination (×200 000), (b) before calcination (×200![[thin space (1/6-em)]](https://www.rsc.org/images/entities/char_2009.gif) 000), (c) after calcination (×100 000), (c) after calcination (×100![[thin space (1/6-em)]](https://www.rsc.org/images/entities/char_2009.gif) 000) and (d) after calcination (×200 000) and (d) after calcination (×200![[thin space (1/6-em)]](https://www.rsc.org/images/entities/char_2009.gif) 000). 000). | ||
3.3. TEM observation
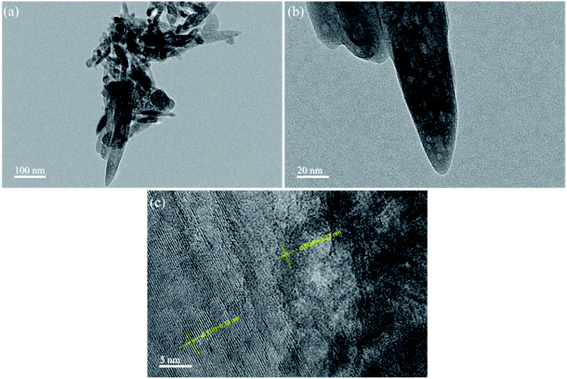
Fig. 4 reveals the TEM images of S-30. From Fig. 4(a), the aggregates were assembly of spindle-like nanorods with length of about 300 nm and width of about 50 nm, which was in agreement with the SEM observation. Fig. 4(b) indicated that the mesoporous structure was distributed in the biphasic TiO2 nanorod, suggesting that the prepared biphasic TiO2 was a mesocrystalline material. HRTEM image of biphasic TiO2 is displayed in Fig. 4(c). The lattice fringe spacings of d = ∼0.32 nm and 0.23 nm were consistent with (110) crystal plane of rutile TiO2 and (004) crystal plane of anatase TiO2, separately. The result of HRTEM was well in accordance with XRD pattern, which further confirmed that the as-prepared TiO2 had a biphasic structure.3.4. UV-vis DRS analysis
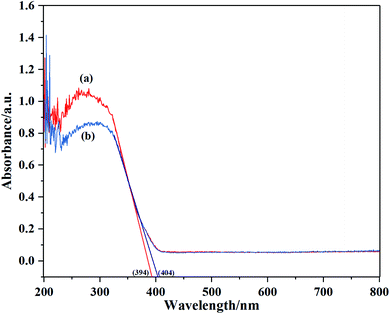
The UV-vis DRS of S-30 and P25 are illustrated in Fig. 5. It was worth noting that the prepared biphasic TiO2 and P25 basically had no absorption property in the visible light region (>420 nm) but outstanding absorption in the ultraviolet light region. The absorption edges estimated for S-30 and P25 were at 404 nm and 394 nm, which were corresponding to band gaps of 3.07 eV and 3.15 eV, respectively. It was noted that S-30 performanced better photocatalytic activity compared to P25. One of the possible reason was that narrow band gaps of nano-photocatalyst lead to high utilization of visible light.3.5. XPS analysis
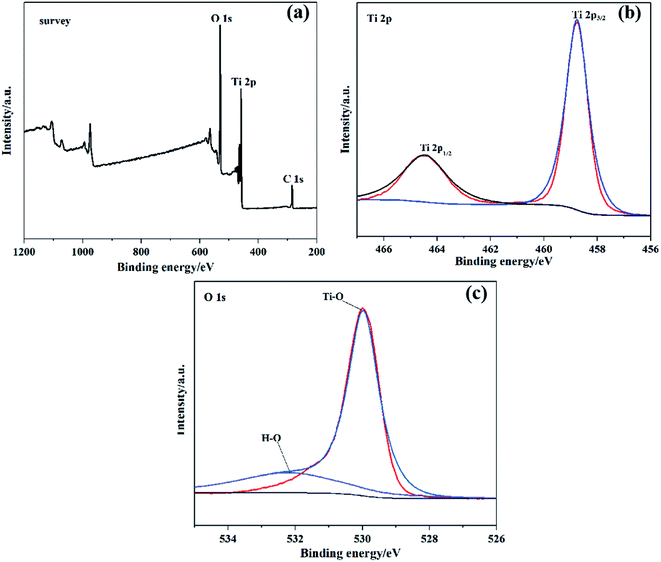
Fig. 6 demonstrates the XPS spectrum of biphasic TiO2 and the peak fitting diagrams of each constituent element. As shown in Fig. 6(a), the peak at 284.8 eV belonged to the characteristic peak of C 1s, which could be ignored as that may be the oil-contaminated carbon brought by the measuring instrument. It was observed that the biphasic TiO2 was composed of two elements, titanium and oxygen. Fig. 6(b) displayed the Ti 2p spectrum, the peaks at 464.5 eV and 458.7 eV in the illustration were consistent with Ti 2p1/2 and Ti 2p3/2 respectively. The interval between the two peaks was 5.7 eV, which featured typical characteristics of Ti4+.29 Fig. 6(c) exhibited two fitted peaks of the O 1s spectrum at 530.4 eV and 532.2 eV, which were the binding energies indexed to lattice oxygen and the hydroxyl group (–OH).303.6. BET analysis
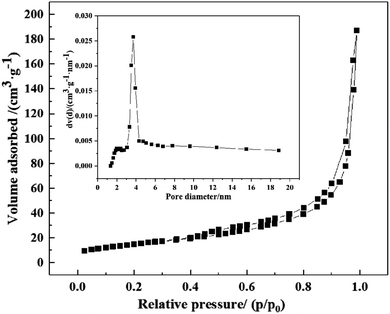
In order to further prove that the prepared TiO2 was a mesoporous material, specific surface area, pore volume and average diameter of S-30 were measured by adsorption–desorption isotherm and pore size distribution curve illustrated in Fig. 7. The isotherm exhibited type IV with a H3 type hysteresis loop, indicating the mesoporous structure of S-30.28,31 S-30 possessed high specific surface area of ∼54.16 m2 g−1 with total pore volume of ∼0.2893 cm3 g−1 and average pore diameter of ∼21.36 nm, which were consistent with the TEM observation and the prepared sample was proved to be mesogenic. A large specific surface area and small pore size provide many favorable advantages including supplying more active sites, improving light absorption and utilization, and increasing the contact area with degraded contaminants. They are also conducive for the nano-photocatalysis to the transport of photogenerated carriers. Thereby S-30 exhibited an exceptional high photocatalytic activity.3.7. Photocatalytic performance and stability
Fig. 8(a) presents photocatalytic degradation curves of TiO2 prepared with different H2O2 volume. As can be observed, all the prepared biphasic TiO2 had excellent photodegradation towards MB solution within 30 min, in that biphasic TiO2 can form heterogeneous interfaces, separate electron–hole pairs and inhibit the recombination of carriers. The photocatalytic activity of the samples ascended with the increase in anatase content, because anatase has preferable photocatalytic performance than rutile.32,33 Thereinto, S-30 with the anatase content of 90.33% had the highest photodegradation rate on MB solution. The pseudo-first-order kinetic curves of the photocatalytic degradation of MB solution by biphasic TiO2 are shown in Fig. 8(b), the pseudo-first-order rate constant K enlarged with increasing anatase content. S-30 exhibited superior photocatalytic activity (K = 0.19159 min−1) than P25 (K = 0.13251 min−1) in the decomposition of MB solution.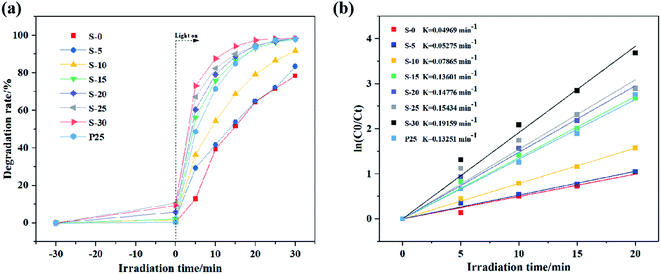 | ||
| Fig. 8 Photocatalytic degradation of MB solution by biphasic TiO2 and P25: (a) photodegradation curves and (b) pseudo-first-order kinetic curves. | ||
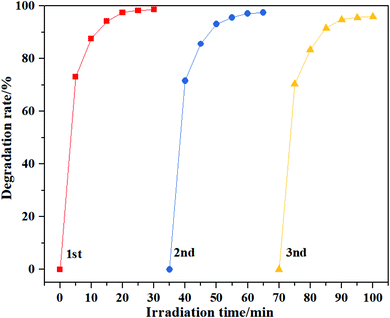
The repeated experiments of MB photodegradation were conducted to evaluate S-30 stability. After three consecutive reaction cycles, it was observed that S-30 exhibited no obvious decrease in the photocatalytic activity, the photodegradation rate was reduced by 5% in Fig. 9. The results demonstrated that S-30 had appreciable stability to photocatalyze the degradation of organic contaminants.
3.8. Photocatalytic mechanism
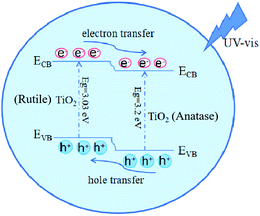
According to all above results, the schematic of photocatalytic mechanism of biphasic TiO2 is illustrated in Fig. 10. The bandgaps of anatase TiO2 and rutile TiO2 were 3.2 eV and 3.03 eV.34 The electrons of the biphasic TiO2 were stimulated and transferred to the conduction band (CB) under light illumination. Owing to the difference in the band potentials, the photogenerated electrons transferred from the rutile CB to the anatase CB. Simultaneously the photogenerated holes migrated from the valence band (VB) of anatase to the rutile VB, resulting in the formation of anatase and rutile heterogeneous interfaces.35 The biphasic TiO2 composed of anatase and rutile therefore had an excellent charge separation efficiency, which improved the photocatalytic activity of the biphasic TiO2.4. Conclusions
The biphasic TiO2 was successfully synthesized in the presence of HNO3 and H2O2 via hydrothermal-calcination route, with K2TiO(C2O4)2 as titanium source. By changing the H2O2 volume, the ratio of anatase and rutile in the biphasic TiO2 was adjusted. The content of anatase TiO2 and its photocatalytic activity improved with the addition of H2O2. When the H2O2 volume reached 30 mL, the biphasic TiO2 composed of 90.33% anatase and 9.67% rutile was spindle-like nanorods and exhibited excellent photocatalytic efficiency and stability. After three times of repeated experiments, the photocatalytic degradation rate of MB solution remained as high as 95%. The adjustment of the anatase and rutile contents provides a neoteric strategy for other semiconductor heterogeneous junction materials to enhance the photocatalytic activity.Conflicts of interest
There are no conflicts to declare.References
- M. Ye, Z. Chen, W. Wang, J. Shen and J. Ma, J. Hazard. Mater., 2010, 184, 612–619 CrossRef CAS
.
- I. J. Ani, U. G. Akpan, M. A. Olutoye and B. H. Hameed, J. Cleaner Prod., 2018, 205, 930–954 CrossRef CAS
.
- I. Ali, M. Suhail, Z. A. Alothmanc and A. Alwarthan, RSC Adv., 2018, 8, 30125–30147 RSC
.
- Y. Lan, Y. Lu and Z. Ren, Nano Energy, 2013, 2, 1031–1045 CrossRef CAS
.
- A. Miyoshi, S. Nishioka and K. Maeda, Chem.–Eur. J., 2018, 24, 18204–18219 CrossRef CAS
.
- B. Zhang, M. Zhang, L. Zhang, P. A. Bingham, W. Li and S. Kubuki, Appl. Surf. Sci., 2020, 530, 147233 CrossRef CAS
.
- Y. Zhang, G. Duoerkun, Z. Shi, W. Cao, T. Liu, J. Liu, L. Zhang, M. Li and Z. Chen, J. Colloid Interface Sci., 2020, 571, 213–221 CrossRef CAS
.
- D. Zhao and X. Wu, Mater. Lett., 2018, 210, 354–357 CrossRef CAS
.
- J. Hu, S. Zhang, Y. Cao, H. Wang, H. Yu and F. Peng, ACS Sustainable Chem. Eng., 2018, 6, 10823–10832 CrossRef CAS
.
- E. Assayehegn, A. Solaiappan, Y. Chebude and E. Alemayehu, Appl. Surf. Sci., 2020, 515, 145966 CrossRef CAS
.
- G. Žerjav, M. S. Arshad, P. Djinović and J. Zavašnik, Appl. Catal., B, 2017, 209, 273–284 CrossRef
.
- Y. Wang, N. Lu, M. Luo, L. Fan, K. Zhao, J. Qu, J. Guan and X. Yuan, Appl. Surf. Sci., 2019, 463, 234–243 CrossRef CAS
.
- K. K. Mandari, B. S. Kwak, A. K. R. Police and M. Kang, Mater. Res. Bull., 2017, 95, 515–524 CrossRef CAS
.
- L. Luo, J. Long, S. Zhao, J. Dai, L. Ma, H. Wang, L. Xia, L. Shu and F. Jiang, Process Saf. Environ. Prot., 2019, 130, 77–85 CrossRef CAS
.
- H. Tong, S. Ouyang, Y. Bi, N. Umezawa, M. Oshikiri and J. Ye, Adv. Mater., 2012, 24, 229–251 CrossRef CAS
.
- H. Zhu, D. Chen, D. Yue, Z. Wang and H. Ding, J. Nanopart. Res., 2014, 16, 2632 CrossRef
.
- C. Xue, T. Zhang, S. Ding, J. Wei and G. Yang, ACS Appl. Mater. Interfaces, 2017, 9, 16091–16102 CrossRef CAS
.
- C. Chi, J. Pan, M. You, Z. Dong, W. Zhao, C. Song, Y. Zheng and C. Li, J. Phys. Chem. Solids, 2018, 114, 173–178 CrossRef CAS
.
- J. Lyu, L. Zhou, J. Shao, Z. Zhou, J. Gao, Y. Dong, Z. Wang and J. Li, Chem. Eng. J., 2020, 391, 123602 CrossRef CAS
.
- X. Zuo, K. Chang, J. Zhao, Z. Xie, H. Tang, B. Li and Z. Chang, J. Mater. Chem. A, 2016, 4, 51–58 RSC
.
- L. E, C. Hu, K. Hu, W. Zhao, J. Cui, Q. Xiong, Z. Guo and Z. Liu, Solid State Sci., 2019, 88, 36–40 CrossRef
.
- H. Li, X. J. Shen, Y. D. Liu, L. Z. Wang, J. Y. Lei and J. L. Zhang, J. Alloys Compd., 2015, 646, 380–386 CrossRef CAS
.
- C. X. Wang, Y. Ren, J. C. Lv, Q. Q. Zhou, Z. P. Ma, Z. M. Qi, J. Y. Chen, G. L. Liu, D. W. Gao, Z. Q. Lu, W. Zhang and L. M. Jin, Appl. Surf. Sci., 2017, 396, 1840–1848 CrossRef CAS
.
- K. K. Hu, L. E, D. Zhao, C. Y. Hu and J. Cui, CrystEngComm, 2018, 20, 3363–3369 RSC
.
- Z. M. Qi, K. Wang, Y. L. Jiang, Y. P. Zhu, X. M. Chen, Q. Tang, Y. Ren, C. H. Zheng, D. W. Gao and C. X. Wang, Cellulose, 2019, 26, 8919–8937 CrossRef CAS
.
- W. W. Fu, G. D. Li, Y. Wang, S. J. Zeng, Z. J. Yan, J. W. Wang, S. G. Xin, L. Zhang, S. W. Wu and Z. T. Zhang, Chem. Commun., 2018, 54, 58–61 RSC
.
- J.-K. Oh, J.-K. Lee, H.-S. Kim, S.-B. Han and K.-W. Park, Chem. Mater., 2010, 22, 1114–1118 CrossRef CAS
.
- L. L. Lai, L. L. Huang and J. M. Wu, RSC Adv., 2014, 4, 49280–49286 RSC
.
- J. M. Wu and H. X. Xue, J. Am. Ceram. Soc., 2009, 92, 2139–2143 CrossRef CAS
.
- Y. Luo, J. Luo, W. Zhou, X. Qi, H. Zhang, D. Y. W. Yu, C. M. Li, H. J. Fan and T. Yu, J. Mater. Chem. A, 2013, 1, 273–281 RSC
.
- M. Thommes, K. Kaneko, A. V. Neimark, J. P. Olivier, F. Rodriguez-Reinoso, J. Rouquerol and K. S. W. Sing, Pure Appl. Chem., 2015, 87, 1051–1069 CAS
.
- S. Lee, A. Y. Cho, Y. S. Rim, J. Y. Park and T. Choi, Coatings, 2020, 10, 557 CrossRef CAS
.
- J. F. Zhang, P. Zhou, J. J. Liu and J. G. Yu, Phys. Chem. Chem. Phys., 2014, 16, 20382–20386 RSC
.
- V. Pfeifer, P. Erhart, S. Li, K. Rachut, J. Morasch, J. Brötz, P. Reckers, T. Mayer, S. Rühle, A. Zaban, I. Mora Seró, J. Bisquert, W. Jaegermann and A. Klein, J. Phys. Chem. Lett., 2013, 4, 4182–4187 CrossRef CAS
.
- L. Li, M. Zhang, Y. Liu and X. Zhang, J. Colloid Interface Sci., 2014, 435, 26–33 CrossRef CAS
.
| This journal is © The Royal Society of Chemistry 2020 |

