 Open Access Article
Surface chemistry dictates stability and oxidation state of supported single metal catalyst atoms†
Konstantinos
Alexopoulos
 and
Dionisios G.
Vlachos
 *
*
Department of Chemical and Biomolecular Engineering, Catalysis Center for Energy Innovation, University of Delaware, 221 Academy St., Newark, DE 19716, USA. E-mail: vlachos@udel.edu
First published on 2nd January 2020
Abstract
Single atom catalysts receive considerable attention due to reducing noble metal utilization and potentially eliminating certain side reactions. Yet, the rational design of highly reactive and stable single atom catalysts is hampered by the current lack of fundamental insights at the single atom limit. Here, density functional theory calculations are performed for a prototype reaction, namely CO oxidation, over different single metal atoms supported on alumina. The governing reaction mechanisms and scaling relations are identified using microkinetic modeling and principal component analysis, respectively. A large change in the oxophilicity of the supported single metal atom leads to changes in the rate-determining step and the catalyst resting state. Multi-response surfaces are introduced and built cheaply using a descriptor-based, closed form kinetic model to describe simultaneously the activity, stability, and oxidation state of single metal atom catalysts. A double peaked volcano in activity is observed due to competing rate-determining steps and catalytic cycles. Reaction orders of reactants provide excellent kinetic signatures of the catalyst state. Importantly, the surface chemistry determines the stability, oxidation, and resting state of the catalyst.
1. Introduction
Single atom catalysts (SACs) possess different properties from their conventional nanoparticle counterparts due to their strong coupling with the support. Although descriptor-based modeling and scaling relations have long been applied for in silico prediction of metal nanoparticles,1,2 fundamental insights and such relations at the single atom limit are currently lacking. Early attempts on developing descriptor-based models for SACs3 have neglected changes in the catalyst resting state (i.e., the most abundant catalyst state) and the rate-determining step (RDS) when screening catalytic materials, following typical approaches for extended metal surfaces.4 Importantly, activity maps constructed using a few intuitively-selected descriptors (i.e., adsorption energies of reactants) do not address either catalyst stability or oxidation state, which are crucial topics for SACs.Increasingly stringent environmental regulations and the high cost of noble metals have recently motivated the use of SACs in catalytic emission control. CO oxidation is a key reaction in the catalytic converter and has served as a prototype reaction for fundamental studies over many decades. The three-way catalyst is very effective at high temperatures but loses its performance at cold startup conditions due to CO poisoning.5 Thus, there is a need to lower the catalyst light-off temperature.6 SACs could potentially improve performance and cut down the cost.7 The cost could be further reduced by replacing the platinum group metals (PGM) of three-way catalysts with non-precious transition state metals.
In the present work, we develop a kinetic model for CO oxidation over a number of atomically-dispersed metals on alumina. Density functional theory (DFT) calculations are performed for the key steps and intermediates on different single metal atoms to unravel correlations and descriptors among data using principal component analysis (PCA). A descriptor-based multi-metal kinetic model reduction is performed for the least and the most oxophilic metals. The oxidation state and the diffusion of active catalyst species are investigated under reaction conditions. This allows one to construct multi-response maps, which reveal simultaneously catalyst activity, stability, spectroscopic information, and phase behavior, to suggest promising catalytic materials. To our knowledge, such multi-response surfaces and the coupling of surface chemistry with catalyst stability are introduced herein for the first time. We demonstrate that the ability of a catalyst to be in thermodynamic equilibrium with its environment of a given chemical potential depends on the material itself. This finding has important ramifications regarding the oxidation state of the catalyst as seen by X-ray absorption near-edge structure (XANES) spectroscopy.
2. Computational methods
The (100) facet of γ-Al2O3 was chosen as the support due to its abundance in the Wulff construction8 and its possession of anchoring sites for single metal atoms (Fig. 1). Herein, the optimized 2 × 1 supercell of (100) γ-Al2O3 was used as reported in Christiansen et al.9 The active site was created by placing a single metal atom on the alumina surface. The most favorable position of a single metal atom was found to be near the aluminum site A (Fig. 1).10 The bottom atomic layer of alumina was held fixed, while the rest of the atoms were allowed to relax. A vacuum gap of 15 Å and a dipole correction were included to separate subsequent slabs.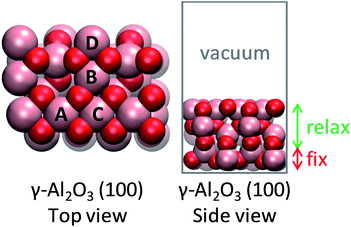 | ||
| Fig. 1 Structure of alumina support. Inequivalent octahedral Al sites are labeled. Color code: red, O; pink, Al. | ||
Spin-polarized periodic DFT calculations were performed using the Vienna Ab initio Simulation Package (VASP)11–14 and the projector-augmented wave (PAW) method.15,16 The exchange–correlation energies were calculated on the basis of the generalized gradient approximation (GGA) according to Perdew and Wang (PW91).17,18 The plane-wave energy cutoff was set to 400 eV, while the Brillouin zone was sampled using a 3 × 3 × 1 Γ-centered k-point mesh. A maximum force convergence criterion of 0.05 eV Å−1 was used and each self-consistency loop was iterated until a convergence level of 10−6 eV. Atomic charges were calculated using Bader analysis19 as implemented by Henkelman et al.20 To obtain formal charges, a calibration of Bader charges was first performed using bulk references with known oxidation states as shown in the ESI.† Transition state search was performed using the nudged elastic band (NEB) to find an initial guess, which was then used to initialize dimer calculations.21,22 Normal mode analysis was performed using a Partial Hessian Vibrational Analysis (PHVA),23,24 considering only the adsorbates on the alumina surface to be free for calculating numerically the Hessian matrix.
Standard Gibbs free energies for reactants, products, and transition states were calculated using statistical thermodynamics.25 The partition functions for gas-phase species included vibrational, rotational, and translational degrees of freedom, while only vibrational contributions were taken into account for surface species. Reaction rate coefficients were computed using transition state theory and were incorporated into a mean-field single-site microkinetic model as described in our prior work.10 Despite the reaction thermodynamics being internally consistent, the gas-phase reaction energy for CO oxidation as calculated by DFT (PW91) deviates significantly (by ca. 50 kJ mol−1) from the experimental gas-phase thermochemistry (NIST database).26 Nevertheless, this error is accounted for in the microkinetic model by adjusting the adsorption/desorption steps using the methodology described by Wittreich et al.27 In addition, prior work on alumina with PW91 as the functional has shown that this first-principles-based microkinetic modeling approach is able to describe well the experimental observations.10,28
Finally, since oxidation reactions involve oxygen, the oxophilicity of the supported single atom should be crucial to understanding catalytic performance. The oxygen adsorption energy is used as a measure of metal oxophilicity.29 As seen in Fig. S1 of the ESI,† the oxophilicity of metal atoms varies significantly and increases in the order: Pd < Ag < Cu < Fe. Since Pd and Fe atoms exhibit the lowest and highest oxophilicity, respectively, the reaction mechanism is thoroughly investigated on them. The full microkinetic models for CO oxidation on alumina-supported Pd and Fe atoms are available in the ESI.† It is worth noting that in the presence of CO2, formation of carbonates can occur in some cases (e.g., on Fe-based SAC, Fig. S7†). Nevertheless, as we are interested in kinetically relevant reaction conditions (i.e., very low CO conversion), we have ignored the presence of gas-phase CO2 in the following simulations (and hence the formation of carbonate species) and considered only O2 and CO, i.e., the reactant composition.
3. Results & discussion
3.1 Reaction mechanism and metal oxidation state
CO oxidation on alumina-supported SACs is found to proceed via the catalytic cycles shown in Fig. 2. In the first catalytic cycle and after co-adsorption of O2 and CO on the active site, CO abstracts one oxygen atom to produce CO2 in a reaction that is hereafter called as the first CO oxidation without co-adsorbed CO: CO*MO2 → CO2 + MO (R6). The catalytic cycle is completed after a second CO molecule adsorbs and reacts with the remaining oxygen atom to produce the second CO2 molecule: CO*MO → CO2 + M (R9). Alternatively, and due to the flexibility of the single metal atom to accommodate several adsorbed molecules at once (namely two CO molecules and one O2 molecule), the first CO oxidation in the second catalytic cycle occurs in the presence of an extra co-adsorbed CO molecule, i.e., from a dicarbonyl state (hereafter called as the first CO oxidation with co-adsorbed CO): 2CO*MO2 → CO2 + CO*MO (R7).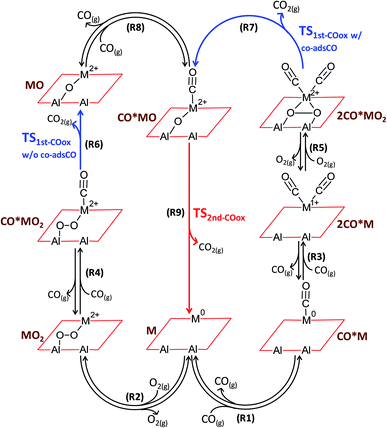 | ||
| Fig. 2 Coupled catalytic cycles. Reaction scheme for CO oxidation on alumina-supported single metal atoms (M = Pd, Fe, Cu, Ag). Formal oxidation states for the generic metal element M are obtained from the calibrated Bader charge analysis as an average of the investigated elements (see ESI†). | ||
Fig. 3 shows the effect of temperature on the kinetically relevant catalyst states and reaction steps for the alumina-supported Pd and Fe atoms. On Pd, low temperatures favor the co-adsorption of O2 with two CO molecules, 2CO*PdO2. Upon increasing the reaction temperature, an abundance of Pd carbonyl species on the alumina surface, CO*Pd, occurs. The oxidation of the first CO is always kinetically relevant on Pd, either with (only at low temperatures) and/or without co-adsorbed CO. On Fe, CO*FeO is the dominant state at low temperatures and FeO dominates at high temperatures; these states are near the end of the catalytic cycle. The RDS (determined via sensitivity analysis) entails the oxidation of the second CO molecule, CO*FeO → CO2 + Fe, and is consistent with CO*FeO and FeO being the low and high temperature catalyst resting state, respectively (see Fig. 3).
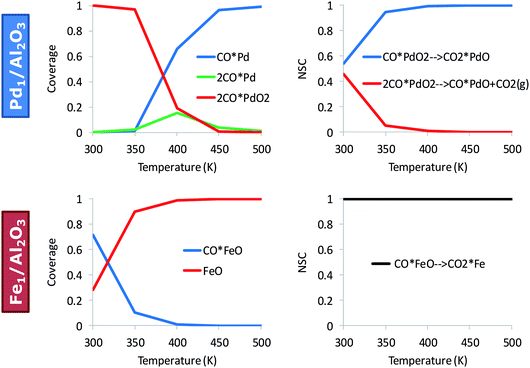 | ||
| Fig. 3 Kinetically relevant catalyst states and reaction steps depend on the material. Surface coverages (left) and normalized sensitivity coefficients (NSC) (right) for CO oxidation on Pd1/Al2O3 and Fe1/Al2O3; pCO = pO2 = 0.1 bar. The full microkinetic model of Table S1† is used for these simulations. | ||
The shift of the RDS further down the CO oxidation pathway from the Pd-based to the Fe-based SAC is illustrated in the energy diagrams of Fig. 4 and has further interesting implications regarding the oxidation state of the SAC seen by XANES. Unlike nanoparticles, single atoms undergo complete oxidation/reduction cycles during the catalytic cycle through a number of discrete states that possess different charge.10 The dominant catalyst state (i.e., the catalyst resting state) is determined from the lifetimes of all states. As a result, a single metal atom can be either metallic- or cationic-like as operating conditions change. Because the energy barrier for the oxidation of the first CO molecule is almost negligible over the Fe atom, the Fe-based SAC is able to reach its (ab initio predicted) thermodynamically most stable state, FeO, at 400 K, pCO = pO2 = 0.1 bar. This is in sharp contrast to the Pd-based SAC where the thermodynamically most stable state, CO*PdO, at the same conditions, differs from the kinetically controlled one, CO*Pd, due to the existence of a large energy barrier for the first CO oxidation (Fig. 4) that separates the two states.
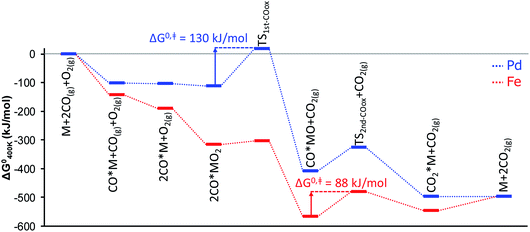 | ||
| Fig. 4 Standard Gibbs free energy diagram for CO oxidation over alumina-supported Pd and Fe atoms. M corresponds to the single metal atom supported on alumina. | ||
Generalizing these concepts, we propose that sufficiently oxophilic metals stay in their thermodynamically most stable state MO because their reduction, via CO*MO → CO2 + M (R9), is kinetically unfavorable. In contrast, noble single metal atoms do not hold on oxygen strongly and this second oxidation step is facile, whereas the formation of CO*MO is kinetically slow. As a result, the dominant state CO*M does not coincide with the most thermodynamically stable CO*MO. We discuss this point quantitatively below by constructing catalyst oxidation maps vs. suitable descriptors.
As expected, the average oxidation state of the SAC is governed by the dominant catalyst state.10 In agreement with their much higher oxophilicity, Fe atoms are always found on average at a cationic state of Fe2+ (Fig. 5). Different from Fe, Pd atoms change oxidation state from Pd2+ to Pd0 with increasing temperature. Clearly, a metallic state does not imply the existence of nanoparticles formed via sintering. Interestingly, the oxidation state of alumina-supported SACs during CO oxidation is highly correlated to the O2 reaction order (Fig. 5). A +2 oxidation state generally corresponds to an O2 reaction order of 0, while the reduction of Pd2+ to Pd0 with increasing temperature results in an increase of the O2 reaction order from 0 to 1. Overall, Fig. 5 clearly shows distinct reaction orders among oxophilic and noble metal SACs that one should be able to measure experimentally. For example, CO reaction orders could be easily used to differentiate between Fe- and Pd-like catalytic behaviors. At the investigated reaction conditions (Fig. 5), the CO reaction order varies from −1 to 0 on the Pd-based SAC, as two or one CO molecules are adsorbed throughout the temperature range. In contrast, it is always positive on the Fe-based SAC due to FeO being the dominant state at modest and high temperatures. In recent work,10 we showed that sintering of a small fraction of metal atoms alters the reaction orders significantly and could be used as a kinetic indicator of the co-existent of small nanoparticles with SACs. Here, we show that reaction orders are sensitive kinetic signatures of the mechanism on different metals.
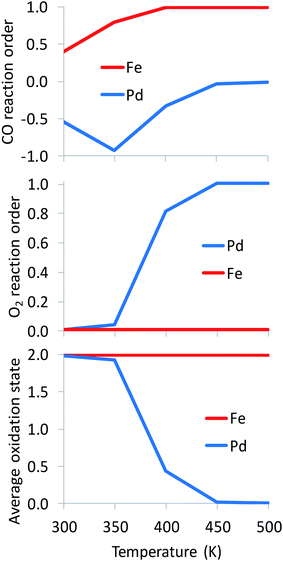 | ||
| Fig. 5 Kinetic signatures and average oxidation state during reaction. Catalysts: Pd1/Al2O3, Fe1/Al2O3; pCO = pO2 = 0.1 bar. The full microkinetic model of Table S1† is used for these simulations. | ||
3.2 Analytical rate expressions
Based on the microkinetic information of the previous section and the reaction scheme shown in Fig. 2, analytical rate expressions can be derived30 following an analysis similar to the one described by John et al.31 These are the so-called a posteriori or expert knowledge-based reduced models, i.e., they use microkinetic (expert) knowledge to carry out the reduction without making a priori assumptions as in standard (textbook) Langmuir–Hinshelwood rate expressions.32–36 These can be validated against the full microkinetic model (see Fig. S6 of ESI†).If the oxidation of the first CO molecule is limiting the CO oxidation rate, as in the case of Pd atoms, then the resulting analytical expression for the turnover frequency (TOF) of CO oxidation is:
On the other hand, if the oxidation of the second CO molecule (R9) is limiting the CO oxidation rate, as in the case of Fe atoms, then the analytical TOF expression for CO oxidation is:
Consistent with their different oxidation state, and unlike most theoretical works assuming the same RDS across catalysts, the rate controlling steps on Pd and Fe differ. Hence, the same rate expression cannot be used to describe atomically dispersed materials with largely different oxophilicity. This finding goes against the common reductionistic approach of using a single RDS across a volcano plot6,7 and underscores the complexity of catalytic reactions, especially those involving oxygen. Although catalyst screening with several competing steps and intermediates has been reported for reactions occurring over unsupported metal surfaces37,38 and homogeneous catalysts,39–43 approaches for supported SACs are missing. In the present study, this change of RDS and catalyst resting state with varying metal oxophilicity is reflected in the analytical rate expressions that apply to the Pd- and Fe-like SACs.
3.3 Scaling relations for activity and stability
Similar to the Sabatier analysis reported for CO oxidation on metal nanoparticles and extended surfaces,44,45 the TOF for CO oxidation over any alumina-supported SAC is determined by the RDS. Keeping in mind that the first and second CO oxidation steps are connected in series (and not in parallel, see Fig. 2), for any metal M, the minimum of the aforementioned rates determines the overall CO oxidation rate, namely, TOF = min{TOF1stCOox, TOF2ndCOox}, with metal M-dependent kinetic and equilibrium parameters (for parallel paths, one simply sums the reaction rates). This concept enables one to compute the TOF on a new metal M without recomputing the entire reaction network via DFT, i.e., with significantly less computational cost. The computational cost can be further reduced by developing correlations, discussed next. To our knowledge, this is the first example where reduced rate expressions are used to construct an activity map (see below) while the RDS changes.Linear correlations for CO oxidation are developed as a function of two uncorrelated descriptors (Pearson correlation coefficient of 0.4), namely CO*M and MO2 free energies with respect to the gas-phase species CO and O2. Principal component analysis on the complete set of data confirms that a single descriptor is not enough to develop these relations (see scree plot in Fig. S10 of ESI†). A bilinear model is used to perform the regression for each reaction intermediate and transition state in the reaction scheme of Fig. 2. The results are presented in Table 1. Kinetic (k) and equilibrium (K) parameters can then be obtained using these free energy correlations with the following formulae:
where kB is the Boltzmann constant, h is the Planck constant, T is the temperature, R is the ideal gas constant, ΔG‡ is the free energy change between the initial and transition state of a reaction, and ΔGads is the free energy change upon adsorption.
| Catalyst state, Yi | Regression coefficient | RMSE (kJ mol−1) | R 2 | ||
|---|---|---|---|---|---|
| a 0 | a 1 | a 2 | |||
| 2CO*M | 31.26 | 1.27 | 0.19 | 19.24 | 0.9851 |
| CO*MO2 | −2.08 | 0.21 | 0.95 | 10.55 | 0.9958 |
| CO*MO | −22.29 | 0.98 | 0.57 | 9.86 | 0.9965 |
| MO | 27.36 | 0.24 | 1.11 | 3.30 | 0.9997 |
| TS1stCOox-w/o coadsCO | 29.17 | −0.21 | 0.83 | 23.40 | 0.9654 |
| TS1stCOox-w/coadsCO | 248.88 | 1.55 | 1.17 | 8.86 | 0.9991 |
| TS2ndCOox | −2.03 | 0.32 | 0.70 | 29.26 | 0.9516 |
Given that SACs can occasionally undergo sintering, characteristic time scales are required in order to assess how long such a catalyst remains stable under reaction conditions. Note that a kinetic consideration of catalyst stability is more challenging than a thermodynamic one considering that coupling between surface chemistry and diffusion phenomena can exist giving rise to multiple possibilities with different time scales. To this end, the mobility of single metal atoms with and without adsorbates on alumina is investigated as a kinetic measure of catalyst stability. Fig. S2 of ESI† indicates that the diffusion of a single Pd atom on alumina is more facile over octahedral Al atoms compared to tetrahedral Al atoms. As seen in Fig. S3 of ESI,† a thorough investigation exposes that the diffusion barrier of (CO)xPdOy species (with x, y = 0, 1, 2) over octahedral Al atoms varies significantly among species. Regardless of the oxidation state of the Pd atom, diffusion becomes more facile by adsorbing one or two CO molecules on PdOy. Yet, binding of oxygen to Pd has a more pronounced effect on diffusion than adsorbing CO. In addition, due to the inherent scatter around the linear scaling relations, the difference between the diffusion of CO*M and M species is in general small (see Fig. S4†). Hence, in what follows, we chose to utilize the scaling relations developed for the diffusion of MOy species (y = 0, 1, 2).
As seen in Fig. 6a, a linear dependence exists between MOy diffusion barriers and CO adsorption strength on metals. As expected, weakly bound metals have low diffusion barriers. Using the linear relations of Fig. 6a, the characteristic time scale for diffusion of each MOy species is calculated as a proxy of stability (Fig. 6b) vs. the CO adsorption free energy, a typical thermodynamic descriptor in kinetic models.
where ρM is the metal density,48dM is the van der Waals diameter of the single metal atom,49SAl2O3 is the surface area of the alumina support (153 m2 g−1),5 and x is a typical metal loading (0.5 wt%).5 The diffusion barrier varies significantly from very low for Ag to high for Fe. As a result, the time scale for two metal atoms to encounter each other, taken as a proxy for Ostwald ripening, varies widely. In addition, the diffusion barriers of MO and MO2 species are much higher than that of their metallic counterparts (M), indicative of increased stability of the former compared to the latter.
3.4 Multi-response maps
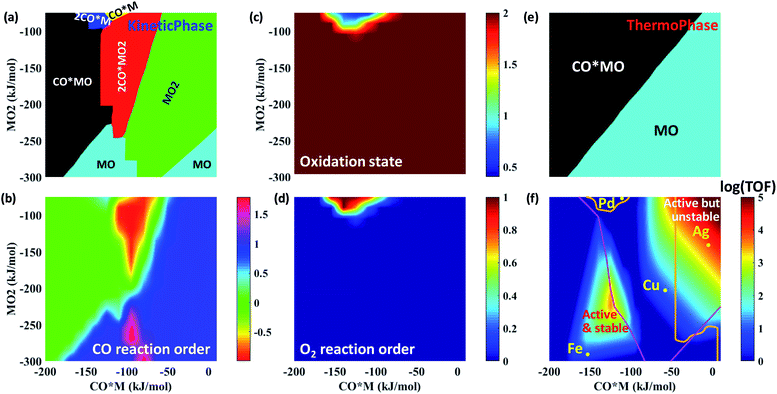
Using the rate expressions and correlations developed in the previous sections, multiple responses are depicted in Fig. 7 over a large descriptor space using the descriptor-based, closed form kinetic model. These multi-response surfaces go beyond prior work focusing solely on activity.3 Dividing the descriptor space into regions displaying different dominant catalyst states reveals a rich kinetic phase behavior (Fig. 7a). For example, at a fixed O2 binding energy of −150 kJ mol−1, the catalyst state changes from CO*MO to 2CO*MO2 to MO2 with decreasing CO binding energy.This kinetic phase diagram controls reaction orders and the oxidation state of the catalyst. Indeed, the response surface of the CO reaction order (Fig. 7b) bears close resemblance to the kinetic phase diagram (Fig. 7a), whereas the O2 reaction order (Fig. 7d) correlates very well with the oxidation state of the catalyst (Fig. 7c). On average, the catalyst is mostly found in a +2 oxidation state (apart from the region around Pd), which is also reflected by the zero O2 reaction order. On the other hand, CO reaction orders can range from −1 (when 2CO*MO2 is dominant) to nearly 2 (in regions where MO2 is dominant). Overall, these results highlight the importance of dominant catalyst states in explaining the observed catalytic performance.
Unexpectedly, the reactivity map of Fig. 7f indicates two regions of high activity, one at high and one at low binding energies. This double maximum activity stems from having a different relevant catalytic cycle operating in each region. Within each region, a volcano appears due to the competition of 1st vs. 2nd CO oxidation as RDS. The boundary lines separating the different RDS are presented in Fig. S11,† where an indicative double peaked volcano is also given for a fixed MO2 energy. Although double peaked volcanoes have been reported elsewhere as a result of competitive adsorption,50,51 our study shows that such behavior results from different catalytic cycles and RDSs. The first peak at relatively low CO and O2 adsorption free energies is associated with the left catalytic cycle of Fig. 2 and results from the competition between first CO oxidation without co-adsorbed CO (i.e., R6: CO*MO2 → CO2 + MO) and second CO oxidation (i.e., R9: CO*MO → CO2 + M) as RDS. In contrast, the second peak at relatively high CO and O2 adsorption free energies is attributed to the right catalytic cycle of Fig. 2 and results from the competition between first CO oxidation with co-adsorbed CO (i.e., R7: 2CO*MO2 → CO2 + CO*MO) and second CO oxidation (i.e., R9: CO*MO → CO2 + M) as RDS. Interestingly, less precious materials, such as Ag, Cu and Fe, outperform atomically dispersed Pd on alumina for CO oxidation.
Traditionally, a catalyst is most often assumed to be in its thermodynamically most stable state. However, Fig. 7a and e indicate that kinetic and thermodynamic phase diagrams do not necessarily agree with each other. For example, at a fixed O2 binding energy of −150 kJ mol−1 and upon decreasing the CO binding energy from −150 to −100 kJ mol−1, the catalyst state changes from CO*MO to 2CO*MO2 based on the kinetic phase diagram, while it remains in the CO*MO state according to the thermodynamic phase diagram. As such, the two phase diagrams agree in the region where the second CO oxidation is rate-determining. Metal atoms below the boundary line that separates the first and second CO oxidation as RDS (Fig. 7f) rest in their equilibrated catalyst state, because the disappearance of this state is slow. In contrast, those above it are non-equilibrated as the most stable catalyst state converts rapidly to another state.
Finally, we discuss catalyst stability. We find that if one considers metallic centers M, one would conclude (based on Fig. 6b) that all SACs sinter rapidly during CO oxidation, inconsistent with experimental data on irreducible supports.5,52–54 Clearly, bare metal atoms M are not suitable to infer catalyst stability. Instead, the kinetically dominant catalyst states need to be identified, and their stability toward sintering has to be studied. This underscores the inherent coupling between kinetics and catalyst stability; the kinetics determines the dominant catalyst states (Fig. 7a), which in turn, dictates the diffusion time (Fig. 6b) and thus the catalyst stability. Our kinetic calculations indicate that the dominant MOy state changes with catalyst (Fig. 7a), e.g., MO2 for Ag and Cu, MO for Fe, and M for Pd. By considering an interatomic diffusion time of one day as a metric of long-term stability and the suitable MOy species (expert knowledge based on kinetics in Fig. 7a rather than the thermodynamically most stable state), we construct a feasible operation region possessing adequate catalyst stability; see the bottom and left part of Fig. 7f delineated by the orange contour lines. Relatively strong CO and O2 binding define sufficiently active and very stable SACs. It is in this feasible region that most active catalysts should be searched. Among the studied metals, Fe is such an example of relatively active and very stable SAC. Interestingly, this finding for Fe is in good agreement with recent experimental work.55
The data in Fig. 6b provides further insight regarding catalyst stability during oxidation and reduction. For example, reduction by H2 of SACs could lead to a change from MO or MO2 to M, resulting in sintering for non-oxophilic metals. In contrast, oxophilic metals, e.g., Fe, may remain single atoms at least for some time, depending on temperature, as they anchor stronger on the support and diffuse slowly.
4. Conclusions
The present study on atomically dispersed supported metal catalysts delineates catalyst activity, stability, and spectroscopic signature (oxidation state) and their interrelations in low temperature CO oxidation. Principal component analysis shows that there are two descriptors for reactivity and a single one for diffusion. A closed form, descriptor-based rate expression provides a cheap way of performing massive calculations to create activity–stability-oxidation state maps. The reaction on highly oxophilic Fe atoms is limited by the oxidation of the second CO molecule reducing FeO to Fe, CO*FeO → CO2 + Fe (R9), and not by the oxidation of the first CO molecule as happens on non-oxophilic Pd atoms, CO*PdO2 → CO2 + PdO (R6). This finding has important implications on the phase behavior of single-atom catalysts; noble metal-like catalysts, unlike the common belief, are out of their thermodynamically stable state, as this state disappears rapidly during the catalytic cycle. In contrast, oxophilic metals oxidize the second CO slowly, due to their high affinity for O, and their most stable state, MO, coincides with their kinetically relevant state. Oxophilic metals remain in their cationic state as conditions changes. Noble metals on the other hand may shift from cationic to metallic state. Thus, a metallic state in XANES and the associated lack of M–M coordination in EXAFS are consistent to having M single atoms rather than nanoparticles. Reaction orders are very sensitive kinetic signatures to the existence of nanoparticles and also to the oxophilicity of the metal. We construct feasibility operation regions and demonstrate for the first time how surface chemistry dictates catalyst stability. The predicted unique catalytic performance of highly dispersed Fe on alumina is in good agreement with recent experimental findings. The coupling of chemistry with catalyst stability and the catalyst oxidation state and most dominant state underscores the complexity of heterogeneous catalysts and the necessity to model simultaneously kinetics and the catalyst state.Conflicts of interest
There are no conflicts to declare.Acknowledgements
The initial part of this work was performed in the framework of the PARTIAL-PGMs project – funded by the European Union's Horizon 2020 Research and Innovation Programme under grant agreement No. 686086. The later part was supported by the Catalysis Center for Energy Innovation, an Energy Frontier Research Center funded by the U.S. Department of Energy, Office of Science, Office of Basic Energy Sciences under Award No. DE-SC0001004.References
- J. K. Norskov, T. Bligaard, J. Rossmeisl and C. H. Christensen, Nat. Chem., 2009, 1, 37 CrossRef CAS PubMed.
- D. A. Hansgen, D. G. Vlachos and J. G. Chen, Nat. Chem., 2010, 2, 484 CrossRef CAS PubMed.
- H. Xu, C. Q. Xu, D. Cheng and J. Li, Catal. Sci. Technol., 2017, 7, 5860 RSC.
- S. Dahl, A. Logadottir, C. J. Jacobsen and J. K. Nørskov, Appl. Catal., A, 2001, 222, 19 CrossRef CAS.
- E. J. Peterson, A. T. DeLaRiva, S. Lin, R. S. Johnson, H. Guo, J. T. Miller, J. H. Kwak, C. H. F. Peden, B. Kiefer, L. F. Allard, F. H. Ribeiro and A. K. Datye, Nat. Commun., 2014, 5, 4885 CrossRef CAS PubMed.
- B. H. Y. Chen and H. L. R. Chang, Johnson Matthey Technol. Rev., 2015, 59, 64 CrossRef.
- B. Qiao, J. X. Liang, A. Wang, J. Liu and T. Zhang, Chin. J. Catal., 2016, 37, 1580 CrossRef CAS.
- M. Digne, P. Sautet, P. Raybaud, P. Euzen and H. Toulhoat, J. Catal., 2004, 226, 54 CrossRef CAS.
- M. A. Christiansen, G. Mpourmpakis and D. G. Vlachos, ACS Catal., 2013, 3, 1965 CrossRef CAS.
- K. Alexopoulos, Y. Wang and D. G. Vlachos, ACS Catal., 2019, 9, 5002 CrossRef CAS.
- G. Kresse and J. Hafner, Phys. Rev. B: Condens. Matter Mater. Phys., 1993, 47, 558 CrossRef CAS PubMed.
- G. Kresse and J. Hafner, Phys. Rev. B: Condens. Matter Mater. Phys., 1994, 49, 14251 CrossRef CAS PubMed.
- G. Kresse and J. Furthmüller, Comput. Mater. Sci., 1996, 6, 15 CrossRef CAS.
- G. Kresse and J. Furthmüller, Phys. Rev. B: Condens. Matter Mater. Phys., 1996, 54, 11169 CrossRef CAS PubMed.
- P. E. Blöchl, Phys. Rev. B: Condens. Matter Mater. Phys., 1994, 50, 17953 CrossRef PubMed.
- G. Kresse and D. Joubert, Phys. Rev. B: Condens. Matter Mater. Phys., 1999, 59, 1758 CrossRef CAS.
- J. P. Perdew and Y. Wang, Phys. Rev. B: Condens. Matter Mater. Phys., 1992, 45, 13244 CrossRef PubMed.
- J. P. Perdew, J. A. Chevary, S. H. Vosko, K. A. Jackson, M. R. Pederson, D. J. Singh and C. Fiolhais, Phys. Rev. B: Condens. Matter Mater. Phys., 1992, 46, 6671 CrossRef CAS PubMed.
- R. F. W. Bader, Atoms in Molecules – A Quantum Theory, Oxford University Press, 1990 Search PubMed.
- G. Henkelman, A. Arnaldsson and H. Jónsson, Comput. Mater. Sci., 2006, 36, 354 CrossRef.
- G. Henkelman and H. Jónsson, J. Chem. Phys., 2000, 113, 9978 CrossRef CAS.
- G. Henkelman and H. Jónsson, J. Chem. Phys., 1999, 111, 7010 CrossRef CAS.
- G. Canduela-Rodriguez, M. K. Sabbe, M.-F. Reyniers, J.-F. Joly and G. B. Marin, J. Phys. Chem. C, 2014, 118, 21483 CrossRef CAS.
- B. A. De Moor, A. Ghysels, M.-F. Reyniers, V. Van Speybroeck, M. Waroquier and G. B. Marin, J. Chem. Theory Comput., 2011, 7, 1090 CrossRef CAS PubMed.
- C. J. Cramer, Essentials of Computational Chemistry: Theories and Models, Wiley, Cicester, 2nd edn, 2005 Search PubMed.
- NIST Chemistry WebBook, NIST Standard Reference Database Number 69, ed. P. J. Linstrom and W. G. Mallard, National Institute of Standards and Technology, Gaithersburg MD, 2005 Search PubMed.
- G. R. Wittreich, K. Alexopoulos and D. G. Vlachos, in Handbook of Materials Modeling: Applications: Current and Emerging Materials, 2018, pp. 1–28 Search PubMed.
- M. A. Christiansen, G. Mpourmpakis and D. G. Vlachos, J. Catal., 2015, 323, 121 CrossRef CAS.
- Q. Tan, G. Wang, A. Long, A. Dinse, C. Buda, J. Shabaker and D. E. Resasco, J. Catal., 2017, 347, 102 CrossRef CAS.
- M. Salciccioli, M. Stamatakis, S. Caratzoulas and D. G. Vlachos, Chem. Eng. Sci., 2011, 66, 4319 CrossRef CAS.
- M. John, K. Alexopoulos, M.-F. Reyniers and G. B. Marin, ACS Catal., 2016, 6, 4081 CrossRef CAS.
- M. Salciccioli, Y. Chen and D. G. Vlachos, Ind. Eng. Chem. Res., 2011, 50, 28 CrossRef CAS.
- S. R. Deshmukh and D. G. Vlachos, Combust. Flame, 2007, 149, 366 CrossRef CAS.
- S. R. Deshmukh, A. B. Mhadeshwar and D. G. Vlachos, Ind. Eng. Chem. Res., 2004, 43, 2986 CrossRef CAS.
- A. B. Mhadeshwar and D. G. Vlachos, Catal. Today, 2005, 105, 162 CrossRef CAS.
- N. Guo, S. Caratzoulas, D. J. Doren, S. I. Sandler and D. G. Vlachos, Energy Environ. Sci., 2012, 5, 6703 RSC.
- T. Bligaard, J. K. Nørskov, S. Dahl, J. Matthiesen, C. H. Christensen and J. Sehested, J. Catal., 2004, 224, 206 CrossRef CAS.
- C. A. Wolcott, A. J. Medford, F. Studt and C. T. Campbell, J. Catal., 2015, 330, 197 CrossRef CAS.
- M. D. Wodrich, B. Sawatlon, E. Solel, S. Kozuch and C. Corminboeuf, ACS Catal., 2019, 9, 5716 CrossRef CAS.
- B. Meyer, B. Sawatlon, S. Heinen, O. A. von Lilienfeld and C. Corminboeuf, Chem. Sci., 2018, 9, 7069 RSC.
- M. D. Wodrich, M. Busch and C. Corminboeuf, Chem. Sci., 2016, 7, 5723 RSC.
- M. Busch, M. D. Wodrich and C. Corminboeuf, Chem. Sci., 2015, 6, 6754 RSC.
- M. Anand and J. K. Nørskov, ACS Catal., 2020, 10, 336 CrossRef CAS.
- H. Falsig, B. Hvolbæk, I. S. Kristensen, T. Jiang, T. Bligaard, C. H. Christensen and J. K. Nørskov, Angew. Chem., Int. Ed., 2008, 47, 4835 CrossRef CAS.
- T. Jiang, D. J. Mowbray, S. Dobrin, H. Falsig, B. Hvolbæk, T. Bligaard and J. K. Nørskov, J. Phys. Chem. C, 2009, 113, 10548 CrossRef CAS.
- P. G. Corradini, F. I. Pires, V. A. Paganin, J. Perez and E. Antolini, J. Nanopart. Res., 2012, 14, 1080 CrossRef.
- M. Watanabe, H. Sei and P. Stonehart, J. Electroanal. Chem. Interfacial Electrochem., 1989, 261, 375 CrossRef CAS.
- CRC handbook of chemistry and physics: a ready-reference book of chemical and physical data, ed. D. R. Lide, CRC press, 1995 Search PubMed.
- S. S. Batsanov, J. Mol. Struct., 2011, 990, 63 CrossRef CAS.
- F. Corvaisier, Y. Schuurman, A. Fecant, C. Thomazeau, P. Raybaud, H. Toulhoat and D. Farrusseng, J. Catal., 2013, 307, 352 CrossRef CAS.
- H. Toulhoat and P. Raybaud, J. Catal., 2003, 216, 63 CrossRef CAS.
- B. C. Gates, Trends in Chemistry, 2019, 1, 99 CrossRef.
- Y. Lou and J. Liu, Ind. Eng. Chem. Res., 2017, 56, 6916 CrossRef CAS.
- M. Moses-DeBusk, M. Yoon, L. F. Allard, D. R. Mullins, Z. Wu, X. Yang, G. Veith, G. M. Stocks and C. K. Narula, J. Am. Chem. Soc., 2013, 135, 12634 CrossRef CAS PubMed.
- I. H. Kim, H. O. Seo, E. J. Park, S. W. Han and Y. D. Kim, Sci. Rep., 2017, 7, 40497 CrossRef CAS PubMed.
Footnote |
| † Electronic supplementary information (ESI) available: Oxidation and diffusion of single metal atoms on alumina, calibration of Bader charges to track the formal oxidation state of the active site, boundary lines separating different RDS regions in the reactivity map, principal component analysis, full microkinetic models, validation of analytical rate expressions, and effect of CO2 on surface coverages during CO oxidation over alumina-supported SACs. See DOI: 10.1039/c9sc05944j |
| This journal is © The Royal Society of Chemistry 2020 |


