The shape selectivity of corannulene dimers based on concave–convex and convex–convex shape complementarity as hosts for C60 and C70†
Li
Wang
 *,
Yan-Li
Liu
,
Sheng-Hui
Chen
,
De
He
,
Quan-Jiang
Li
and
Mei-Shan
Wang
*
School of Physics and Optoelectronics Engineering, Ludong University, Yantai, 264025, Shandong, China. E-mail: wangl@ldu.edu.cn; mswang1971@163.com
First published on 25th November 2020
Abstract
In the formation of noncovalent complexes, the stacking arrangements of corannulene and fullerene are diverse, most of which are combinations of multiple corannulenes and fullerene. Here, a composition ratio of 2![[thin space (1/6-em)]](https://www.rsc.org/images/entities/char_2009.gif) :
:![[thin space (1/6-em)]](https://www.rsc.org/images/entities/char_2009.gif) 1 was selected for the complex between corannulene and fullerene (C60 and C70) to investigate the effects of different superposition modes, including concave–convex and convex–convex interactions, on the stability and third-order nonlinear optical (NLO) properties of the composite materials. It was found that the concave–convex interaction was stronger and it was reported to stabilize the charge-transfer (CT) complex more effectively than the convex–convex interaction. The dispersion range of the concave–convex interaction was larger than that of the convex–convex interaction, which is consistent with the interaction energy results. The packing design with the double convex–convex interactions exhibited the largest linear optical response and third-order NLO response, which showed that the convex–convex interaction was more likely to be excited and cause intermolecular CT as compared to the concave–convex interaction. This work confirmed that the packing arrangement significantly affected the NLO response and will advance the development of NLO crystals.
1 was selected for the complex between corannulene and fullerene (C60 and C70) to investigate the effects of different superposition modes, including concave–convex and convex–convex interactions, on the stability and third-order nonlinear optical (NLO) properties of the composite materials. It was found that the concave–convex interaction was stronger and it was reported to stabilize the charge-transfer (CT) complex more effectively than the convex–convex interaction. The dispersion range of the concave–convex interaction was larger than that of the convex–convex interaction, which is consistent with the interaction energy results. The packing design with the double convex–convex interactions exhibited the largest linear optical response and third-order NLO response, which showed that the convex–convex interaction was more likely to be excited and cause intermolecular CT as compared to the concave–convex interaction. This work confirmed that the packing arrangement significantly affected the NLO response and will advance the development of NLO crystals.
1. Introduction
Supramolecular chemistry, the association of two or more chemical entities and their intermolecular interaction,1 relies on noncovalent interactions, which are the basis of the highly specific processes that occur in supramolecular chemistry.2 There has been considerable research on π⋯π intermolecular interactions3 because of their fundamental role in various chemical crystallization processes4 and biochemical processes.5 Li et al. was committed to the systematic study of the relationship between molecular packing and the nonlinear optical (NLO) performance of the supramolecular-complexes.6 They found that the second-order NLO effect can only be realized when chromophores with D–π–A structures are arranged in a non-centrosymmetric mode. The key to achieving high NLO performance is to utilize π–π interactions and hydrogen bonding by rational molecular design.Along with the discovery of fullerenes, such as spherical carbon molecules C60 and C70 with convex surfaces, it was determined that shape complementarity effectively promotes the π–π intermolecular interactions between curved–curved surfaces.7 Numerous studies have examined the effective binding of fullerenes and other functional groups through non-covalent interactions and observed how host–guest supramolecular systems with specific structures are formed, and then realized their functionalization by regulating the π–π interactions between various functional groups. The development of novel host structures that are combined with the guest fullerene is very meaningful work in host–guest chemistry of fullerenes.8–11 A series of main compounds has been developed, including two different types of compounds. One type consists of rich π-electronic compounds containing the derivatives of ferrocene,12 porphyrin,13 and the corannulene system.14 Another type consists of large ring compounds including the derivatives of cyclodextrin,15,16 calixarene,17 and oligomers.18
Bowl-shaped corannulene (C20H10) naturally offers satisfactory geometric compatibility with the convex surface of fullerenes, which can enhance intermolecular electrostatic interactions for concave–convex and convex–convex interactions.19 Due to its curvature, this compound possesses large dipole moments that provide enhanced π–π intermolecular interactions.20 It has been shown that π–π interactions between pristine C20H10 and C60 can be promoted by the adsorption of the former on a Cu(110)-surface. The apparent height of C60 with respect to C20H10 is thus expected to be approximately 3.4 Å.19
In our previous study, we calculated the complex composed of C20H10 and fullerenes of different sizes,21 which predicted that the complexation of the concave face of C20H10 toward fullerenes would be energetically similar to the π⋯π interactions between homodimers of corannulene.22 However, multiple corannulenes and fullerene are often combined, and therefore, the stacking modes of corannulenes and fullerene are diverse. In this work, composites of corannulenes and fullerene compounded at a ratio of 2![[thin space (1/6-em)]](https://www.rsc.org/images/entities/char_2009.gif) :
:![[thin space (1/6-em)]](https://www.rsc.org/images/entities/char_2009.gif) 1 were explored to determine the influence of various stacking modes on the stability and nonlinear optical properties of composites. The investigation on the effect of different arrangements of fullerene-corannulene complexes on their NLO properties not only provides additional data for the further development of organic and polymer optoelectronic materials through adjustable molecular stacking and non-covalent interactions, but it will also facilitate the further development of more interesting properties.
1 were explored to determine the influence of various stacking modes on the stability and nonlinear optical properties of composites. The investigation on the effect of different arrangements of fullerene-corannulene complexes on their NLO properties not only provides additional data for the further development of organic and polymer optoelectronic materials through adjustable molecular stacking and non-covalent interactions, but it will also facilitate the further development of more interesting properties.
2. Calculation methods
The Gaussian 09W program was used to optimize the geometrical structure at the B3LYP-D3/6-31G(d) level.23 The B3LYP-D3 functional was more applicable, more accurate, and less empirical as compared to that of B3LYP. It is suitable for large van der Waals interaction systems, for example, non-covalent complexes, where dispersion correction (D3) complements the standard Kohn–Sham density functional theory (DFT) determinant.24,25 We also optimized complex 1 at the B3LYP-D3/6-31+G(d) and B97D/6-31+G(d) levels. The geometric structure parameters obtained by the B3LYP-D3/6-31G(d), B3LYP-D3/6-31+G(d), and B97D/6-31+G(d) levels are listed in Table S3 (ESI†). Though the comparison, we found that the results of B3LYP-D3/6-31G(d) were similar to those of B3LYP-D3/6-31+G(d). The distances between the concave face of C20H10 and the convex face of C60 and C70 are 3.47 and 3.46 Å, respectively, which are similar to the previous result of 3.5 Å between C20H10 and C60.21 This indicates that the geometric structure in the original text is relatively reliable.The binding interaction energy (Ebind) of the complex was calculated at the B97D/6-31+G(d) level using the counterpoise (CP) procedure, which can correct the basis set superposition error (BSSE).26,27Ebind can be expressed as:
| Ebind = E(AB)AB − E(A)AB − E(B)B | (1) |
In order to reveal the averaged weak interaction regions and distinguish three different types of noncovalent interactions, (i) π–π interaction, (ii) hydrogen-binding, and (iii) steric hindrance, a pair of very important functions, reduced density gradient (RDG) and sin(λ2)*ρ were used:28
 | (2) |
It is well known that the NLO response is caused by the polarization of the material under the action of a strong electric field. All hyperpolarizabilities in this work are reported in the “T” convention.29
 | (3) |
In this expression, E0 denotes the molecular energy without the applied electric field, and i, j, and k denote different components along the x, y, and z directions, respectively. Fi denotes the Cartesian component of the applied electric field along the i direction. μi denotes the permanent dipole moment along the i direction; αij, βijk, and γijkl are the polarizability, first, and second hyperpolarizability tensors, respectively.
The isotropic average polarizability (α) and second hyperpolarizability (γ) can be expressed as the differential form of dipole moment with respect to the electric field intensity F.
 | (4) |
 | (5) |
The isotropic average polarizability (α) is calculated as:
 | (6) |
The orientationally averaged second hyperpolarizability (γ) has been calculated using the following expression:29
 | (7) |
The γ value was calculated by means of the analytic and finite field hybrid method. This is a method to obtain hyperpolarizability that automatically performs one or more finite-difference methods on the basis of low-order analytic derivatives to obtain high-order derivatives. Here, it is based on third order analytical derivatives, and then automatically conducts one higher order finite difference to obtain the required fourth order derivative. Compared with the finite field method, this method is more efficient and decreases computing costs. The DFT method has been widely and effectively used for the calculation of (super) polarizability and is considered as an undeniable alternative to the demanding ab initio method. Herein, functionals CAM-B3LYP and BHandHLYP were employed in these calculations. The CAM-B3LYP functional, which adds a long-range-corrected version of B3LYP using the Coulomb-attenuating method, includes 19% and 65% of the short- and long-range HF exchange.30 The BHandHLYP functional is obtained by including 50% of the exact exchange in the rgw BLYP functional.31
Time-dependent (TD)-DFT has currently become a general tool to enable understanding and prediction of the behavior of the electron transition property. The keyword SCRF = (PCM, solvent = o-dichlorobenzene) was added to the command line of TD calculation to simulate the absorption spectrum under the solvent. The PCM method in Gaussian 09 includes an external iteration procedure whereby the program computes the energy in solution by ensuring that the solvent reaction field is self-consistent with the solute electrostatic potential (the latter being generated from the computed electron density with the specified model chemistry).
3. Results and discussion
3.1. Geometrical structure and stability
The composites of corannulenes and fullerene compounded at a ratio of 2![[thin space (1/6-em)]](https://www.rsc.org/images/entities/char_2009.gif) :
:![[thin space (1/6-em)]](https://www.rsc.org/images/entities/char_2009.gif) 1 (2C20H10/C60 and 2C20H10/C70) were obtained at the B3LYP-D3/6-31G(d) level, and our rationale for using this level is shown in the ESI.† The structure models are derived from the crystal structure obtained from the experimental results.32 We choose only C60 and C70 fullerenes because they are complexed with two bowl-shaped corannulene in the current experimental reports.32 In addition, according to the results of a previous study,33 pure C60 and C70 with larger energy differences (Egap) between the highest occupied molecular orbital (HOMO) and the lowest unoccupied molecular orbital (LUMO) of 2.89 eV and 2.73 eV are the most stable. The results of a previous study21 reported that the complexes formed by C60 and C70 are more stable as compared to small fullerenes. Moreover, it was reported that when these complexes were in an eclipsed stacking orientation, the greatest stability was achieved.21 Therefore, we tried to align the C20H10 rings with the pentagons of C60 and C70, and considered other possible non-symmetrical arrangements. As shown in Fig. 1, a, b, and c represent three five-membered rings in different positions that can be complexed with another C20H10 ring so that there are three isomers of different positions for each complex. In addition, there are 3 possible concave/convex arrangements for each complex. Therefore, each complex consists of 9 isomers (Fig. S1 and S2, ESI†).
1 (2C20H10/C60 and 2C20H10/C70) were obtained at the B3LYP-D3/6-31G(d) level, and our rationale for using this level is shown in the ESI.† The structure models are derived from the crystal structure obtained from the experimental results.32 We choose only C60 and C70 fullerenes because they are complexed with two bowl-shaped corannulene in the current experimental reports.32 In addition, according to the results of a previous study,33 pure C60 and C70 with larger energy differences (Egap) between the highest occupied molecular orbital (HOMO) and the lowest unoccupied molecular orbital (LUMO) of 2.89 eV and 2.73 eV are the most stable. The results of a previous study21 reported that the complexes formed by C60 and C70 are more stable as compared to small fullerenes. Moreover, it was reported that when these complexes were in an eclipsed stacking orientation, the greatest stability was achieved.21 Therefore, we tried to align the C20H10 rings with the pentagons of C60 and C70, and considered other possible non-symmetrical arrangements. As shown in Fig. 1, a, b, and c represent three five-membered rings in different positions that can be complexed with another C20H10 ring so that there are three isomers of different positions for each complex. In addition, there are 3 possible concave/convex arrangements for each complex. Therefore, each complex consists of 9 isomers (Fig. S1 and S2, ESI†).
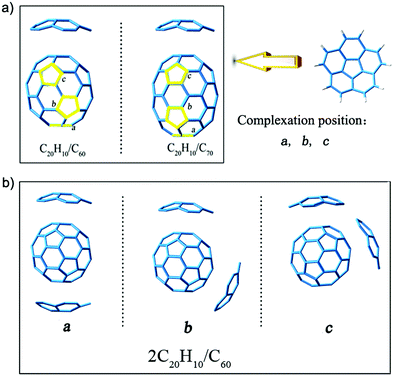 | ||
| Fig. 1 (a) Three five-membered rings in different positions are indicated by a, b, and c. (b) Isomers of the complex (2C20H10/C60) obtained at the B3LYP-D3/6-31G(d) level. | ||
To determine the stability of the isomers, the single point energy calculation for three types of isomers was studied (Table S1, ESI†). The stabilization energy difference between position a and position b ranges from 0.000012 to 0.021607 atomic units (a.u.), and a lower stabilization energy is associated with position a. Therefore, the isomers of position a for complex 1–5 are more stable. However, such a small difference of 0.000012 a.u. for complex 6 indicated that they are of similar energetic ordering. To further determine the stability of isomers, the energy differences (Egap) between the HOMO and the LUMO were taken into account (Table S1, ESI†). It is well known that the smaller the Egap, the more dynamic and unstable the system. From Table S1 (ESI†), the Egap values of position b are all smaller than that of position a, and therefore, the isomers of position a are more stable. In addition, the structural models are derived from the crystal structure of the experimental results.32 The molecular structure reported in the experiment is the isomer of position a. Therefore, we chose structures of position a for further studies herein.
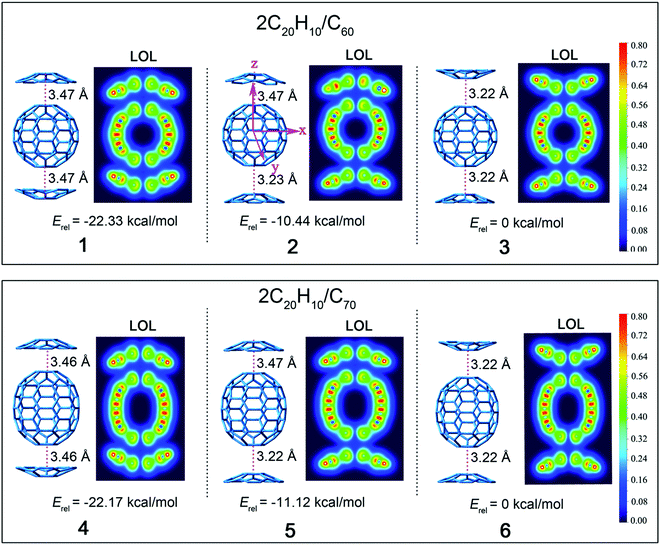
Based on the discussion above, complexes 1–6 based on 3 possible concave/convex arrangements for each complex were further examined (Fig. 2). The relative stabilization energies of these isomers are also shown, and they reveal that complexes 1 and 4 have the lowest relative energies of −22.33 and −22.17 kcal mol−1. This indicates that the stacking mode of two concave surfaces stacked with the convex surface of fullerene is the most stable isomer. On the contrary, structures 3 and 6 with the stacking mode of two convex surfaces stacked with the convex surface of fullerene are the most active with highest stabilization energy. This is due to the concave–convex charge transfer (CT) interaction that was reported to stabilize the CT complex more effectively than the convex–convex interaction because of the large electrostatic interaction that plays a pivotal role in determining the energetically accessible stacking motifs.22
Geometrical complementarity between the concave/convex aromatic face of C20H10 and convex face of fullerene was established under the distance between the bottom five-membered ring of C20H10 and C60 of 3.22–3.47 Å. The distances between the concave face of C20H10 and convex face of C60 and C70 are 3.47 and 3.46 Å, respectively, which is similar to the previous result of 3.5 Å between C20H10 and C60.21 C20H10 has five six-membered rings around a central five-membered ring, as segments of C60 and C70, thus indicating similar distances. C20H10 is involved in convex–convex interactions with the C60-surface, with the shortest distance being 3.22 Å, which is similar to the reported distance of 3.23 Å for the convex–convex interaction between C28H14 and C60. The bottom of the carbon cage is parallel to the central five-element torus of C20H10, and thus achieves the maximum concave–convex interaction.
3.2. Electronic structure
A localized orbital locator (LOL, Fig. 2) is often used to interpret the structure and chemical bond in a clear and intuitive manner. If the possible LOL values are restricted, with the upper limit LOL = 1 corresponding to perfect localization, the value LOL = 0.5 corresponds to an electron gas-like pair and the lower limit LOL = 0 corresponds to the region of non-bonding. In order to clarify this image, we used color scales ranging from 0.0 to 0.8. Therefore, pale green LOL basins (LOL = 0.3–0.6) represent faster moving electrons (delocalized electrons). The slowest electron regions shown in yellow-red (LOL = 0.6–0.8) correspond to a typical two-electron/two-center bonding situation. The region 0.0 < LOL < 0.3 (plotted in lighter blue, blue, and deep blue) represents regions in space that are increasingly avoided by electrons, such as the space far away from nuclei and the space between the shells of the atoms. It was revealed that no covalent bonds had been formed. The LOL diagrams show that the light blue regions of complexes are semblable.The energy levels and molecular orbital diagrams of the HOMO and LUMO are shown in Fig. 3, and for these complexes, the HOMO and LUMO are mainly on fullerene. According to molecular orbital theory, there is no orbital overlap between C20H10 and fullerene, which also reveals that the weak interaction between C60 and C20H10 is formed by concave–convex interactions between C20H10 and fullerenes. The energy differences (Egap) between the HOMO and the LUMO of C60 and C70 obtained by B3LYP/6-31G(d) and complexes 1–6 are embedded in Fig. 2. Compared to pure C60 and C70, complexes 1–6 have smaller Egap values, indicating that the weak interaction causes a slight lowering of the energy gaps of C60 and C70. The Egap value of C60 was evaluated as 2.89 eV along with −6.03 eV of HOMO and −3.14 eV of LUMO. The Egap values of 1–3 were evaluated as 2.68 eV > 2.67 eV > 2.64 eV, respectively, which indicated that the weak interaction causes a slight lowering of the Egap values of C60 ranging from 0.21 to 0.25 eV. Furthermore, it was found that the convex–convex interaction was more conducive for reducing the energy gap as compared to the concave–convex interaction. Specifically, the weak interaction raised the HOMO energy levels by 0.31 eV (1), 0.43 eV (2), and 0.53 eV (3) and raised the LUMO energy levels by 0.1 eV (1), 0.21 eV (2), and 0.28 eV (3). Likewise, the Egap values of 4, 5, and 6 were also evaluated as 2.71 eV > 2.69 eV > 2.67 eV, which were lower than that of pure C70 (2.73 eV) by 0.02 eV, 0.04 eV, and 0.06 eV. It was also found that the convex–convex interaction was more conducive to reducing the energy gap as compared to the concave–convex interaction. Specifically, the weak interaction raised the HOMO energy levels by 0.19 eV (4), 0.29 eV (5), and 0.39 eV (6) and raised the LUMO energy levels by 0.17 eV (4), 0.25 eV (5), and 0.33 eV (6).
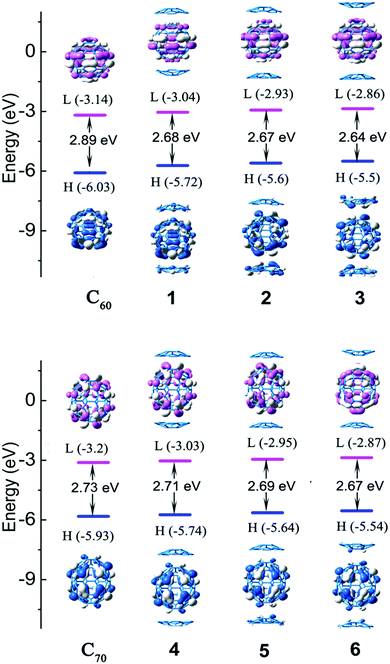 | ||
| Fig. 3 The frontier molecular orbital diagrams and HOMO and LUMO energy levels of the studied complexes obtained at the B3LYP-D3/6-31G(d) level. | ||
3.3. Noncovalent interactions
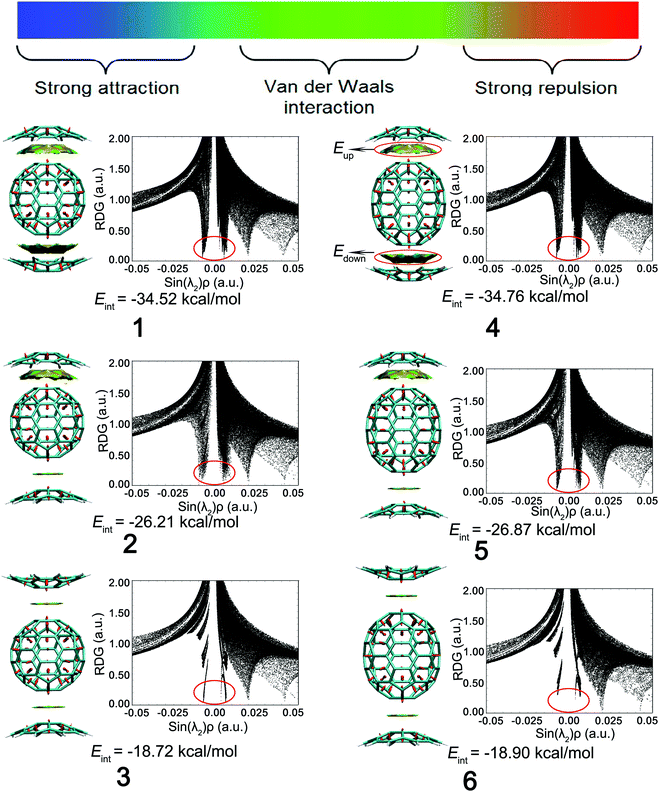
The interaction energy Eint between the corannulene dimer and fullerene were calculated at the B97D/6-31+G(d) level. Eup and Edown denote the interaction energy between the upward corannulene and fullerene as well as the downward corannulene and fullerene, respectively, and the results are shown in Table 1. The Eint (−34.52 kcal mol−1) of complex 1 consisting of two concave–convex interactions is indeed the sum of Eup (−17.26 kcal mol−1) and Edown (−17.26 kcal mol−1), where Eup is equal to Edown because of the symmetrical structure. Similarly, complex 4 is also a symmetrical structure consisting of two concave–convex interactions, so that Eup is equal to Edown. The sum of its Eup (−17.36 kcal mol−1 for 4) and Edown values are close to their Eint (−34.76 kcal mol−1 for 4) values. For complexes 3 and 6, they consist of two convex–convex interactions and are also symmetrical structures, so that Eup is also equal to Edown. The sum of their Eup (−9.16 kcal mol−1 for 3 and −9.24 kcal mol−1 for 6) and Edown values are close to their Eint (−18.72 kcal mol−1 for 3 and −18.90 kcal mol−1 for 6) values. With regard to complexes 2 and 5, their asymmetrical structures are derived from two types of interactions, including concave–convex interaction (Eup) and convex–convex interaction (Edown). The sum of their Eup (−16.75 kcal mol−1 for 2 and −17.29 kcal mol−1 for 5) and Edown (−9.34 kcal mol−1 for 2 and −9.46 kcal mol−1 for 5) values are also similar to their Eint (−26.21 kcal mol−1 for 2 and −26.87 kcal mol−1 for 5) values. Combining the previous analysis, there is a meaningful discovery that the absolute value of the concave–convex interaction energies were evaluated as 16.75–17.36 kcal mol−1, which were larger than those of the convex–convex interaction energies of 9.16–9.46 kcal mol−1. Thus, complexes 1 and 4 with double concave–convex interactions exhibited the largest interaction energies of −34.52 and −34.76 kcal mol−1, providing the support of their lowest stability energy. Complexes 2 and 5 possess concave–convex and convex–convex interactions, and therefore, their Eint values (−26.21 and −26.87 kcal mol−1 for 2 and 5, respectively) are roughly the sum of these two interactions. Complexes 3 and 6 with double convex–convex interactions exhibit the smallest interaction energies of −18.72 and −18.90 kcal mol−1, revealing the most unstable isomer.| Complex | E up | E down | E int |
|---|---|---|---|
| 1 | −17.26 | −17.26 | −34.52 |
| 2 | −16.75 | −9.34 | −26.21 |
| 3 | −9.16 | −9.16 | −18.72 |
| 4 | −17.36 | −17.36 | −34.76 |
| 5 | −17.29 | −9.46 | −26.87 |
| 6 | −9.24 | −9.24 | −18.90 |
Reduced density gradient (RDG) is a fundamental dimensionless quantity in DFT used to describe the deviation from a homogeneous electron distribution. The noncovalent interactions including the concave–convex and convex–convex interaction are visualized by the figures showing electron density and low-gradient isosurfaces (RDG) in this section. RDG indicates the type of interaction, and its strength can be derived from the density on the noncovalent interaction surface because noncovalent interactions are highly nonlocal and manifest in real space as low-gradient isosurfaces with low densities. The low-density, low-gradient spike with low electron density (−0.05 < sin(λ2)ρ < 0.05) in Fig. 4 (black figure) indicates the presence of weak noncovalent interactions, which provide a satisfactory balance between the weakly repulsive and attractive interactions, resulting in greater thermal stability of the complex.
To distinguish between the three different types of non-covalent interactions, including strong attraction, π–π interaction, and steric hindrance, RDG (s = 0.5 a.u.) vs. sin(λ2)ρ for the complexes was plotted. sin(λ2)ρ is a definition of a real space function, namely, the product of the sine of λ2 and ρ. Different colors were used to represent the values of this function according to the color bar below, and they were mapped to RDG isosurfaces to designate where weak interactions occur, and also to easily capture the interaction type. The noncovalent interaction regions of all complexes are filled with green or light brown, which confirms an overwhelming preponderance of the π–π interaction. In Fig. 4, the dispersion range of the concave–convex interaction was evaluated as compared to that of the convex–convex interaction, and it is consistent with the result of the Eint value. It was found that the area of RDG can represent the interaction energy, which is positively correlated with the dispersion range to a large extent.
3.4. Absorption spectra
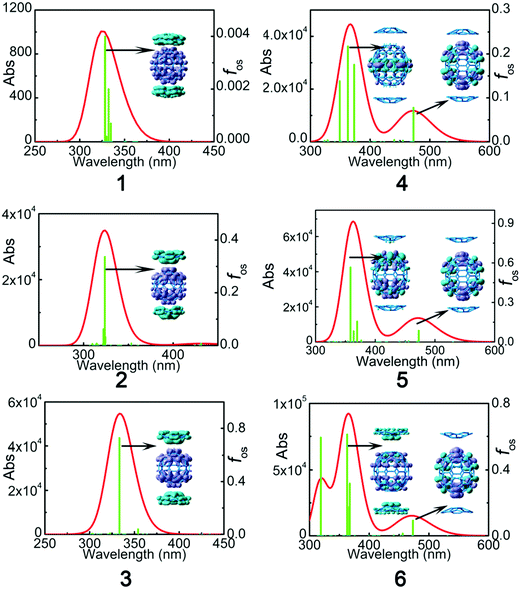
The UV-Vis absorption spectra of C60:C28H14 and C70:2C28H14 were obtained with the TD-B3LYP and TD-CAM-B3LYP functionals using a 6-31+G* basis set. For the sake of reliable simulation results, a comparison between the theoretical analog spectra in o-dichlorobenzene solvent and the experimental results of C60:C28H14 and C70:2C28H14 in o-dichlorobenzene solvent32 was performed (Fig. S2, ESI†). A detailed discussion of the comparison is located in the ESI.† It reveals that the B3LYP functional largely underestimates the excitation energy of the maximum absorption peak, while the simulated spectra by means of the CAM-B3LYP functional were similar to those obtained via the experimental results. Therefore, for the studied complexes, the result of TD-CAM-B3LYP was chosen to simulate the absorption spectra of the studied complexes.To investigate the electronic transition, electron density difference maps (EDDMs) corresponding to the crucial electronic transitions are shown in Fig. 5. The electron density difference can be exactly evaluated as:
| Δρ(r) = ρele(r) − ρhole(r) | (8) |
| Complex | State | λ | ΔEge | f os | f os 2/ΔEge5 | Excitation (% composition) |
|---|---|---|---|---|---|---|
| a Assignment: H = HOMO, L = LUMO, H−1 = HOMO−1, L+1 = LUMO+1, etc. | ||||||
| 1 | S34 | 322.1 | 3.85 | 0.004 | 1.89 × 10⁻⁸ | Ha−10 → L+2 (29%), H-9 → L+1 (29%) H-5 → L (11%) |
| 2 | S32 | 323.7 | 3.83 | 0.336 | 1.37 × 10⁻⁴ | H−6 → L + 1 (13%), H−6 → L+2 (18%) H−5 → L+1 (21%), H−5 → L+2 (12%) |
| 3 | S26 | 333.2 | 3.72 | 0.727 | 7.42 × 10⁻⁴ | H−6 → L+1 (39%), H−5 → L (42%) |
| 4 | S2 | 472.6 | 2.62 | 0.078 | 4.93 × 10⁻⁵ | H−1 → L (26%), H → L+1 (54%) |
| S30 | 362.8 | 3.42 | 0.218 | 1.02 × 10⁻⁴ | H−3 → L (29%), H → L+3 (56%) | |
| 5 | S2 | 472.8 | 2.62 | 0.086 | 5.99 × 10⁻⁵ | H−1 → L+2 (20%), H → L+1 (62%) |
| S32 | 358.6 | 3.46 | 0.567 | 6.48 × 10⁻⁴ | H−7 → L+1 (22%), H−6 → L (21%), H−2 → L+4 (18%), H−1 → L+5 (18%) | |
| 6 | S2 | 473.2 | 2.62 | 0.093 | 7.01 × 10⁻⁵ | H−1 → L+2 (14%), H → L (70%) |
| S29 | 363.1 | 3.41 | 0.6117 | 8.12 × 10⁻⁴ | H−3 → L+2 (29%), H−2 → L+4 (12%), H−1 → L+5 (12%), H → L+3 (42%) | |
3.5. The second hyperpolarizability
In order to ensure the reliability of the results, two functionals (BHandHLYP and CAM-B3LYP) with a 6-31+G(d) basis set were selected to examine the reliability of polarizabilities (αtot) and second hyperpolarizabilities (γtot). The results are summarized in Table 3 and Fig. 6. The components of αtot and γtot values are shown in Tables S4 and S5 (ESI†). The results show that the same trend was observed for BHandHLYP and CAM-B3LYP functionals, and thus, the results obtained by BHandHLYP were chosen to discuss the variation rule of αtot and γtot values.| Complex | 〈R2〉 | Functionals | α tot | γ tot |
|---|---|---|---|---|
| 1 | 56198.4 | BHandHLYP | 928.3 | 271774.0 |
| CAM-B3LYP | 928.1 | 278630.9 | ||
| 2 | 60036.2 | BHandHLYP | 959.2 | 511368.5 |
| CAM-B3LYP | 959.7 | 559226.1 | ||
| 3 | 66504.6 | BHandHLYP | 988.4 | 724360.4 |
| CAM-B3LYP | 989.5 | 807513.3 | ||
| 4 | 73926.3 | BHandHLYP | 1056.8 | 374262.2 |
| CAM-B3LYP | 1058.6 | 389005.6 | ||
| 5 | 81643.6 | BHandHLYP | 1089.8 | 737074.0 |
| CAM-B3LYP | 1092.8 | 817738.6 | ||
| 6 | 87560.0 | BHandHLYP | 1122.3 | 1074495.1 |
| CAM-B3LYP | 1126.2 | 1216516.9 |
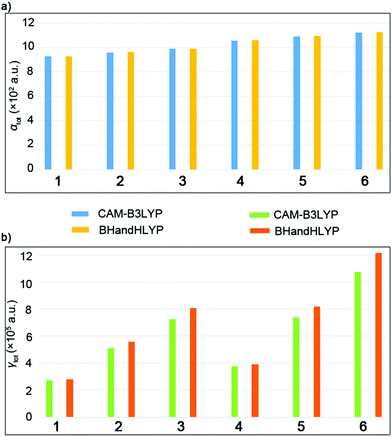 | ||
| Fig. 6 (a) The αtot values for the complexes. (b) The γtot values for the complexes calculated using the CAM-B3LYP and BHandHLYP methods. | ||
The total polarizability (αtot) values of the complexes gradually increased as 928.3 a.u. (1) < 959.2 a.u. (2) < 988.4 a.u. (3), which indicated that the packing arrangement with double convex–convex interactions exhibits the largest linear optical response. The same conclusion was obtained from the results of C70 complexes, that is, 1056.8 a.u. (4) < 1089.8 a.u. (5) < 1122.3 a.u. (6). The relative electronic spatial extent 〈R2〉 values are physical properties that represent the electron density volume around the molecule and usually represent the size of the molecule.33 The 〈R2〉 values obtained by the B3LYP/6-31G level in series increase as 56198.4 a.u. (1) < 60036.2 a.u. (2) < 66504.6 a.u. (3) and 73926.3 a.u. (4) < 81643.6 a.u. (5) < 87560.0 a.u. (6). They are in agreement with the increasing order of the αtot values, which is due to the fact that more diffuse electron clouds may lead to larger 〈R2〉 values, resulting in a larger αtot value.
The γtot values were gradually increased from 271774.0 a.u. (1) to 724360.4 a.u. (3) as well as 724360.4 a.u. (4) to 1074495.1 a.u. (6), which show that the packing arrangement with the double convex–convex interactions possesses the largest third order nonlinear optical response. It was found that the convex–convex interaction was more likely to be excited and cause intermolecular CT as compared to the concave–convex interaction. The results show that the larger NLO response is related to the packing arrangement, which is of great significance for the further study of such systems and their derivatives. To understand the origin of the third-order NLO response, a two-level model of the γtot value was considered for the studied complexes, which is the linkage between the γtot value and electronic transition(s) in low–lying crucial excited states. Therefore, using the two-level models is a reliable method to analyze second hyperpolarizabilities, and the expression is as follows: fos2/ΔE5, where fos the oscillator strength, and ΔE the transition energy.34
In the two-level expression, the γtot value is proportional to the quadratic power of fos but inversely proportional to the fifth power of ΔE. The fos2/ΔE5 of low-lying crucial excited states has been calculated as 1.89 × 10⁻⁸ (1) < 1.37 × 10⁻⁴ (2) < 7.42 × 10⁻⁴ (3), which is in quantitative agreement with the regular γtot values. For C70 complexes, the low-lying crucial excited states were chosen as S30 for 4, S32 for 5, and S29 for 6. The fos2/ΔE5 of these excited states was calculated as 1.02 × 10⁻⁴ (4) < 6.48 × 10⁻⁴ (5) < 8.12 × 10⁻⁴ (6), which also agree with the regular γtot values. This indicates that the γtot value depends on the transition energy and oscillator strength of the low excited state. A smaller transition energy and larger oscillator strength are conducive to the larger γtot values. The low-lying crucial excited state of complex 3 and 6 have the largest fos (0.727 for 3 and 2.62 for 6) and smallest ΔE (3.72 eV for 3 and 0.093 eV for 6), and thus, the largest γtot values are for complexes 3 and 6.
3.6. The second hyperpolarizability with electric field
A strong electric field may strongly alter the geometry, and hence the NLO properties. Therefore, in order to explore the influence of the electric field on the hyperpolarizability of the system, we optimized complex 1 with the external electric fields including 10 × 10−4, 20 × 10−4, 30 × 10−4, 40 × 10−4, and 50 × 10−4 a.u. at the direction of +z. Corresponding geometric parameters have been added in Table 4. The results show that the stabilization energy of complex 1 decreases as the external electric field strength increases from 0 a.u. to 0.005 a.u. The distance between the bottom five-membered ring of C20H10 and C60 along the direction of z+ (Dz+) is slightly elongated by 0.055 Å from 3.469 Å (F = 0) to 3.524 Å (F = 50 × 10−4 a.u.). However, the distance between C20H10 and C60 along the direction of z− (Dz−) is slightly shortened by 0.068 Å from 3.469 Å (F = 0) to 3.401 Å (F = 50 × 10−4 a.u.). As the external electric field strength increases from 0 a.u. to 0.005 a.u., the HOMO orbital energy slightly increases by 0.75 eV from −5.72 eV (F = 0) to −4.97 eV (F = 50 × 10−4 a.u.), and the Egap values decrease by 0.75 eV from 2.68 eV (F = 0) to 1.93 eV (F = 50 × 10−4 a.u.). Therefore, the electric field strongly alters the geometry.| Field (10−4 a.u.) | Energy (a.u.) | D z + | D z − | E gap |
|---|---|---|---|---|
| 0 | −3823.0219 | 3.469 | 3.469 | 2.68 |
| 10 | −3823.0220 | 3.482 | 3.459 | 2.66 |
| 20 | −3823.0233 | 3.492 | 3.447 | 2.57 |
| 30 | −3823.0254 | 3.506 | 3.433 | 2.36 |
| 40 | −3823.0284 | 3.516 | 3.418 | 2.14 |
| 50 | −3823.0323 | 3.524 | 3.401 | 1.93 |
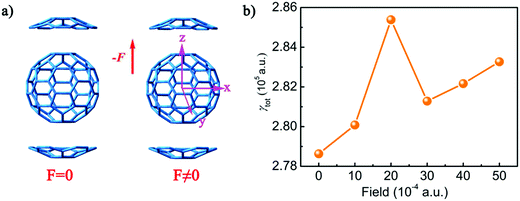
The polarizabilities (αtot) and second hyperpolarizabilities (γtot) of complex 1 were also calculated on the basis of the resulting structures with the external electric fields including 10 × 10−4, 20 × 10−4, 30 × 10−4, 40 × 10−4, and 50 × 10−4 a.u. at the direction of +z to study the effect of an electric field on NLO properties (Tables S6 and S7, ESI†). The results show that as the intensity of the electric field increases from 0 to 50 × 10−4 a.u., the αtot values range from 928.1 a.u. to 928.6 a.u., which indicates that the intensity of the external electric field has little influence on the polarizability. However, with regard to the second hyperpolarizabilities, the influence of the strength of the external electric field is enormous. It is due to the α value being the first derivative, but the γ value is the third derivative of the electric field according to eqn (4) and (5). Therefore, the α value remains unchanged under the electric field. However, the γ value exhibits non-monotonic behaviour under the electric field. The γtot values of complex 1 with external electric fields are 280082.1 a.u. (F = 10 × 10−4 a.u.), 285384.6 (F = 20 × 10−4 a.u.), 281285.3 (F = 30 × 10−4 a.u.), 282167.2 (F = 40 × 10−4 a.u.), and 283268.6 (F = 50 × 10−4 a.u.), respectively. The variation tendency of the γtot values is shown in Fig. 7. The addition of an external electric field will increase the γtot value by 1451.2–6753.64 a.u., and the γtot value sharply increases when the external electric field intensity is 20 × 10−4 a.u.
4. Conclusions
In summary, the packing arrangement plays a vital role in determining the stabilities of corannulene/fullerene complexes. Geometrical complementarity between the concave/convex aromatic face of C20H10 and convex face of fullerene can be established to form three types of complexes. It was found that the concave–convex interaction was stronger than the convex–convex interaction. Therefore, the stacking mode of two concave surfaces stacked with the convex surface of fullerene is the most stable arrangement and has the largest binding energy.The total polarizability (αtot) values of the complexes were gradually increased in the order 1 < 2 < 3 < 4 < 5 < 6, which indicated that the packing arrangement with double convex–convex interactions exhibited the largest linear optical response. The same conclusion can be drawn from the results of the second hyperpolarizabilities (γtot). This shows that the packing arrangement with double convex–convex interactions possesses the largest third-order nonlinear optical response. Thus, the convex–convex interaction is more likely to be excited and cause intermolecular CT rather than the concave–convex interaction. This work offers new methods for searching for hosts for fullerenes via convex–convex shape complementarity and for exploring excellent nonlinear optical materials.
Conflicts of interest
There are no conflicts to declare.Acknowledgements
This work is supported by the Natural Science Foundation of Shandong Province (No. ZR2019BB019). We also thank Project No. 11904149, which is supported by the National Natural Science Foundation of China.References
- H. Fenniri, P. Mathivanan, K. L. Vidale, D. M. Sherman, K. Hallenga, K. V. Wood and J. G. Stowell, J. Am. Chem. Soc., 2001, 123, 3854–3855 CrossRef CAS PubMed.
- C. Rest, R. Kandanelli and G. Fernández, Chem. Soc. Rev., 2015, 44, 2543–2572 RSC.
- S. M. Mathew, J. T. Engle, C. J. Ziegler and C. S. Hartley, J. Am. Chem. Soc., 2013, 135, 6714–6722 CrossRef CAS PubMed.
- T. F. Headen, C. A. Howard, N. T. Skipper, M. A. Wilkinson, D. T. Bowron and A. K. Soper, J. Am. Chem. Soc., 2010, 132, 5735–5742 CrossRef CAS PubMed.
- K. E. Riley and P. Hobza, Acc. Chem. Res., 2013, 46, 927–936 CrossRef CAS PubMed.
- Q. Q. Li and Z. Li, Acc. Chem. Res., 2020, 53(4), 962–973 CrossRef CAS PubMed.
- C. G. Claessens, D. Gonzalez-Rodriguez, R. S. Iglesias and T. Torres, C. R. Chim., 2006, 9, 1094–1099 CrossRef CAS.
- T. Haino, E. Hirai, Y. Fujiwara and K. Kashihara, Angew. Chem., Int. Ed., 2010, 49, 7899–7903 CrossRef CAS PubMed.
- V. H. Le, M. Yanney, M. McGuire, A. Sygula and E. A. Lewis, J. Phys. Chem. B, 2014, 118, 11956–11964 CrossRef CAS PubMed.
- K. Tashiro and T. Aida, Chem. Soc. Rev., 2007, 36, 189–197 RSC.
- A. Szarpak-Jankowska, C. Burgess, L. De Cola and J. Huskens, Chem. – Eur. J., 2013, 19, 14925–14930 CrossRef CAS PubMed.
- C.-Q. Jiao, Y.-S. Meng, Y. Yu, W.-J. Jiang, W. Wen, H. Oshio, Y. Luo, C.-Y. Duan and T. Liu, Angew. Chem., Int. Ed., 2019, 58, 17009–17015 CrossRef CAS PubMed.
- B. Wang, S. Zheng, A. Saha, L. Bao, X. Lu and D. M. Guldi, J. Am. Chem. Soc., 2017, 139, 10578–10584 CrossRef CAS.
- E. M. Muzammil, D. Halilovic and M. C. Stuparu, Commun. Chem., 2019, 2, 58 CrossRef.
- M. Řezanka, Environ. Chem. Lett., 2019, 17, 49–63 CrossRef.
- X. Zhu, A. Quaranta, R. V. Bensasson, M. Sollogoub and Y. Zhang, Chem. – Eur. J., 2017, 23, 9462–9466 CrossRef CAS PubMed.
- S. Lee, E. Chénard, D. L. Gray and J. S. Moore, J. Am. Chem. Soc., 2016, 138, 13814–13817 CrossRef CAS PubMed.
- Y. Yamamoto, E. Tsurumaki, K. Wakamatsu and S. Toyota, Angew. Chem., Int. Ed., 2018, 57, 8199–8202 CrossRef CAS PubMed.
- W. Xiao, D. Passerone, P. Ruffieux, K. Aït−Mansour, O. Gröning, E. Tosatti, J. S. Siegel and R. Fasel, J. Am. Chem. Soc., 2008, 130, 4767–4771 CrossRef CAS PubMed.
- M. C. R. Delgado, E.-G. Kim, D. A. d. S. Filho and J.-L. Bredas, J. Am. Chem. Soc., 2010, 132, 3375–3387 CrossRef PubMed.
- L. Wang, W.-Y. Wang, R.-L. Zhong, Y.-Q. Qiu and H.-M. Xie, J. Phys. Chem. C, 2016, 120, 26034–26043 CrossRef CAS.
- L. Wang, W.-Y. Wang, X.-Y. Fang, C.-L. Zhu and Y.-Q. Qiu, RSC Adv., 2015, 5, 79783–79791 RSC.
- M. T. Hassan, T. T. Luu, A. Moulet, O. Raskazovskaya, P. Zhokhov, M. Garg, N. Karpowicz, A. M. Zheltikov, V. Pervak, F. Krausz and E. Goulielmakis, Nature, 2016, 530, 66 CrossRef CAS PubMed.
- S. Grimme, J. Comput. Chem., 2006, 27, 1787–1799 CrossRef CAS PubMed.
- S. Grimme, J. Antony, S. Ehrlich and H. Krieg, J. Chem. Phys., 2010, 132, 154104 CrossRef PubMed.
- T. Janowski, P. Pulay, A. A. Sasith Karunarathna, A. Sygula and S. Saebø, Chem. Phys. Lett., 2011, 512, 155–160 CrossRef CAS.
- S. F. Boys and F. Bernardi, Mol. Phys., 1970, 19, 553–566 CrossRef CAS.
- E. R. Johnson, S. Keinan, P. Mori-Sánchez, J. Contreras-García, A. J. Cohen and W. Yang, J. Am. Chem. Soc., 2010, 132, 6498–6506 CrossRef CAS PubMed.
- J. L. Bredas, C. Adant, P. Tackx, A. Persoons and B. M. Pierce, Chem. Rev., 1994, 94, 243–278 CrossRef CAS.
- T. Yanai, D. P. Tew and N. C. Handy, Chem. Phys. Lett., 2004, 393, 51–57 CrossRef CAS.
- A. D. Becke, J. Chem. Phys., 1993, 98, 1372–1377 CrossRef CAS.
- A. S. Filatov, M. V. Ferguson, S. N. Spisak, B. Li, C. F. Campana and M. A. Petrukhina, Cryst. Growth Des., 2014, 14, 756–762 CrossRef CAS.
- L. Wang, J. T. Ye, H. Chen, Z. Z. Chen, Y. Q. Qiu and H. M. Xie, Phys. Chem. Chem. Phys., 2017, 19, 2322–2331 RSC.
- K. Hatua and P. K. Nandi, J. Phys. Chem. A, 2013, 117, 12581–12589 CrossRef CAS PubMed.
Footnote |
| † Electronic supplementary information (ESI) available: The components of the total polarizabilities α (a.u.) and the second hyperpolarizabilities γ (a.u.) for the studied complexes. See DOI: 10.1039/d0cp03253k |
| This journal is © the Owner Societies 2021 |

