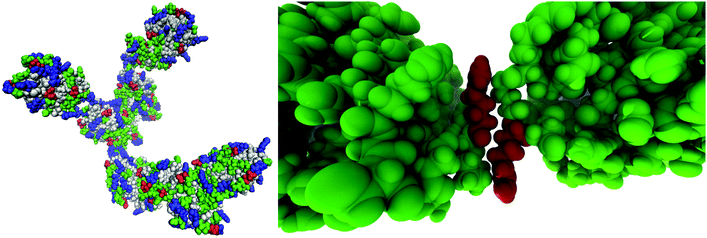
Studying the mechanism of phase separation in aqueous solutions of globular proteins via molecular dynamics computer simulations†
Sandi
Brudar
a,
Jure
Gujt
bc,
Eckhard
Spohr
b and
Barbara
Hribar-Lee
 *a
*a
aUniversity of Ljubljana, Faculty of Chemistry and Chemical Technology, Večna pot 113, SI-1000 Ljubljana, Slovenia. E-mail: barbara.hribar@fkkt.uni-lj.si; Fax: +386 1 479 8500
bUniversity Duisburg-Essen, Faculty of Chemistry, Campus Essen, Universitätsstr. 5, D-45141 Essen, Germany
cUniversity of Paderborn, Dynamics of Condensed Matter and Center for Sustainable Systems Design, Chair of Theoretical Chemistry, Warburger Str. 100, D-33098 Paderborn, Germany
First published on 27th November 2020
Abstract
Proteins are the most abundant biomacromolecules in living cells, where they perform vital roles in virtually every biological process. To maintain their function, proteins need to remain in a stable (native) state. Inter- and intramolecular interactions in aqueous protein solutions govern the fate of proteins, as they can provoke their unfolding or association into aggregates. The initial steps of protein aggregation are difficult to capture experimentally, therefore we used molecular dynamics simulations in this study. We investigated the initial phase of aggregation of two different lysozymes, hen egg-white (HEWL) and T4 WT* lysozyme and also human lens γ-D crystallin by using atomistic simulations. We monitored the phase stability of their aqueous solutions by calculating time-dependent density fluctuations. We found that all proteins remained in their compact form despite aggregation. With an extensive analysis of intermolecular residue–residue interactions we discovered that arginine is of paramount importance in the initial stage of aggregation of HEWL and γ-D crystallin, meanwhile lysine was found to be the most involved amino acid in forming initial contacts between T4 WT* molecules.
1 Introduction
The function of a protein is tightly connected to its native structure, which is determined by the balance between the intramolecular interactions between its different amino-acid residues and the interactions with the environment. In the presence of other proteins in solution, i.e. at a higher concentration, similar molecular interactions between residues on different protein molecules become important, which can lead to protein clustering and formation of supramolecular assemblies, ranging in size and structure from large crystals to amorphous aggregates. Necessarily, this leads to a reduced biological activity, and it is believed to be one possible cause for several so-called condensation diseases, such as cataract formation, sickle cell anemia, cryoglobulinemia, and others.1,2 In addition, protein aggregation reduces the stability of antibody solutions and other therapeutics, and as such presents a serious problem for pharmaceutical industry.3 It is therefore not surprising that protein–protein interactions have been studied extensively. Alanine scanning mutagenesis enabled the analysis of a wide range of protein–protein interactions and, identifying the so-called hot spots, specific sites on protein surfaces that are responsible for binding interactions.4 These intermolecular binding interactions cause the proteins to undergo liquid–liquid phase separation (LLPS) from which protein crystallization occurs or pathogenic fibril aggregates appear to form.2 However, when proteins undergo LLPS, their initial structure remains more or less intact, whereas additional structural changes involving at least partial unfolding occur during processes of fibril formation.5–7 An interesting observation that resulted from these systematic studies was that, regardless of the protein, the hot spots are not random, but have distinct amino acid compositions,8 the most fundamental ones being tryptophan (21%), arginine (13.3%), and tyrosine (21%). However, the alanine scanning mutagenesis technique is slow and labor-intensive, and consequently the number of experimentally determined hotspots is very limited.4 Furthermore, the analysis only provides us with the information about already formed protein–protein complexes, not so much about the binding mechanism or the physico-chemical forces that induce the binding process.Computer simulations represent an alternative way to study the mechanism of protein–protein aggregation in molecular systems. Atomistic molecular dynamics (MD) simulations are one of the most frequently used computational methods to study the behaviour of proteins in solution.9 Unfortunately, in spite of the rapidly increasing computer power, the computational cost of the simulations poses limits on the number of atoms in the system as well as on the overall simulation time of such studies. In practice, most atomistic MD simulations have focused on single protein molecules or specific complexes, without a consideration of the crowded environment10 characteristic for in vivo environments. And while coarse-grained models have been developed as a step towards studying the aggregation process in more complex environments,11,12 these models, or force fields, such as, e.g., the widely used MARTINI force field13 pose problems of their own in that they often produce erroneous results, while at the same time requiring all-atom simulations in order to be parametrized.14
During the last couple of decades, evidence has been accrued supporting a view that the so-called condensation diseases are a manifestation of LLPS that occurs in vivo in cells as well as in vitro protein solutions, as a consequence of protein–protein interactions.2,15 While detailed studies of the mechanism of protein aggregation process in the cellular environment are beyond the reach for today's computers,11,12 it is reasonable to believe that identifying the interactions responsible for protein condensation would provide valuable guidelines to control these processes.
In the present paper, we use atomistic MD simulations to study the aggregation for a few sufficiently small globular proteins, for which current force fields are optimized,12 and for which the conditions of LLPS are known experimentally.16–18 Through a detailed analysis of the time evolution of the solution structure we identified those amino–acid residues responsible for initial binding contacts between proteins, and we propose a mechanism of protein aggregation for these examples.
2 Model and methods
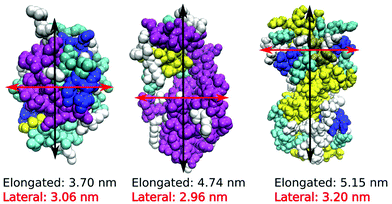
We performed MD computer simulations of aqueous solutions of three short-chain globular proteins, two different lysozyme molecules, hen egg white (HEWL) and the T4 WT* protein, as well as the human lens γ-D crystallin protein (Fig. 1), consisting of between 129 (HEWL) and 173 (γ-D crystallin) amino acid residues. All three proteins are small enough to be manageable within computer simulations. While the phase diagrams for HEWL and γ-D crystallin are known experimentally, the stability of T4 WT* is of particular interest to us since it shows different surface amino acid composition, and the role of its mutated residues in changing effective protein–protein interactions is currently investigated experimentally in our lab. Their crystal structures have been taken from the Protein Data Bank (PDB) and are 1aki.pdb, 1l63.pdb and 1hk0.pdb for HEWL, T4 WT* and γ-D crystallin, respectively.19–21 The choice of these particular pdb structures is to some extent arbitrary and was motivated by specific experimental studies in our group. However, the comparison of the surface amino-acid composition among different pdb structures of the same protein did not reveal changes that would be expected to influence the main results of our study.Our simulation protocol was as follows: first, the database structures were minimized with respect to their energy, solvated in SPC/E water and firstly equilibrated for 4 ns in the NVT ensemble and then also for 4 ns in the NPT ensemble, using the OPLS force field. Net protein charges of +8 on each HEWL and T4 WT* molecule were compensated by an adequate amount of Cl− counterions (see Table 2). No further background electrolyte was added in order to focus on primary residue–residue interactions. We plan to relax this approximation and simplification of the model systems in a future communication in which we focus on the nature and importance of the background electrolyte. Production runs were carried out in the NPT ensemble, using velocity rescaling temperature coupling with a stochastic term and a time constant of 0.1 ps. The Parrinello–Rahman barostat with a time constant of 2.0 ps was used to maintain a pressure of 1 bar. The production run for all simulations lasted for 300 ns. Even though similar in shape and size, the three proteins differ significantly in the characteristic distribution of surface amino acids, summarized in Table 1, as well as in the distribution of secondary structure elements, as indicated by different colours in Fig. 1. Nonetheless, all three investigated proteins have one similarity – a large proportion of arginine residues is located on their surface, which is evident by the fact that arginine is among the top three most frequent amino acids for all three studied proteins.
| HEWL | T4 WT* | γ-D crystallin |
|---|---|---|
| ASN 14 | LYS 13 | ARG 22 |
| ARG 11 | ARG 11 | ASP 12 |
| GLY 10 | ASN 10 | SER 12 |
| SER 7 | ASP 10 | GLY 11 |
| LYS 6 | GLU 8 | GLU 10 |
| THR 6 | THR 8 | GLN 8 |
| ASP 6 | ALA 8 | TYR 8 |
| ALA 4 | GLY 7 | ASN 7 |
| VAL 3 | LEU 5 | HIS 5 |
| CYS 3 | SER 5 | PRO 4 |
| LEU 3 | GLN 5 | LEU 4 |
| TYR 3 | TYR 4 | PHE 3 |
| ILE 2 | VAL 4 | MET 3 |
| GLU 2 | MET 3 | THR 2 |
| TRP 2 | PHE 3 | ILE 2 |
| GLN 2 | PRO 3 | CYS 1 |
| PRO 2 | ILE 2 | LYS 1 |
| HIS 1 | TRP 2 | |
| HIS 1 | ||
| Total: 87 | Total: 112 | Total: 115 |
2.1 All-atom OPLS model and simulation
We have performed all-atom simulations with the OPLS force-field to describe the protein molecules.22 The SPC/E water model was used23 to model the protein aqueous environment. All simulations were performed at constant temperature (see Table 2) and pressure (1 bar) at a protein surface charge distribution corresponding to conditions at pH = 7.0, using the GROMACS simulation engine24 with a time step of 2 fs. The charges of all residues were kept fixed within the simulation, and the most probable protonation arrangement as determined by the OPLS force-field at pH = 7.0 was used, which was hitherto established to be usable for most computer simulation studies of protein solutions.25| Protein | γ (mg mL−1) | T (K) | N water | N proteins+ions | L (nm) | D/10−5 cm2 s−1 |
|---|---|---|---|---|---|---|
| HEWL | 93 | 267 | 124![[thin space (1/6-em)]](https://www.rsc.org/images/entities/char_2009.gif) 615 615 |
16 + 128 | 16 | 0.26 |
| HEWL | 93 | 300 | 124![[thin space (1/6-em)]](https://www.rsc.org/images/entities/char_2009.gif) 615 615 |
16 + 128 | 16 | 0.47 |
| HEWL | 42 | 267 | 142![[thin space (1/6-em)]](https://www.rsc.org/images/entities/char_2009.gif) 004 004 |
8 + 64 | 16.5 | 0.29 |
| HEWL | 42 | 300 | 142![[thin space (1/6-em)]](https://www.rsc.org/images/entities/char_2009.gif) 004 004 |
8 + 64 | 16.5 | 0.65 |
| T4 WT* | 90 | 267 | 124![[thin space (1/6-em)]](https://www.rsc.org/images/entities/char_2009.gif) 850 850 |
12 + 96 | 16 | 0.17 |
| T4 WT* | 90 | 300 | 124![[thin space (1/6-em)]](https://www.rsc.org/images/entities/char_2009.gif) 850 850 |
12 + 96 | 16 | 0.38 |
| T4 WT* | 45 | 267 | 129![[thin space (1/6-em)]](https://www.rsc.org/images/entities/char_2009.gif) 713 713 |
6 + 48 | 16 | 0.33 |
| T4 WT* | 45 | 300 | 129![[thin space (1/6-em)]](https://www.rsc.org/images/entities/char_2009.gif) 713 713 |
6 + 48 | 16 | 0.68 |
| γ-D crystallin | 100 | 300 | 123![[thin space (1/6-em)]](https://www.rsc.org/images/entities/char_2009.gif) 966 966 |
12 + 0 | 16 | 0.32 |
| γ-D crystallin | 100 | 320 | 123![[thin space (1/6-em)]](https://www.rsc.org/images/entities/char_2009.gif) 966 966 |
12 + 0 | 16 | 0.67 |
Standard three-dimensional periodic boundary conditions were applied. No buffer molecules or ions were included in the simulation. An appropriate number of chloride ions was added to the simulation boxes of HEWL and T4 WT* to maintain electroneutrality, while the solutions of the electroneutral γ-D crystallin protein molecules do not contain additional ions. HEWL and T4 WT* solutions were simulated at two different concentrations and temperatures with the intent to study these proteins both inside and outside of the range of experimentally established LLPS conditions. Since the CPU resources available to us did not allow a systematic investigation over a broad range of protein concentrations within the experimentally determined two-phase region, we had to choose concentrations that, according to our experimental data, can be expected to exhibit the LLPS phenomenon. These concentrations are around 40 mg mL−1 and 90 mg mL−1, respectively16,17 for the lysozymes, and around 100 mg mL−1 for crystallin.26 The temperatures in simulations (around 270 K and 300 K) were selected according to the experimentally determined position of the LLPS for the concentrations so that one of them is above and the other one is below the critical temperature. Details of the simulations are summarized in Table 2. Prior to performing any extensive analysis we established that the running protein–protein coordination numbers were reasonably independent of time during the final stages of the 300 ns simulation interval, which is documented in Fig. S3–S5 of the ESI.†
We also examined the mean-square displacement (MSD) as an indicator of the distance diffused by a molecule in the system and thus a measure of the explored portion of te system's relevant phase space:
 | (1) |
Angle brackets denote averaging over all the protein molecules as well as over time origins, τ. In all cases studied, the MSD increased with simulation time as expected in liquid systems, and no “freezing” was observed (see Fig. S6, ESI†), unlike in some force fields like MARTINI, where such undesired features sometimes occur.
3 Results and discussion
3.1 Aggregation conditions in solution
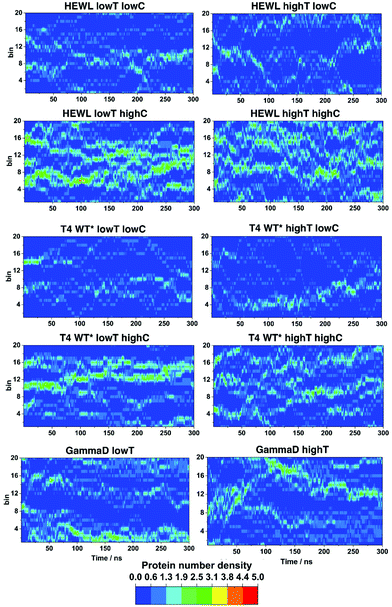
It is well known that the stability of the protein solutions depends on the solution conditions.2 Thermodynamically speaking, the conditions for the so-called two-phase region, in which protein condensates occur in solution, depends on the relative strength of the protein–protein interactions, temperature, pH, pressure, ion strength in the electrolyte buffer and the nature of the ions, etc.2,15 Upon phase separation, the protein solution separates into a protein-rich and a protein-poor phase.27 To asses if we can reproduce the conditions under which this macroscopic phase separation occurs, the time dependence of fluctuations in the local density at different simulation conditions were examined, as described in.27 The local density of protein molecules, ΔN(x,t), defined as the number of the centers of mass of protein molecules found at time t in a slab of width Δx, was computed from the molecular dynamics trajectories, where Δx was 0.8 nm. The results for the x-axis are shown in Fig. 2 for all three proteins studied.For HEWL at low temperature and high concentration, one can clearly discern relatively high density domains, the location of which changes over time. These high density domains are indicative of clustering of protein molecules, which may be the first stage of the LLPS process. At low concentration and high temperature the contrast becomes less pronounced, suggesting a more homogeneous solution, in which smaller clusters reversibly form and decompose. However, we cannot rule out that the simulation time (300 ns in all cases) is insufficient to observe the clustering processes, which can be expected to be slower at lower concentrations and higher temperature.
The density fluctuations of T4 WT* lysozyme behave similarly. At high concentration and at 267 K we again observe distinct high and low density protein regions, but less pronounced than in the HEWL case. Overall, the results suggest the formation of some protein clusters and a significant number of residual monomers. Increasing the temperature or decreasing concentration the protein molecules are even more homogeneously distributed across the solution and the high-density regions become less pronounced. However, even at 45 mg mL−1 and 300 K one can still observe some protein clustering. For γ-D crystallin, we investigated only the influence of temperature at two higher values of 300 and 320 K, since these were within (300 K) and outside (320 K) the experimentally determined conditions of LLPS.26 At the lower temperature once again one observes indications of the protein separating into two domains with different protein density and a distinct boundary forms between them (blue ‘aqueous’ region). At the higher temperature, two regions of different densities are still discernible, but the boundaries are less distinct.
Similar plots were constructed for ΔN(y,t), and ΔN(z,t) (see Fig. S1 and S2, ESI†), and they all show qualitatively same results.
The diffusion coefficients D in Table 2 also provide some indication for clustering. D was calculated by a least squares fit of the Einstein relation MSD(t) = 6D·t + n to the center-of-mass mean square displacement (MSD) of protein molecules in the time interval between 30 and 75 ns (10 to 25% of the total simulation time).28 Lynden-Bell29 found that the intercept n of the fitted straight line could be correlated with the average size of the solvent cage surrounding a certain species while investigating ionic liquids. However, we did not notice such features in our protein solutions, as intercept values of all simulations were very close to zero. For HEWL and T4 WT* the diffusion coefficient is significantly smaller at higher concentration than at lower ones, in particular at the higher temperatures. For γ-D crystallin, no conclusions are possible. For all systems, the diffusion coefficient increases with temperature, as expected from general considerations. The magnitude of D is also consistent with the protein size. HEWL is smaller than T4 WT* and γ-D crystallin, and at 300 K, it also has the largest self-diffusion coefficient. The calculated value for the SPC/E water self-diffusion coefficient of 2.47 cm2 s−1 is close to the experimentally determined value of water in salt free HEWL solutions, being 2.27 cm2 s−1 at a HEWL concentration 50 mg mL−15 and thus slightly lower than the simulation value for pure SPC/E water of 2.78 cm2 s−1 at T = 300 K. The slight reduction in water self-diffusion might be a consequence of the slowing-down of water mobility in the protein solvation shell.
Protein aggregation can be often accompanied by changes in protein structure,30 but previous simulations of aggregation processes suggest that these changes only occur during the later stages.31 To examine the simulated solutions in our study in this respect, we calculated the radii of gyration of the protein molecules as a function of time, results of which are shown in Fig. S7 (ESI†). It is quite evident that the radii of gyration do not change significantly over time. Even in those cases where the density maps of Fig. 2 suggest protein clustering, the structure of the protein molecules, as characterized by the radius of gyration, remains fairly stable; a minor increase over time is observed for T4 WT* at higher temperatures, a minor decrease for HEWL at higher temperature, and a slight decrease for γ-D crystallin at higher temperature, while the runs at the lower temperature do not show any significant trend over the 300 ns time interval, which might, however, also indicate insufficient sampling at the lower temperatures. The general behavior for HEWL is consistent with previous experimental observations for HEWL, where CD spectra also showed no structural changes in aqueous solutions below the critical temperature.5 The radii of gyration calculated here are about 1.38 nm, 1.63 nm, and 1.62 nm for HEWL, T4 WT* and γ-D crystallin, respectively.
To further examine the role of hydration properties, we have calculated the total solvent accessible surface area (SASA) of our proteins in solutions and also radial distribution functions between oxygen atoms of water molecules and the protein center of mass. Results of both calculations can be found in the Supporting information (see Fig. S8 and S9, ESI†). Fig. S8 (ESI†) shows a small plateau between 0 and 1 nm, which is indicative of a few water molecules being incorporated into the protein core. The effect is especially pronounced in the solutions of T4 WT* lysozyme, less in γ-D crystallin solutions, and even less in the HEWL solutions. Near the protein surface, the relative amount of water is slightly increased relative to the bulk water level due to hydration of polar protein groups by water, except for the simulation of the 45 mg mL−1 solution of T4 WT* at 300 K, which shows, in the region around 2.5 nm, a slight decrease of relative water densities, which is possibly due to clustering. No significant changes in protein hydration are observed in the remaining simulations, neither when varying temperature, nor for different concentrations. The extent of clustering in each protein solution is more evident when looking at the total SASA (sum of SASA of all proteins in solution; Fig. S9, ESI†). There, one can notice a very small decrease in SASA in solutions with low protein concentration, since no significant clustering of proteins is observed. At the higher protein concentrations this reduction is, on the other hand, slightly more pronounced, as larger protein assemblies are formed which diminish the protein surface available for hydration. This trend is particularly visible in γ-D crystallin solutions, where the extent of self-association appears to be higher than for HEWL or T4 WT*. Despite this, one can still conclude that clustering in solutions with high protein content does not lead to major dehydration of protein molecules. Nevertheless, a potential impact of hydration water is still taken into account when performing the analysis of residue–residue interactions, since the chosen interparticle cut-off distances are not limited to direct contacts only, but also allow for the presence of solvent separated interactions between residues of two proteins.
3.2 Protein cluster analysis
Our principal focus is on the protein–protein interactions and the propensity for specific interactions between residues and pairs of residues. We first characterized the distribution of protein molecules through the protein–protein radial distribution functions (RDFs). Here, we only want to summarize the main insights from these RDFs. The reader is referred to Fig. S10 of the ESI† for a depiction of the center-of-mass RDFs between protein centers.When comparing different simulations, the variation of features is rather erratic, which is mostly a consequence of the fact that the 300 ns simulation time is not long enough to completely average out time-dependent protein arrangements. However, the simulation time is sufficient to elucidate the most important residues that initiate contacts between proteins. Some observable trends in the RDFs are consistent with those of the density fluctuations in Fig. 2. The calculated RDFs demonstrate that the positions of major peaks denoting proteins in contact depend not solely on the conditions in the solutions, but also on the details of relative orientation between the slightly aspherical protein molecules.
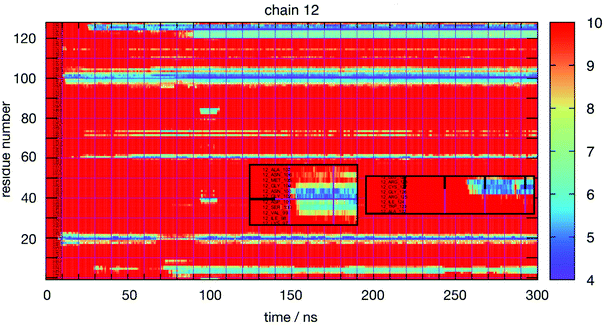
Thus, a more detailed analysis of RDFs will be ineffective to reveal the most interesting features of lysozyme–lysozyme interactions. Instead, we have performed an in-depth analysis of the interactions between individual residues between two protein molecules. Towards this goal we have monitored the time-dependence between all residue–residue distances between all pairs of protein molecules for each simulation. The residue–residue distance is defined as the minimum distance between any pair of heavy atoms (thus, ignoring all hydrogen atoms) between two residues on different molecules. To reduce the raw data to a manageable level, we collected only ‘events’ as a function of time, protein molecule pair and residue pair, for which the minimum distance was at some time smaller than 1 nm. From these raw data we constructed various graphical representations that help us elucidate the details of protein interactions. Fig. 3 shows, as an example, for each amino acid residue of the 12th molecule in the HEWL simulation at 93 mg mL−1 HEWL and 300 K, the closest distance of this particular residue to any other protein residue as a function of time. The minimum distance (in Å) is indicated by the color bar. Minimum distances larger than 10 Å are not distinguished. The graph indicates rather stable interactions of this molecule, although some transient interactions occur on the time scale of 10 nanoseconds. The insets show for two examples the initial interaction dynamics which eventually stabilizes.
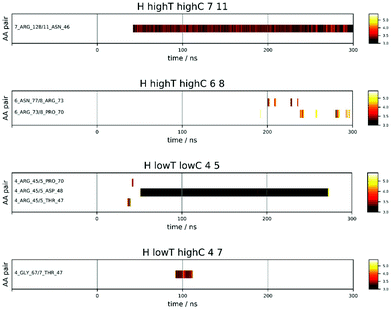
Fig. 4 shows a few examples of the time dependence of the interaction dynamics of individual residue pairs from HEWL simulations. Compared to the distance map of Fig. 3, the data shown are strongly reduced, in the following way: a color code is only assigned to distances less than 6 Å. Note that solvent mediated residue–residue contacts are also encompassed by this criteria. In addition, a particular residue pair will only become monitored when no other pair was monitored during the 2 ns period before this. Thus, all pairs that interact at some later time as a consequence of their proximity to the original pair are excluded. Finally, we also exclude all spurious interactions that last for less than 2 ns. With these settings, one observes a substantial variability of patterns. For example, for protein pair 7 and 11 in the 93 mg mL−1 run at 300 K a persistent interaction between Arg 128 of protein 7 and Asn 46 of protein 11, which starting after around 40 ns. For the same run, one sees between protein molecules 6 and 8 several intermittent (longer than 2 ns) interactions between Asn and Arg and, slightly later, between Arg and Pro, which all do not produce a long-lasting contact. In the low temperature run at 42 mg mL−1 the interaction between molecules 4 and 5 initially produces a short-lived Arg-Thr contact, followed by an even shorter-lived Arg-Pro contact, before, about 10 ns later, a very-long-lived but not permanent contact between Arg 45 of molecule 4 and Asp 48 of molecule 5 forms. Finally, in the 93 mg mL−1 run at 267 K a temporary contact lasting about 25 ns forms between Gly and Thr.
In summary, it is obvious that some pairs come close but do not interact for a long time, some interact for many nanoseconds and dissociate again. Other re-associate again after some time, and even other pairs come into contact at some point and stick to each other permanently. Please take note that at any given time there may be plenty of residue pairs in the vicinity, that are excluded from representation according to the rules given above. In addition to the four exemplary cases shown in Fig. 4, we summarize all interaction maps in Fig. S11–S33 in the ESI.†
Only some specific surface regions participate in the contact formation, which is consistent with previous experimental observations of so-called protein–protein interfaces, where several neighbouring amino-acid residues participate.4 On each protein, we identified four most frequently occurring regions that are involved in contacts. These are summarized in Table 3 together with their amino-acid composition. Examining these regional compositions, one can observe that arginine is the only amino-acid residue common to all proteins. Arginine also appears to be present in all regions that ever come into contact with other protein molecules during the simulations (see Fig. S11–S33, ESI†), which is in good agreement with experimental results.
The most frequently observed regions on each protein are graphically illustrated in Fig. 5. One notes that they are mostly located along the longer axes of the protein molecules, including both ends of molecules. This is consistent with our conclusions drawn from pair distribution functions: besides end-to-end contacts, the two protein molecules form also contacts aligning in a side-by-side fashion.
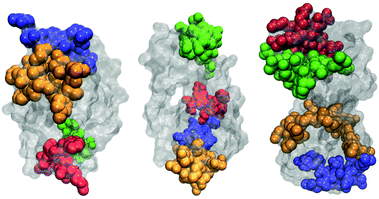 | ||
| Fig. 5 Four regions of protein molecules that most frequently participate in protein–protein contacts for HEWL (left), T4 WT* (middle), and γ-D crystallin (right). | ||
By visually examining the clusters of protein molecules that appear during the simulation we noticed that the initial contacts between protein molecules were indeed formed through surface arginine residues on two different molecules in the anti-parallel orientation (see also above and Fig. 6).
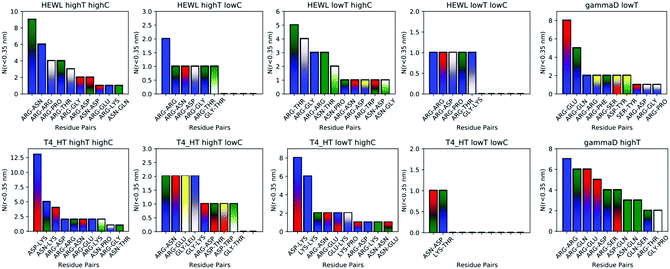
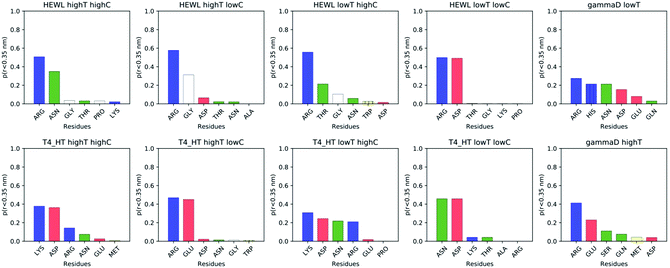
While instructive from a mechanistic perspective, Fig. 3–6 lack statistical significance. Consequently we analysed all contact maps in a statistical way: First, we sampled all initiating residue pairs, i.e. those that are visible in Fig. 4 and in the corresponding figures in the Supporting Information, and ranked these pairs according to their relative abundance (Fig. 7). From these data we extracted the abundance of individual amino acid residues (Fig. 8). These data provide information about the initial contacts, which may or may not lead to a lasting protein pair. At the same time, we sampled the relative abundance of all close residue–residue pairs (Fig. 9), independent of whether the interactions initiated the particular protein dimerization, or whether it occurred as the consequence of some other initiating interaction. Again, we extracted the abundance of individual amino acids (Fig. 10) from these data.
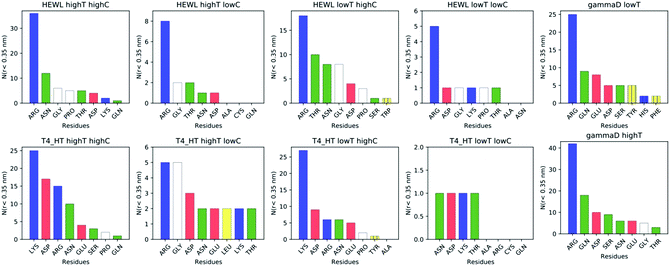 | ||
| Fig. 8 Occurrence of each distinct amino acid (irrespective of sequence number) in the initiating residue pairs (for definition see text). | ||
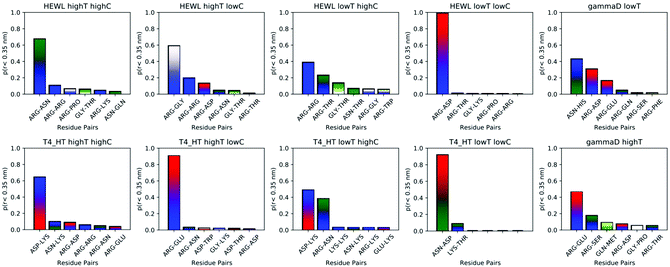 | ||
| Fig. 9 Most frequent residue pairs whose distance at some time is smaller than 3 Å. The y-axis denotes the fraction of each contact within all contacts during the simulation. | ||
3.3 Mechanism of aggregation
Except for the case of T4 WT* at low temperature and concentration, where poor overall statistics prevents drawing reliable conclusions, it is evident from Fig. 7 that the arginine amino acid is most commonly participating both overall and in the initial pair formation. Only for T4 WT*, also lysine residues appear to be important. In addition, arginine is frequently paired with asparagine, aspartic acid, glutamic acid and lysine, all of which have either charged or polar side chains capable of forming hydrogen bonds. Our observation is consistent with previous findings that indicate that arginine in hot-spots is able to bind to other amino acids through hydrogen bonding and salt-bridges.32It has been found experimentally that the addition of arginine to solutions can suppress protein aggregation.33 One of the proposed mechanisms is that arginine residues bind to the protein surface and thereby reduce the stickiness of the protein molecules, making it less prone to aggregation.34 Further corroborating evidence shows that arginines in aqueous solution by themselves show a tendency for stacking their methylene groups to form clusters with head to tail hydrogen bonding.35,36 Our simulation results are consistent with these findings, as we also observe partial parallel and anti-parallel stacking of methylene groups in the simulations (see Fig. 6), which can be interpreted as partial burying of arginine residues inside the protein-rich phase. Such alignment of arginine residues points towards the presence of hydrophobic interactions that can provide stabilization of initial protein contacts (dimers). Pace et al. have already recognized that hydrophobic interactions can substantially contribute to the stability of protein clusters, since the average free energy contribution of burying a single methylene group was determined to be 1.1 ± 0.5 kcal mol−1,37 which is certainly a non-negligible interaction. We also observed that the arginine residue chains on the protein surface have a tendency to bind to other amino acid residues, commencing the contact between two protein molecules.
Fig. 8 shows, similarly to Fig. 7, the data sorted by relative abundance of individual amino acid residues. This figure clearly demonstrates that HEWL and γ-D crystallin interactions are strongly dominated by arginine residues. For T4 WT* the picture is less clear, as in most but not all cases (the simulation at the higher temperature and lower concentration being an exception), lysine is the most frequently occurring initiating amino acid residue. This is not unexpected, given the fact that lysine is the most frequent residue on the T4 WT* protein surface.
As trajectory inspection showed occasional rearrangement of the protein–protein configuration after the initial contact, we also collected the data in a slightly different way (Fig. 9 and 10). In Fig. 9 we collected the overall probability during the simulation to observe specific residue pairs in close contact, independent on when this occurred during the interaction interval. Similarly, Fig. 10 provides the overall probability of a single residue to be found in contact with another protein. For HEWL, the overall conclusion persists that arginine dominates protein–protein interactions. While for T4 WT* a certain prevalence for lysine and arginine still exists, the prevalence, measured over the entire simulation time, is less clear than for the initial contacts. For γ-D crystallin, the prevalence for arginine is clearly visible over the entire simulation time, but somewhat less pronounced than when focusing only on the initial stage of interaction.
3.4 Parameter dependence
The distributions in Fig. 7–10 have been obtained with the same settings as discussed earlier: a distance below 6 Å must be maintained for more than 2 ns, the distance must at least once drop below 3 Å. For the initiating pairs, in addition no interaction must be present within the 2 ns before. In this way we can reduce a wide range of residue pairs to only those that matter most and eliminate short-lived ‘random’ encounters. In addition, we also can exclude the formation of “secondary” contacts, which arise as a consequence of a previous (initial) contact. We have varied these parameters in several ways. We have reduced the interaction and wait times to 1 ns and also changed the cut-off distances from 3 and 6 Å to 4 and 7 Å and 5 and 10 Å, respectively. While some details change, the main conclusions are not very sensitive to these varied parameter settings. Our general observation of the effects of cut-off distance criteria on the detection of residue pairs is that one amino acid in most of the pairs always remains identical, whilst the other one can vary, suggesting that the selectivity for a specific pairs is not very high. With increasingly larger cut-off distances (4 to 7 Å and 5 to 10 Å) it becomes possible that the specific residues, which are observed to cause the initial contacts between two approaching proteins not only interact directly with each other, but also with nearby residues at somewhat larger distances within the extended cut-off range. Because with increasing cut-off distances, in general, more interactions contribute at a given time, we chose the relatively tight contact criteria with cut-off distances between 3 and 6 Å for the main analysis, as this cut-off criterion is most likely the most informative one for uncovering the leading amino acids in the process of protein clustering.4 Conclusions
By analysing various protein–protein interfaces it has been observed that, while protein–protein interfaces were relatively large in the range between 1150 and 4660 Å2, only few key residues contribute significantly to the binding free energy of protein–protein complexes.4 These so-called hot-spots exhibit distinctive amino-acid composition: tryptophan and tyrosine appear to bind through aromatic π and hydrophobic interactions, while arginine residues bind through hydrogen bonding and salt-bridges.32 Arginine in general has a tendency to bind to protein surfaces, and is as such often used as a suppressor of protein aggregation.33Here, we have reported extensive atomistic molecular dynamics simulations of three different globular proteins, hen egg white lysozyme (HEWL), T4 WT*, and γ-D crystallin. Altogether ten systems with different temperatures and protein concentrations were studied. While even the 300 ns simulation runs performed here do not allow statistically unambiguous conclusions, we nevertheless could show that arginine residues located on the protein surfaces indeed form strong bonds with residues of neighbouring molecules. Arginine seems to be particularly instrumental in facilitating the initial contact, as is evident by its higher prevalence initially in comparison with the entire simulation interval. For T4 WT*, the lysine plays an important role in addition to arginine, but overall the results are less conclusive.
Conflicts of interest
There are no conflicts to declare.Acknowledgements
The authors gratefully acknowledge computing time granted by the Center for Computational Sciences and Simulation (CCSS) of the University of Duisburg-Essen and provided on the supercomputer magnitUDE (DFG grants INST 20876/209-1 FUGG, INST 20876/243-1 FUGG) at the Zentrum für Informations- und Mediendienste (ZIM). S. B. and B. H.-L. acknowledge the financial support from the Slovenian Research Agency (research core funding No. P1-0201). B. H.-L. appreciates the support of the National Institutes of Health (NIH) Grant RM1GM135136. S. B. is grateful for the financial support provided by Slovenian Research Agency through the Young Researcher Programme.References
- D. Bratko, T. Cellmer, J. M. Prausnitz and H. W. Blanch, Biotechnol. Bioeng., 2007, 96, 1–8 CrossRef CAS PubMed.
- Y. Shin and C. P. Brangwynne, Science, 2017, 357, 1–11 CrossRef PubMed.
- Y. Wang, A. Lomakin, S. Kanai, R. Alex and G. B. Benedek, Langmuir, 2017, 33, 7715–7721 CrossRef CAS.
- I. S. Moreira, P. A. Fernandes and M. J. Ramos, Proteins, 2007, 68, 803–812 CrossRef CAS.
- T. Janc, M. Lukšič, V. Vlachy, B. Rigaud, A.-L. Rollet, J.-P. Korb, G. Mériguet and N. Malikova, Phys. Chem. Chem. Phys., 2018, 20, 30340–30350 RSC.
- S. Brudar and B. Hribar-Lee, Biomolecules, 2019, 9, 1–18 CrossRef PubMed.
- Z. Seraj, M. R. Groves and A. Seyedarabi, Sci. Rep., 2019, 9, 1–11 Search PubMed.
- O. Lichtarge, H. Bourne and F. Cohen, J. Mol. Biol., 1996, 257, 342–358 CrossRef CAS.
- F. Musiani and A. Giorgetti, in Early Stage Protein Misfolding and Amyloid Aggregation, ed. M. Sandal, Academic Press, 1st edn, 2017, vol. 329 of International Review of Cell and Molecular Biology, ch. 2, pp. 49–77 Search PubMed.
- M. Feig, I. Yu, P.-H. Wang, G. Nawrocki and Y. Sugita, J. Phys. Chem. B, 2017, 121, 8009–8025 CrossRef CAS PubMed.
- A. Morriss-Andrews and J.-E. Shea, Annu. Rev. Phys. Chem., 2015, 66, 643–666 CrossRef CAS PubMed.
- A. Morriss-Andrews and J.-E. Shea, J. Phys. Chem. Lett., 2014, 5, 1899–1908 CrossRef CAS PubMed.
- S. J. Marrink, H. J. Risselada, S. Yefimov, D. P. Tieleman and A. H. de Vries, J. Phys. Chem. B, 2007, 111, 7812–7824 CrossRef CAS PubMed.
- S. Kmiecik, D. Gront, M. Kolinski, L. Wieteska, A. E. Dawid and A. Kolinski, Chem. Rev., 2016, 116, 7898–7936 CrossRef CAS PubMed.
- S. Alberti, A. Gladfelter and T. Mittag, Cell, 2019, 176, 419–434 CrossRef CAS PubMed.
- J. Grigsby, H. Blanch and J. Prausnitz, Biophys. Chem., 2001, 91, 231–243 CrossRef CAS PubMed.
- V. G. Taratuta, A. Holschbach, G. M. Thurston, D. Blankschtein and G. B. Benedek, J. Phys. Chem., 1990, 94, 2140–2144 CrossRef CAS.
- Y. Zhang and P. S. Cremer, Proc. Natl. Acad. Sci. U. S. A., 2009, 106, 15249–15253 CrossRef CAS PubMed.
- P. Artymiuk, C. C. F. Blake, D. W. Rice and K. S. Wilson, Acta Crystallogr., Sect. B: Struct. Sci., Cryst. Eng. Mater., 1982, 38, 778–783 CrossRef.
- N. Nicholson, D. E. Anderson, S. Dao-pin and B. W. Matthews, Biochemistry, 1991, 30, 9816–9828 CrossRef PubMed.
- A. Basak, O. Bateman, C. Slingsby, A. Pande, N. Asherie, O. Ogun, G. B. Benedek and J. Pande, J. Mol. Biol., 2003, 328, 1137–1147 CrossRef CAS.
- M. J. Robertson, J. Tirado-Rives and W. L. Jorgensen, J. Chem. Theory Comput., 2015, 11, 3499–3509 CrossRef CAS PubMed.
- H. J. C. Berendsen, J. R. Grigera and T. P. Straatsma, J. Phys. Chem., 1987, 91, 6269–6271 CrossRef CAS.
- M. J. Abraham, T. Murtola, R. Schulz, S. Páll, J. C. Smith, B. Hess and E. Lindahl, SoftwareX, 2015, 1–2, 19–25 CrossRef.
- S. Donnini, F. Tegeler, G. Groenhof and H. Grubmüller, J. Chem. Theory Comput., 2011, 7, 1962–1978 CrossRef CAS PubMed.
- M. L. Broide, C. R. Berland, J. Pande, O. O. Ogun and G. B. Benedek, Proc. Natl. Acad. Sci. U. S. A., 1991, 88, 5660–5664 CrossRef CAS PubMed.
- K. Mochizuki, T. Sumi and K. Koga, Sci. Rep., 2016, 6, 1–10 CrossRef PubMed.
- M. Abraham, D. van der Spoel, E. Lindahl, B. Hess and the GROMACS development team, GROMACS User manual version 5.1.2, University of Groningen, Uppsala University, Stockholm University and the Royal Institute of Technology, Groningen, The Netherlands. Uppsala and Stockholm, Sweden, 2016 Search PubMed.
- R. M. Lynden-Bell, Mol. Phys., 2019, 118, 1–8 Search PubMed.
- R. L. Redler, D. Shirvanyants, O. Dagliyan, F. Ding, D. N. Kim, P. Kota, E. A. Proctor, S. Ramachandran, A. Tandon and N. V. Dokholyan, J. Mol. Cell Biol., 2014, 6, 104–115 CrossRef CAS.
- D. Matthes, V. Gapsys and B. L. de Groot, J. Mol. Biol., 2012, 421, 390–416 CrossRef CAS PubMed.
- A. A. Bogan and K. S. Thorn, J. Mol. Biol., 1998, 280, 1–9 CrossRef CAS PubMed.
- R. C. K. Reddy, H. Lilie, R. Rudolph and C. Lange, Protein Sci., 2005, 14, 929–935 CrossRef.
- S. Tomita, H. Yoshikawa and K. Shiraki, Biopolymers, 2011, 95, 695–701 CrossRef CAS.
- D. Shukla and B. L. Trout, J. Phys. Chem. B, 2010, 114, 13426–13438 CrossRef CAS PubMed.
- U. Das, G. Hariprasad, A. S. Ethayathulla, P. Manral, T. K. Das, S. Pasha, A. Mann, M. Ganguli, A. K. Verma, R. Bhat, S. K. Chandrayan, S. Ahmed, S. Sharma, P. Kaur, T. P. Singh and A. Srinivasan, PLoS One, 2007, 2, 1–9 CrossRef PubMed.
- C. N. Pace, H. Fu, K. L. Fryar, J. Landua, S. R. Trevino, B. A. Shirley, M. M. Hendricks, S. Iimura, K. Gajiwala, J. M. Sholtz and G. R. Grimsley, J. Mol. Biol., 2011, 408, 514–528 CrossRef CAS PubMed.
Footnote |
| † Electronic supplementary information (ESI) available. See DOI: 10.1039/d0cp05160h |
| This journal is © the Owner Societies 2021 |

