
Infrared photodissociation spectroscopic investigation on VO+ and NbO+ hydrolysis catalyzed by water molecules†
Ke
Xin
a,
Yinjuan
Chen
a,
Luning
Zhang
 a,
Bing
Xu
a,
Xuefeng
Wang
*a and
Guanjun
Wang
*b
a,
Bing
Xu
a,
Xuefeng
Wang
*a and
Guanjun
Wang
*b
aSchool of Chemical Science and Engineering, Shanghai Key Lab of Chemical Assessment and Sustainability, Tongji University, 1239 Siping Road, Shanghai, 200092, China. E-mail: xfwang@tongji.edu.cn
bDepartment of Chemistry, Collaborative Innovation Center of Chemistry for Energy Materials, Shanghai Key Laboratory of Molecular Catalysis and Innovative Materials, Fudan University, 2005 Songhu Road, Shanghai 200438, China. E-mail: gjwang@fudan.edu.cn
First published on 26th November 2020
Abstract
We investigate the hydrolysis of vanadium/niobium monoxide cation (VO+/NbO+) with water molecules in the gas phase. Cationic argon-tagged intermediates, TMO(H2O)nArm+ (TM = V, Nb; n = 1–2, m = 1–2), are prepared for examination using infrared photodissociation spectroscopy. The structures of the intermediates are elucidated by comparing them with simulated spectra. VO(H2O)Ar+ or NbO(H2O)Ar+ (for n = 1) is intrinsically a hydrated adduct, represented by H2O–VOAr+ or H2O–NbOAr+, rather than a dihydroxide, V(OH)2Ar+ or Nb(OH)2Ar+. However, when a second H2O molecule is involved (for n = 2), the dihydroxide V(OH)2(H2O)Ar+ and trihydroxide HNb(OH)3Ar+ are formed. In this process, the six-member cyclic transition state formed by two H2O molecules markedly reduces the hydrogen transfer energy barrier based on our calculations. This work provides more precise experimental evidence for the Grotthuss-like mechanism proposed in the studies of hydrolysis and tautomerization reactions.
Introduction
Hydrolysis is an important category of chemical reactions. Generally, a key intermediate in this process is the hydrated adduct of the substrate, and the rate-determining step is the transfer of a hydrogen atom from H2O to produce the hydrolysate via a transitional state (Scheme 1); the processes, such as chemical reactions of DNA molecules,1 macromolecular assemblies,2 biological membranes,3 and water oxidation reactions4 are predominantly found in nature. Theoretical studies have indicated that the hydrogen-transfer energy barriers increase with respect to the deviation of angle X⋯H⋯Y from 180°.5 If another H2O molecule is involved in the reaction, a transitional state can have a six-member cyclic configuration containing a water wire. Logically, involvement of more H2O molecules in the reaction will result in an angle X⋯H⋯Y of the transitional state of approximately 180°, leading to an energy barrier reduction of the reaction, i.e., the reactions are catalyzed by H2O molecules. The hydrogen atom transfer in the hydrolysis process has been utilized to interpret the mechanisms of various reactions, such as water splitting by surface6–10 and cluster,11–13 inorganic small molecule reactions with water,14,15 tautomerization of organic molecules16,17 and proton transfer in biochemical systems.18–20 However, most of these studies were completed based on theoretical calculations.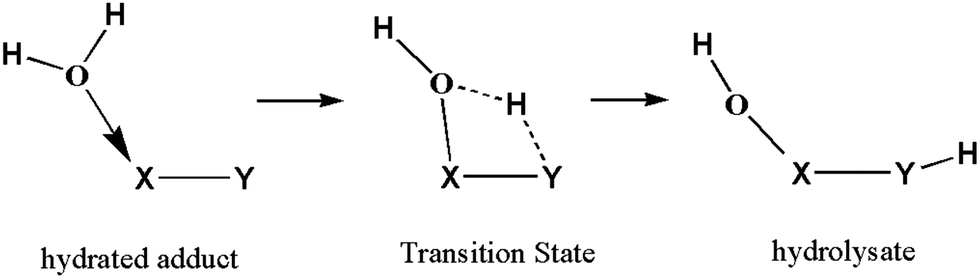 | ||
| Scheme 1 The prototypic mechanism of the hydrolysis reaction. | ||
Infrared photodissociation spectroscopy is an alternative tool to interrogate structures of gaseous ions and the reaction mechanism. The experiments involve mass-selection of a given “parent” ion prior to irradiation of the selected ion using tunable infrared light, and the ionic fragmentation products (“daughter ions”) can be identified through a subsequent stage of mass/charge analysis. A variety of cation–water M+/++/+++(H2O)n species (where M is a metal atom) complexes in the gas phase have been examined using infrared photodissociation spectroscopy, as demonstrated by the work of many groups. Duncan et al. investigated transition metal ion solvation;21,22 Lisy and coworkers studied hydrated alkali metal ion complexes;23,24 and Zhou and Ohashi elucidated coinage metal cation–water complexes.25–27 Williams examined solvation of di- and trivalent metal cations by water molecules;28–30 Asmis investigated the solvation of salt by water molecules.31,32 Recently, a few reaction intermediates from metal oxides (MxOy+/−) and H2O were studied.33–36 Very recently, we examined the structures of the intermediates for the hydrolysis reaction of ScO+ using argon-tagging infrared photodissociation spectroscopy.37 The experimental spectra indicate that the hydrated H2O–ScO+ is produced when only one H2O molecule is involved rather than the hydrolyzed Sc(OH)2+, although the latter is far more stable than the former, i.e., the second water molecule can catalyze the hydrogen transfer to produce the dihydroxide H2O–Sc(OH)2+.
These results prompted us to extend our research to the hydrolysis reactions of VO+ and NbO+ with H2O molecules. In one-H2O reactions, the hydrated adducts were found exclusively for both cases; however, in two-H2O reactions, a dihydroxide for vanadium and a trihydroxide for niobium were identified. This reaction mechanism provides a more accurate model for the Grotthuss-like mechanism proposed in studies of hydrolysis and tautomerization reactions.
Experimental and theoretical methods
All experiments were performed on a time-of-flight mass spectrometer (TOF-MS) coupled with infrared photodissociation spectrometry. The details of the apparatus have been described previously.38,39 Briefly, ions were generated in a Smalley-type laser vaporization supersonic cluster source. The rotating metal target (vanadium/niobium) was ablated by a focused pulsed laser beam from a Nd:YAG laser (Continuum, Minilite II, 10 Hz repetition rate, λ = 1064 nm). The cationic TMO(H2O)nArm+ (TM = V, Nb; n = 1–2, m = 1–2) complexes were generated during the ablation process in a pulsed expansion of helium gas seeded with saturated water vapor, 0.01% O2 and 20% Ar at about 1.2 MPa stagnation pressure. After being collimated into the skimmer, the ions were analyzed using a TOF-MS. The ions of interest (“parent ions”) were selected using a mass gate and subjected to irradiation by a tunable infrared laser (provided by an OPO/OPA system, 3 cm−1 bandwidth in wide-band mode, 1.5 cm−1 bandwidth in narrow-band mode, Laser Vision) pumped by a Nd:YAG laser (Continuum, Surelite EX); they then dissociated into the ionic fragmentation products (“daughter ions”) by losing a neutral argon atom. The infrared spectra were acquired by monitoring the yield of fragment ions as a function of the wavenumber of the tunable infrared laser. A five-grid-plate assembly integrating the mass gate, deceleration and reacceleration ion optics was used in our home-made machine, which enabled us to collect the fragment ions and obtain the spectra with high performance. In this study, the infrared laser was tuned in the region of 3000–3850 cm−1 at 2 cm−1 per step, and the signals were averaged over 500 laser shots at each step. For the feature which is suspected to be due to poorly separated multiple peaks, the spectrum was repeated in the narrow-band mode of the OPO/OPA and 1 cm−1 per step. The wavenumber of the infrared laser was calibrated using the absorption spectrum of ammonia.Density functional theory (DFT) calculations were conducted to identify the stoichiometric VO(H2O)nArm+ (n = 1–2, m = 1–2) cations and assign the experimental IR bands. The calculations were performed via the Gaussian 09 program package40 using the hybrid B3LYP method,41,42 in which the aug-cc-pVTZ basis sets were used for all atoms. Also, more precise single-point energies were calculated at the CCSD(T)/aug-cc-pVTZ level based on the optimized geometries. The harmonic vibrational frequencies were scaled by a 0.968 scale factor37 and were represented by Gaussian curves with a full width at half-maximum (FWHM) of 4 cm−1. The same calculations were performed to determine the structures of the NbO(H2O)nArm+ (n = 1–2, m = 1–2) cations, in which the 6-311++G** basis set was used for H, O and Ar, and the SDD basis set was used for the metal atom. The harmonic vibrational frequencies were scaled by a 0.96 scale factor.34 The relative energies were acquired entirely with the zero-point-energy correction.
Results and discussion
Mass spectra
The representative mass spectra of TMO(H2O)nArm+ (TM = V, Nb; n = 1–2, m = 0–2) cations produced by the reactions of the laser-ablated species with an H2O/O2/Ar/He mixture are shown in Fig. 1. The dominant products are stoichiometric VO(H2O)n+ and NbO(H2O)n+, respectively. The progressions of the argon-tagged VO(H2O)nAr+ and NbO(H2O)nAr1–2+ cations are presented with appreciable intensity. The argon-tagging technology exhibited convincing performance in spectroscopic studies of V(H2O)nAr+ and Nb(H2O)nAr+ reported by Duncan43–46 and in the very recent examination of ScO(H2O)nAr+ in our lab.37 Accordingly, we expect the argon-tagging technology to be suitable for this work.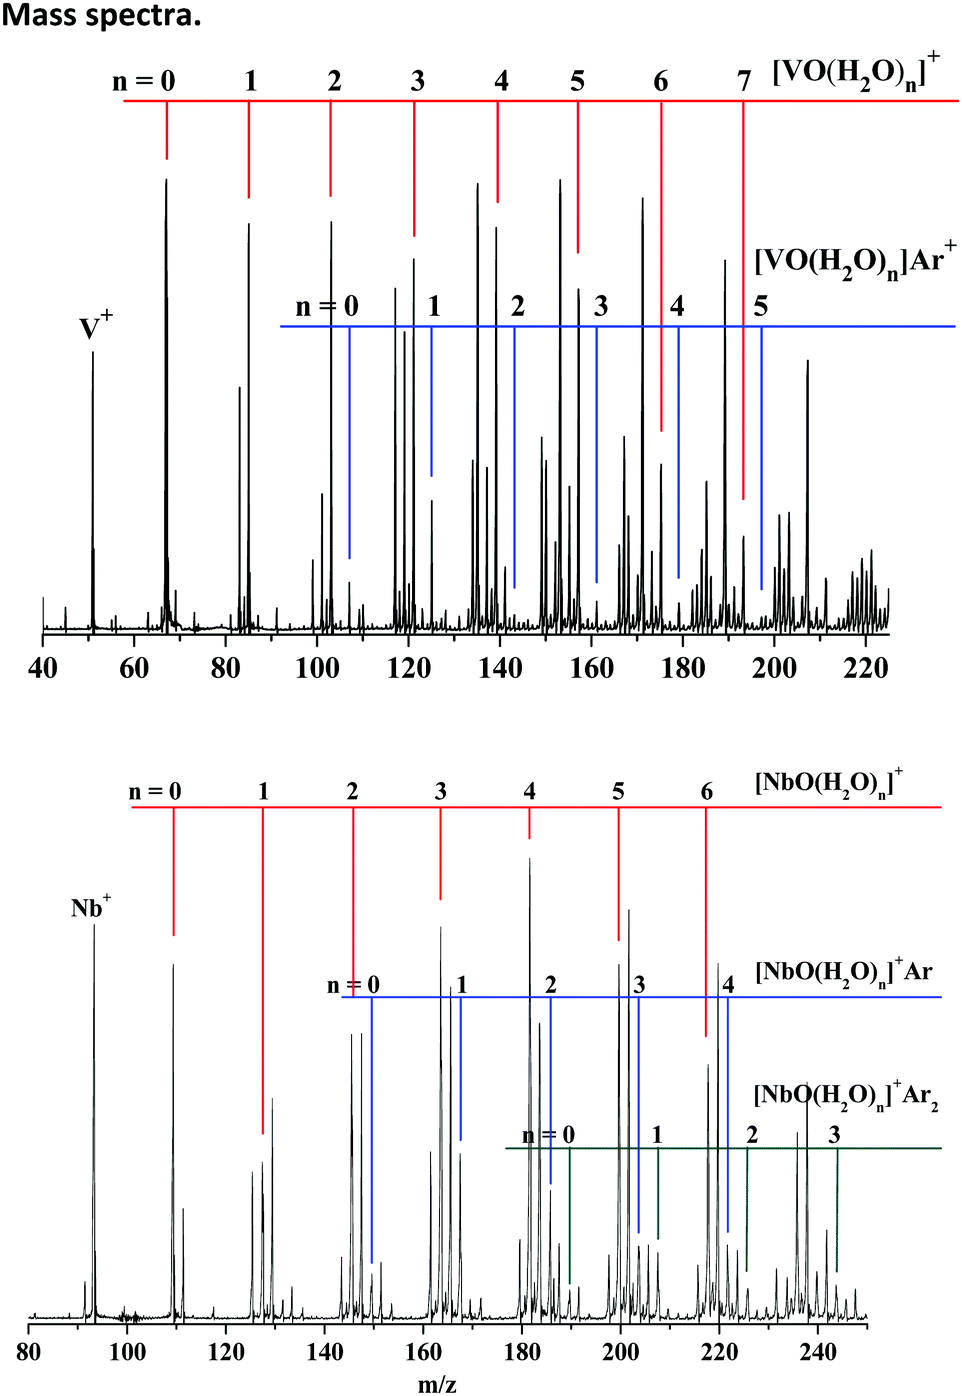 | ||
| Fig. 1 Mass spectra of the cations produced by pulsed laser vaporization of vanadium/niobium targets in the expansion of the helium/argon mixture seeded with H2O and O2. | ||
Infrared photodissociation spectra
VO+ has been theoretically47,48 and experimentally49 determined to have a triplet ground state. According to previous calculations, the first singlet low excited state is higher than the ground state by 26 kcal mol−1.48 Again, numerous theoretical studies show that the singlet traces of the potential surface are much higher in energy than the triplet traces in reactions between VO+ and various small molecules.50,51 Accordingly, we focused on the triplet state in this study. However, some calculated structures of the singlet state are presented in the associated figures as well to validate our structural assignments in the context. All the optimized structures are displayed in Fig. S1–S5 of the ESI.† Spectral comparisons of the most important calculated structures to the experimental structures are shown in Fig. 2 and 3, respectively, and the frequencies of the simulated bands are listed in Table 1. For reference, the simulated spectra of more isomers are displayed in Fig. S6–S8 of the ESI† for overall spectral comparisons.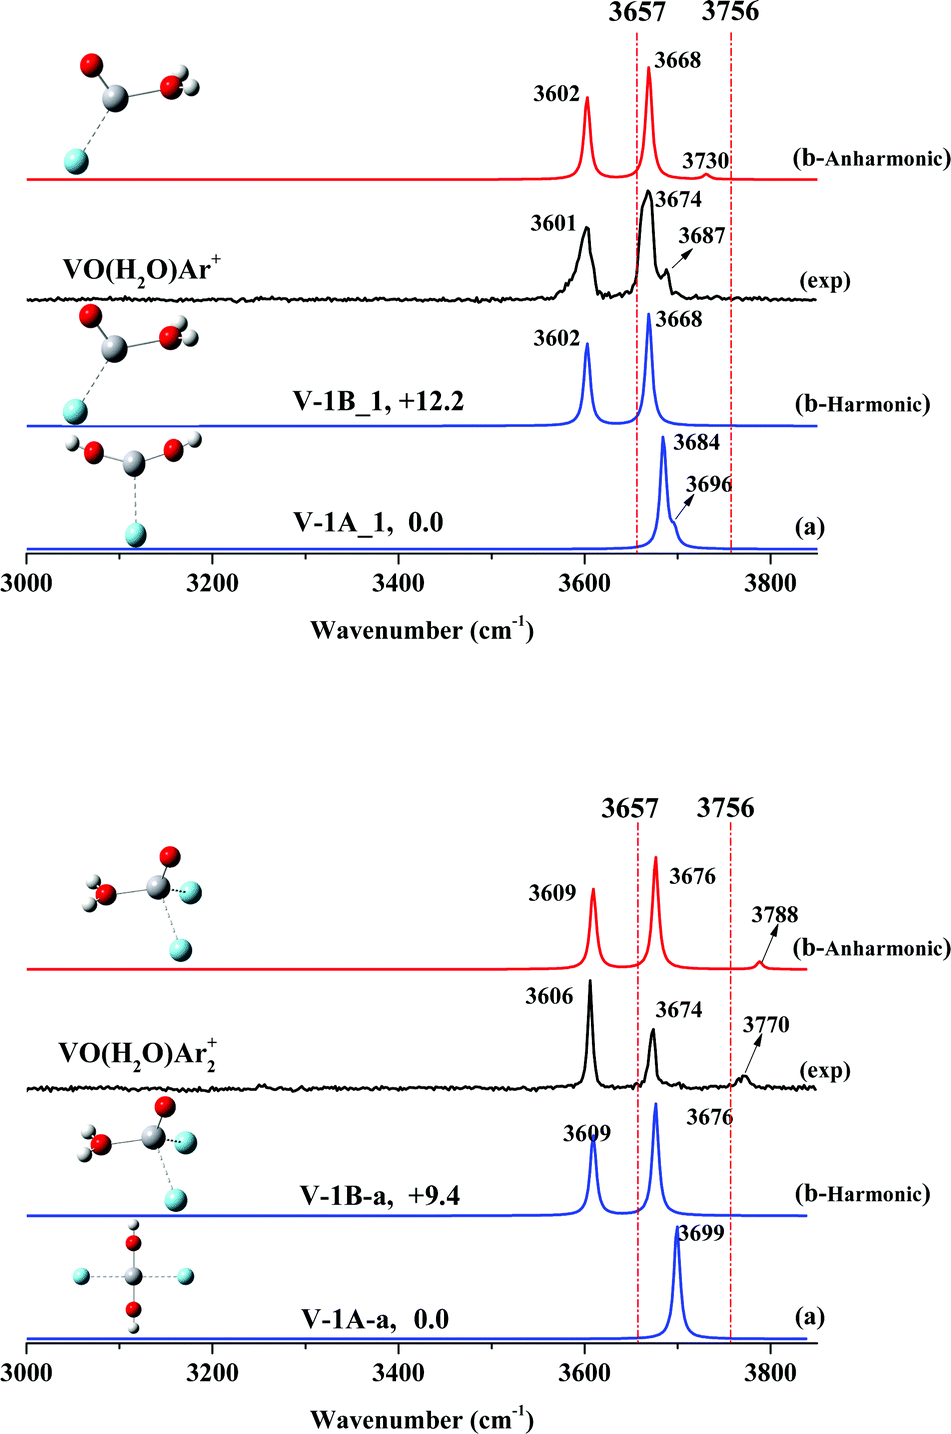 | ||
| Fig. 2 Experimental infrared spectra (black) and simulated vibrational spectra (anharmonic vibrational spectra in red and harmonic vibrational spectra in blue) in the O–H stretching frequency region of VO(H2O)Ar+ (top) and VO(H2O)Ar2+ (bottom). The two dashed red lines correspond to the symmetric (3657 cm−1) and antisymmetric (3756 cm−1) stretches of the isolated water molecule, respectively. The relative energies (with ZPE correction) are given in kcal mol−1. | ||
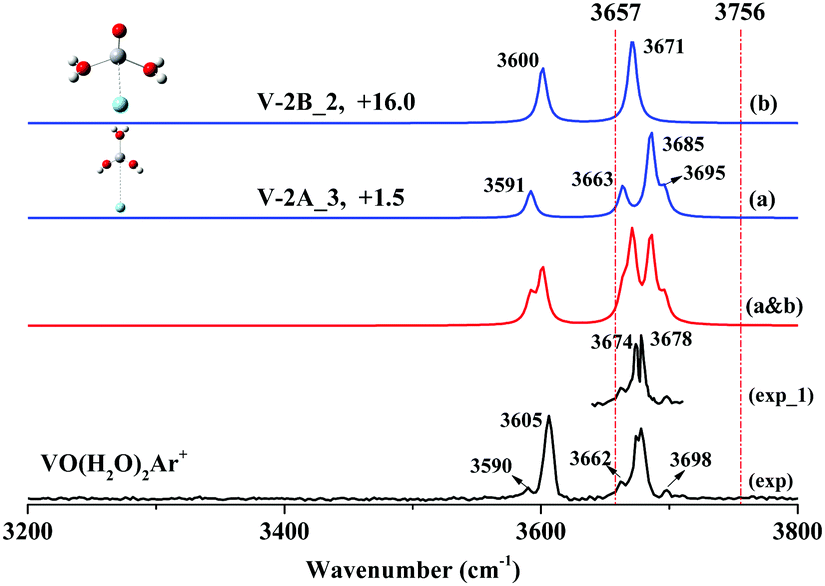 | ||
| Fig. 3 Experimental infrared spectra (black), simulated vibrational spectra (blue) and linear superposition of the simulated vibrational spectrum (red) in the O–H stretching frequency region of VO(H2O)2Ar+. The two dashed red lines correspond to the symmetric (3657 cm−1) and antisymmetric (3756 cm−1) stretches of the isolated water molecule, respectively. The relative energies (with ZPE correction) are given in kcal mol−1. | ||
| Cluster | ΔE (kcal mol−1) | Theoretical freq. (cm−1) | Experimental freq. (cm−1) |
|---|---|---|---|
| VO(H2O)1Ar+ | |||
| V-1A_1 (C2v3B1) | 0.0 | 3684, 3696 | |
| V-1B_1 (Cs3A′′) | +12.2 | 3602, 3668 | 3601, 3674, 3687 |
| VO(H2O)1Ar2+ | |||
| V-1A_a (D2h3A′) | 0.0 | 3699, 3710 | |
| V-1B_a (Cs3A′′) | +9.4 | 3609, 3676 | 3606, 3674, 3770 |
| VO(H2O)2Ar+ | |||
| V-2A_3 (C2v3B1) | +1.5 | 3591, 3663, 3685, 3695 | 3590, 3662, 3678, 3698 |
| V-2B_2 (Cs3A′′) | +16.0 | 3600, 3602, 3670, 3671 | 3605, 3674 |
Our calculations predict that the global minimum of stoichiometric VO(H2O)+ has a structure of dihydroxide V(OH)2+ (Fig. S1: V-1A, ESI†), similar to the recently reported Sc(OH)2+. It is likely that the second isomer is a hydrated adduct H2O–VO+ (Fig. S1: V-1B, ESI†) as well; it is less stable than V-1A by 0.3 kcal mol−1. In addition, an isomer with a V–H bond (Fig. S1: V-1C, ESI†) is much higher in energy than V-1A by 32.5 kcal mol−1.
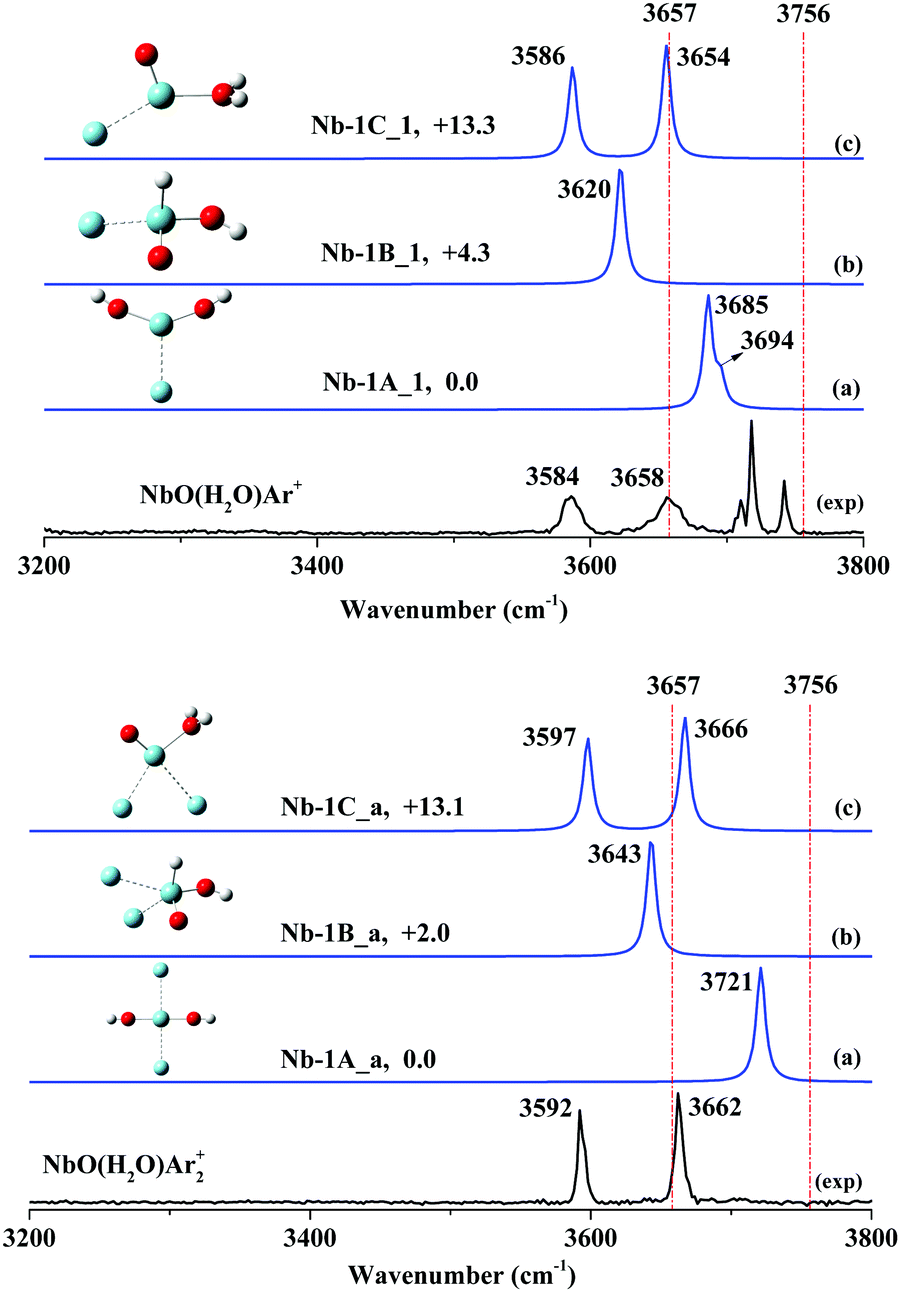
NbO+ has also been theoretically determined to have a triplet ground state. However, the singlet (1A′) excited electronic states were found to only lie 4.84 kcal mol−1 above the ground state.52 Spin inversion existed in the activation of CO2 by NbO+.52 Accordingly, we focus on both the triplet state and single state in this study. All the optimized structures consisting of triplet states and singlet states are displayed in Fig. S12–S17 of the ESI.† The spectral comparisons of the most likely calculated structures to the experimental structures are shown in Fig. 4 and 5, respectively, and the frequencies of the simulated bands are listed in Table 2. The spectra of more isomers are displayed in Fig. S18–S21 of the ESI† for overall spectral comparisons.
 | ||
| Fig. 4 Experimental infrared spectra (black) and simulated vibrational spectra (blue) in the O–H stretching frequency region of NbO(H2O)Ar+ (top) and NbO(H2O)Ar2+ (bottom). The two dashed red lines correspond to the symmetric (3657 cm−1) and antisymmetric (3756 cm−1) stretches of the isolated water molecule, respectively. The relative energies (with ZPE correction) are given in kcal mol−1. | ||
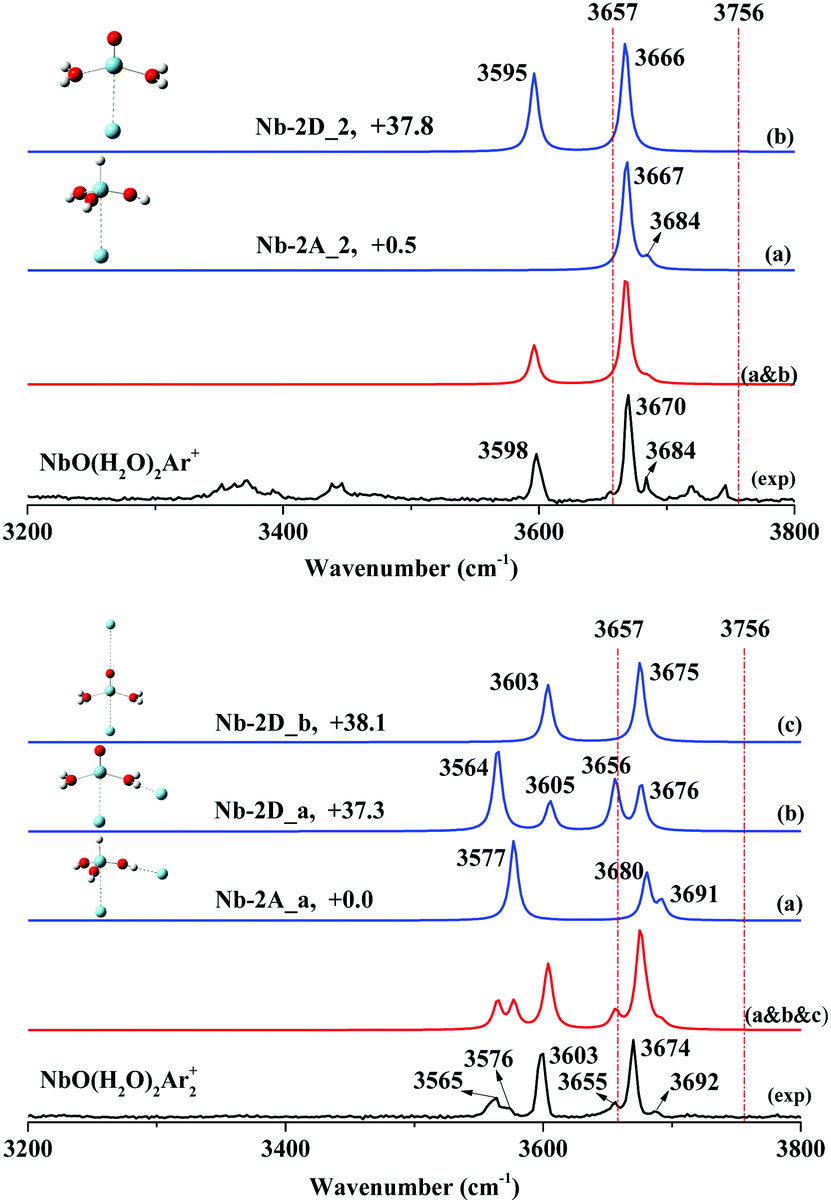 | ||
| Fig. 5 Experimental infrared spectra (black), simulated vibrational spectra (blue) and linear superposition of the simulated vibrational spectra (red) in the O–H stretching frequency region of NbO(H2O)2Ar+ (top) and NbO(H2O)2Ar2+ (bottom). The two dashed red lines correspond to the symmetric (3657 cm−1) and antisymmetric (3756 cm−1) stretches of the isolated water molecule, respectively. The relative energies (with ZPE correction) are given in kcal mol−1. | ||
| Cluster | ΔE (kcal mol−1) | Theoretical freq. (cm−1) | Experimental freq. (cm−1) |
|---|---|---|---|
| NbO(H2O)1Ar+ | |||
| Nb-1A_1(C2v3B1) | 0.0 | 3685, 3694 | 3584, 3658 |
| Nb-1B_1(C11A) | +4.3 | 3620 | |
| Nb-1C_1(Cs3A′) | +13.3 | 3586, 3654 | |
| NbO(H2O)1Ar2+ | |||
| Nb-1A_a(C2v3B1) | 0.0 | 3721, 3728 | 3592, 3662 |
| Nb-1B_a(C11A) | +2.1 | 3643 | |
| Nb-1C_a(Cs3A′) | +13.1 | 3597, 3666 | |
| NbO(H2O)2Ar+ | |||
| Nb-2A_2(C3v1A′′) | +0.5 | 3667*2, 3684 | 3670, 3684 |
| Nb-2D_2(Cs3A′′) | +37.8 | 3595, 3666 | 3598, 3670 |
| NbO(H2O)2Ar2+ | |||
| Nb-2A_a(C11A) | +0.0 | 3577, 3680, 3691 | 3576, 3674, 3692 |
| Nb-2D_a(C13A) | +37.3 | 3564, 3605, 3656, 3676 | 3565, 3603, 3655, 3674 |
| Nb-2D_b(C13A) | +38.1 | 3603, 3675 | 3603, 3674 |
VO(H2O)+
As shown in Fig. 2, the spectrum of stoichiometric VO(H2O)Ar+ exhibits two main features at 3601 and 3674 cm−1, together with a very weak band at 3687 cm−1. The two main bands are close to the frequencies of the hydrated complex H2O–VAr+ at 3604 and 3694 cm−1 reported by Duncan,45,46 which have been assigned to the symmetric and anti-symmetric O–H stretch of the ligated H2O molecule. Lately, we found two O–H stretches of the ligated H2O molecule at 3588 and 3679 cm−1 for the hydrated complex H2O–ScOAr+.37 Accordingly, we assigned the two main features of VO(H2O)Ar+ at 3601 and 3674 cm−1 to the symmetric and anti-symmetric O–H stretches of a hydrated adduct, H2O–VOAr+.Our calculations obtain two argon-tagged isomers for the hydrated adduct H2O–VOAr+ (Fig. S3, ESI†), which features two inequivalent acceptor sites (vanadium and hydrogen) for the argon atom (V-1B_1 and V-1B_2). The isomer with argon accepted by vanadium is lower in energy and matches the experiment better in the spectrum than that with argon accepted by hydrogen (Fig. S6, ESI†). Note that as shown in Fig. 2, the hydrated adduct H2O–VOAr+ (Fig. 2: V-1B_1) is less stable than the dihydroxide V(OH)2Ar+ (Fig. 2: V-1A_1) by 12.2 kcal mol−1; however, the simulated spectrum of V-1B_1 reproduces the experimental values much better, which confirms our assignment of the hydrated adduct H2O–VOAr+ (V-1B_1). The weak band at 3687 cm−1 can be assigned to a combination of the O–H stretch with a low frequency mode, and these combinations have been observed in the infrared spectra of various hydrated metal cations.25,53–55
In order to confirm our assignment, we performed a two-argon-tagging experiment, and the spectrum of stoichiometric VO(H2O)Ar2+ exhibits two main features at 3606 and 3674 cm−1 together with a weak feature at 3770 cm−1. The simulated spectrum of V-1B_a exhibits two bands centered at 3639 and 3707 cm−1, consistent with the experimental frequencies. Note that a new band at 3770 cm−1 appeared, which must be a combination band.
We performed anharmonic frequency calculations for both VO(H2O)Ar+ and VO(H2O)Ar2+. As shown in Fig. 2, the simulated absorptions match the observed values reasonably well. When tagged with argon atoms, both O–H stretching modes were barely perturbed by the argons; however, the H–O–H wagging vibrations obviously blue-shifted, resulting in combination bands at 3687 cm−1 (one-argon-tagged) and 3770 cm−1 (two-argon-tagged).
VO(H2O)2+
Fig. 3 shows the experimental spectrum of stoichiometric VO(H2O)2Ar+, where two broad bands centered at 3605 and 3678 cm−1 and three weak features at 3590, 3662 and 3698 cm−1 were observed. It is notable that the feature at 3678 cm−1 obviously exhibits a broader profile than that at 3605 cm−1. When the spectrum was recorded at 1 cm−1/step (Fig. 3: exp_1) using the narrow-band mode of OPO/OPA, the 3678 cm−1 band split into two well-resolved peaks at 3674 and 3678 cm−1 with nearly equivalent intensities.The global minimum (Fig. S2: V-2A, ESI†) is a hydrated dihydroxide H2O–V(OH)2+ based on our calculations. The second isomer (Fig. S2: V-2B, ESI†) is a di-hydrated adduct (H2O)2–VO+, which is higher in energy than V-2A by 15.4 kcal mol−1. V-2A and V-2B have three and two sites to accept argon atoms, respectively, forming five argon-tagged derivatives (Fig. S4: V-2A_1, V-2A_2, V-2A_3, V-2B_1 and V-2B_2, ESI†). As shown in Fig. 3(a and b), the simulated spectrum of V-2B_2 combined with that of V-2A_3 reproduces the experimental features very well. Note that V-2A_3 is responsible for the small features at 3590, 3662, and 3698 cm−1 and the feature at 3678 cm−1. The bands at 3678 and 3698 cm−1 are ascribed to the symmetric and antisymmetric hydroxyl stretches of V-2A_3. Our assignments for the hydroxyl stretches are supported by Garand's systematic examination on the O–H bands of hydroxyl in gaseous MOH(H2O)+ for various metals.56–59 The bands at 3590 and 3662 cm−1 are due to the ligated H2O stretches of V-2A_3, while the 3605 and 3674 cm−1 bands are due to the hydrated adduct V-2B_2.
Obviously, in the reaction of VO+ with two H2O molecules, the hydrated adduct and the dihydroxide are both produced in almost equal yield, in contrast with the reaction of ScO+, where the dihydroxide is exclusively generated when two H2O molecules are involved.
NbO(H2O)+
The infrared photodissociation spectra of NbO(H2O)Ar1,2+ are shown in Fig. 4 along with the bands predicted by the frequency calculations. Two dominant bands centered at 3584 and 3658 cm−1 are attributed to the hydrated adduct NbO(H2O)Ar+. Moreover, a group of features can be seen, including a broad band at 3184 cm−1 and a weak band at 3648 cm−1, together with other bands at 3710, 3718 and 3742 cm−1. These features are ascribed to the argon-tagged hydrated proton H(H2O)7Ar+,60 which has an identical m/q to NbO(H2O)Ar+. The observed spectrum agrees very well with the simulated IR spectrum of isomer Nb-1C_1 (Fig. 4), which has a Cs geometry and 3A′ state (Fig. S12, ESI†), although the hydrated complex H2O–NbOAr+ is less stable than the global minimum Nb(OH)2Ar+ (Fig. S12: Nb-1A_1, C2v, 3B1, ESI†) by 13.3 kcal mol−1. Two main features of NbO(H2O)Ar+ at 3589 and 3673 cm−1 can be assigned to the symmetric and anti-symmetric O–H stretch of a hydrated adduct, H2O–NbAr+. Note that two similar bands at 3589 and 3673 cm−1 due to H2O–NbAr+ were assigned to the O–H stretch of the ligated H2O molecule.45To further support our experimental observations, we performed experimental and theoretical investigations of NbO(H2O)Ar2+ cation. As shown in Fig. 4, two resolved features at 3592 and 3662 cm−1 clearly illustrate two O–H stretching modes. We identified that two-argon-tagged H2O–NbOAr2+ (Fig. S16: Nb-1C_a, Cs, 3A′, ESI†) has two simulated bands centered at 3597 and 3666 cm−1, which agree excellently with the experimental bands. Additionally, we noticed that the frequency difference of the two observed O–H stretching modes is 74 cm−1 for NbO(H2O)Ar+ and 70 cm−1 for NbO(H2O)Ar2+, respectively, consistent with that of a ligated water molecule. The comparison of the theoretical calculations and the experimental IRPD spectrum confirmed our assignment of the hydrated adduct.
NbO(H2O)2+
The experimental and simulated spectra of NbO(H2O)2Ar+ are illustrated in Fig. 5 (top), where two strong bands at 3598 and 3670 cm−1 and a weak shoulder band at 3684 cm−1 were observed. The other bands at 3372, 3443, 3719 and 3745 cm−1 are ascribed to the hydrated proton H(H2O)8Ar+.60 Based on our DFT calculations, four isomers of stoichiometric NbO(H2O)2+ were obtained, of which the global minimum is the niobium trihydroxide cation H–Nb(OH)3+ (Fig. S13: Nb-2A, C3v, 1A′′, ESI†) with three OH groups. The fourth stable isomer is the hydrated complex (H2O)2–NbO+ (Fig. S13: Nb-2D, C2v, 3A′′, ESI†), which is higher in energy than Nb-2A by 37.3 kcal mol−1.The frequency calculation shows that argon-tagged H–Nb(OH)3Ar+ (Fig. S15: Nb-2A_2, C3v, 1A′′, ESI†) has a very strong degenerated symmetric O–H stretch at 3670 cm−1 and a very weak antisymmetric O–H stretch at 3692 cm−1, which agree well with the experimental bands at 3670 and 3684 cm−1. The complex (H2O)2–NbOAr+ (Fig. S15: Nb-2D_2, C3v, 3A′′, ESI†) has two simulated bands centered at 3595 and 3666 cm−1, which match the experimental bands at 3598 and 3670 cm−1, respectively. Note that the symmetric O–H stretch for HNb(OH)3Ar + at 3670 cm−1 is totally covered by the same mode for (H2O)2–NbOAr+.
The two-argon-tagged spectrum (NbO(H2O)2Ar2+) is shown in Fig. 5 (bottom); six O–H stretches were observed at 3565, 3576, 3603, 3655, 3674 and 3692 cm−1 in the experimental spectrum. Note that the C3v symmetry must be reduced and more O–H stretches should be observed as two argon atoms are tagged to HNb(OH)3+. Based on our calculations, as one more argon was tagged to HNb(OH)3Ar+, the structure Nb-2A_a with an argon atom accepted by hydrogen (OH group) and the other by vanadium is the lowest in energy, where perturbation of argon causes the O–H stretch to red-shift to 3577 cm−1. Obviously, as shown in Fig. 5, there are two acceptor sites for additional argon atoms, and two isomers (Nb-2D_a and Nb-2D_b) are very close in energy. The spectrum (Fig. 5a–c), as a superposition of the three simulated spectra, exhibits six well-resolved bands, consistent with the experimental frequencies. We summarize the assignments of the observed bands in Table 2.
Reaction mechanism
Our investigation shows that the reactions (nH2O + MO+, M = V, Nb) produce the hydrated adduct for n = 1, and the hydroxide and hydrated adduct coexist with a comparable yield for n = 2. Fig. 6 shows the energy profiles for the reactions of MO+ with H2O molecule. For MO+ + H2O, the water complex is formed exothermically by 75.3 kcal mol−1 (V) and 95.4 kcal mol−1 (Nb), respectively. However, further hydrogen transfer to form hydroxide needs to surpass energy barriers of 52.5 kcal mol−1 (V) and 65.6 kcal mol−1 (Nb). In our experiments, only the hydrated adduct H2O–MO+ was observed, indicating that the hydrogen transfer is stopped by the energy barriers.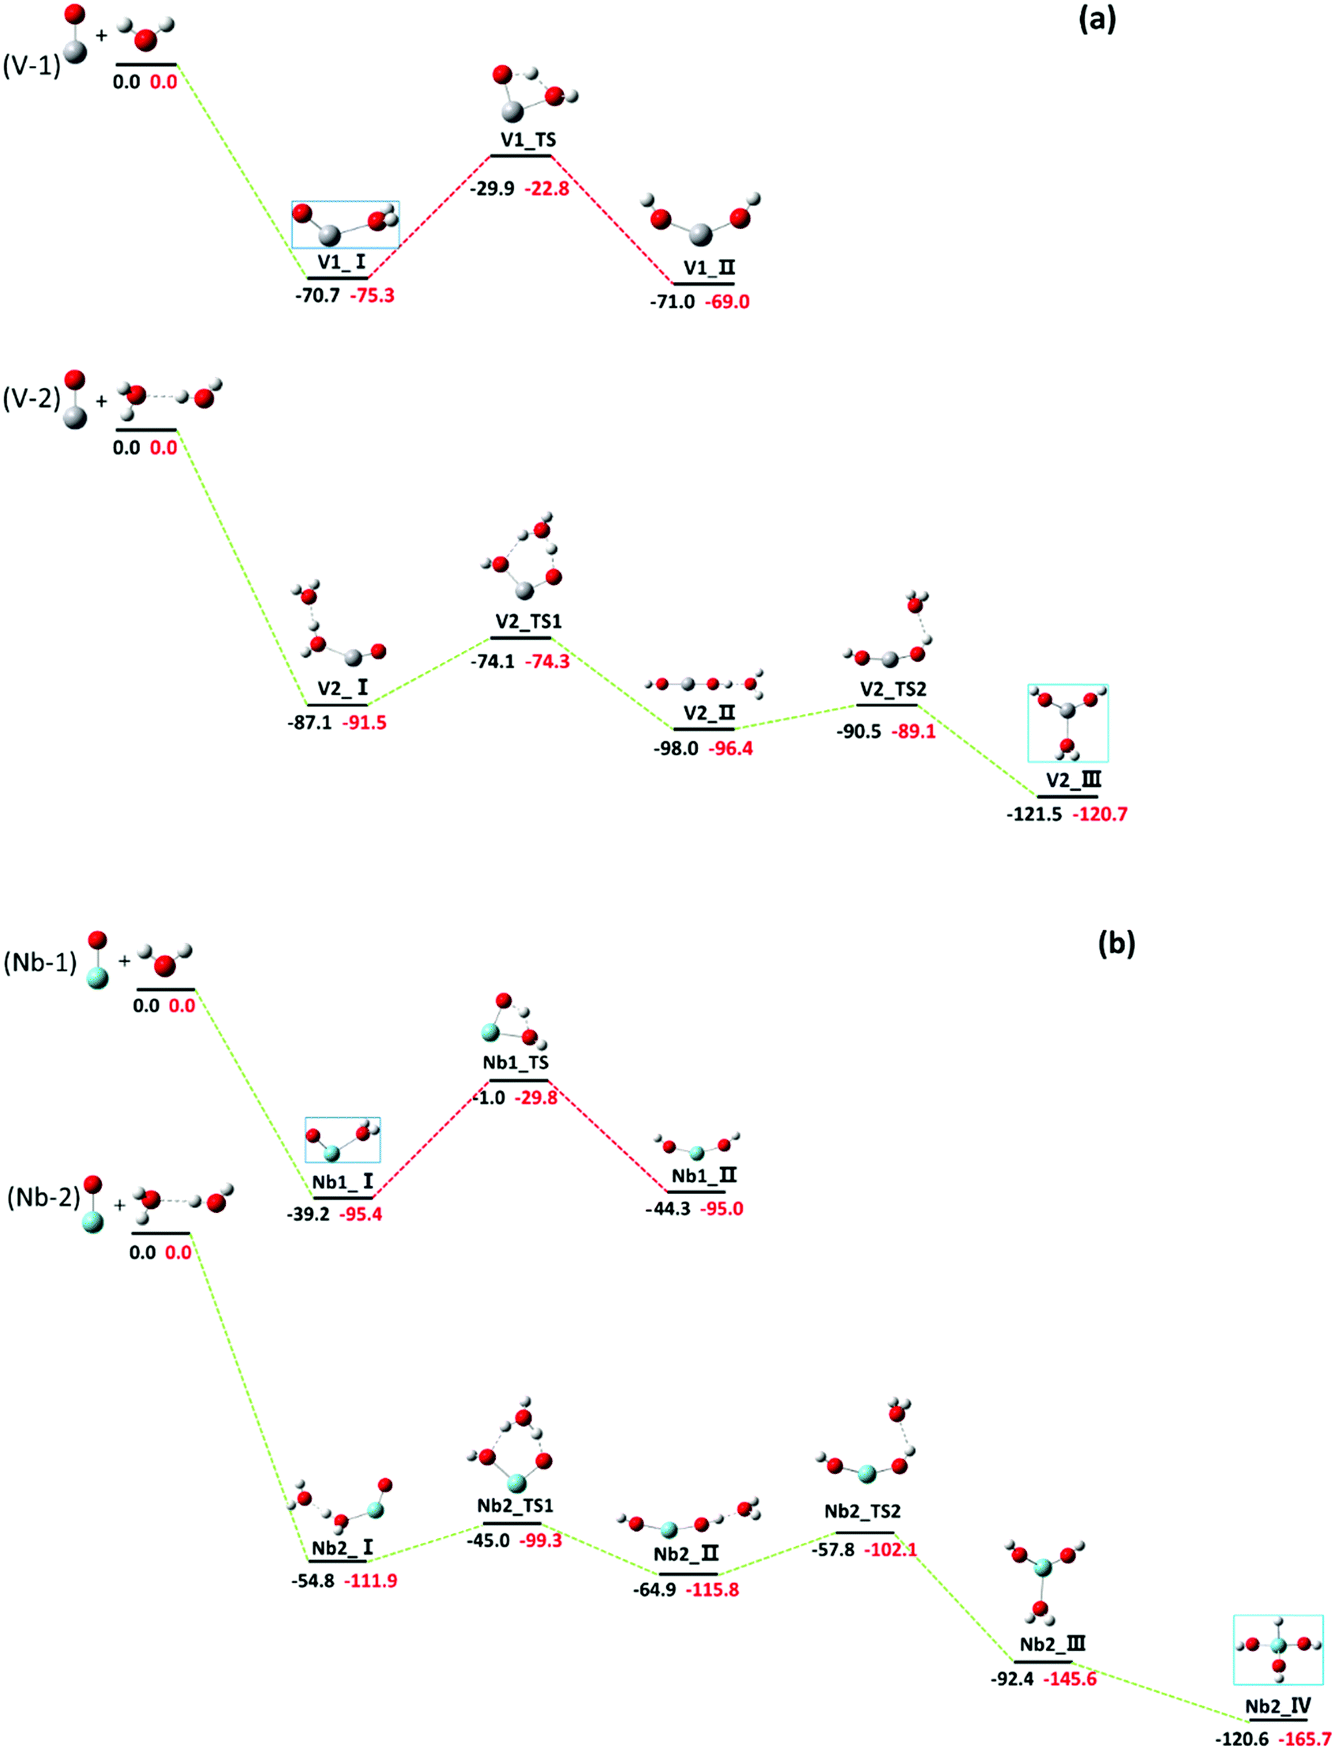 | ||
| Fig. 6 (a) Potential energy surfaces for the reactions of VO+ + H2O → VO(H2O)+ (V-1) and VO+ + 2H2O → V(OH)2(H2O)+ (V-2). The relative energies at 0 K calculated by DFT at the B3LYP/aug-CC-PVTZ (in black) and CCSD(T)/CC-PVTZ (in red) levels are in kcal mol−1. (b) Potential energy profiles for the reactions of NbO+ + H2O → Nb(H2O)+ (Nb-1) and NbO+ + 2H2O → HNb(OH)3+ (Nb-2). The relative energies at 0 K calculated by DFT at the B3LYP/SDD levels (in black) and CCSD(T)/SDD (in red) are in kcal mol−1. The assigned structures are marked with blue boxes. | ||
As MO+ reacted with two water molecules, the hydrogen transfer energy barriers were calculated to be 17.2 and 12.6 kcal mol−1, respectively, for V and Nb, with a six-member cyclic transitional state, as shown in Fig. 6, which are much lower in energy than those in the case of one water molecule. Note that the energy barrier is reduced to less than 5 kcal mol−1 in the ScO+ reaction with two water molecules.13 Our experiments testified again that in the metal oxide hydrolysis process, the energy barrier is reduced dramatically by the formation of a six-member cyclic transitional state, which is the key step for hydrogen transfer. The hydrolysis reaction of TMO+ (TM = V and Nb) catalyzed by H2O molecules has been theoretically examined by Andres et al.,15 where the Gibbs free energy profile of the reactions from the hydrated adduct of VO+/NbO+ to the dihydroxide were reported. The barrier energies were reduced significantly with six-member cyclic configuration, which accounts for our experimental results very well. The hydrogen transfer from the ligated H2O to the oxides is the rate-determining step for the hydrolysis. Obviously, the six-member cyclic transition state formed by two H2O molecules reduces the hydrogen transfer energy barrier markedly, which is quite similar to the Grotthuss mechanism describing proton-hopping along a water wire organized by hydrogen bonds.11,61,62 In numerous theoretical studies, the Grotthuss-like mechanism has been employed to interpret intracluster hydrolysis reactions catalyzed by additional H2O molecules, and this report provides a more precise experimental instance for the Grotthuss-like mechanism of intracluster hydrolysis.
It was found that the reaction of VO+ with two water molecules produces H2O–V(OH)2+ dihydroxide (V2_III) rather than H–V(OH)3+ (V2_IV), while the trihydroxide H–Nb(OH)3+ (Nb2_IV) is the final product in the reaction of NbO+ with two water molecules. The vanadium favours the lower oxidation state while the niobium favours the higher oxidation state,63 which is easily understandable when the outmost orbitals for bonding are considered for both metal atoms. It is clear that the d orbitals are particularly important for transition metal bonding. For vanadium, the H2O–V(OH)+ dihydroxide is stable because the 3d orbital is core-like and less reactive; however, strong participation of 4d electrons for niobium induced further hydrogen transfer to form the trihydroxide H–Nb(OH)3+.
Conclusions
We investigated the structures of stoichiometric TMO(H2O)nArm+ (TM = V, Nb; n = 1–2, m = 1–2) cations using infrared photodissociation (IRPD) spectroscopy combined with density functional theory calculations. VO(H2O)Ar+ and NbO(H2O)Ar+ were characterized to be hydrated adducts of VO+ and NbO+, respectively. VO(H2O)2Ar+ is a mixture of the hydrated adduct and dihydroxide with equivalent abundance; however, NbO(H2O) 2Ar+ is a mixture of the hydrated adduct in quantities and a small amount of trihydroxide. This result provides a more precise experimental instance of the Grotthuss-like mechanism of intracluster hydrolysis.Conflicts of interest
There are no conflicts of interest to declare.Acknowledgements
This work was financially supported by the National Natural Science Foundation of China (Grant No. 21873020, 21873070).Notes and references
- L. M. Rossi, A. Neves, R. Horner, H. Terenzi, B. Szpoganicz and J. Sugai, Inorg. Chim. Acta, 2002, 337, 366–370 CrossRef CAS.
- M. D. Pluth, R. G. Bergman and K. N. Raymond, J. Org. Chem., 2009, 74, 58–63 CrossRef CAS PubMed.
- H. T. Sasmazel, S. Manolache and M. Guemuesderelioglu, J. Biomater. Sci. Polym. Ed., 2009, 20, 1137–1162 CrossRef CAS PubMed.
- S. Abanades and G. Flamant, Sol. Energy, 2006, 80, 1611–1623 CrossRef CAS.
- S. Scheiner, Extraction of the Principles of Proton Transfers by ab initio Methods, Plenum, New York, 1992 Search PubMed.
- K. C. Hass, W. F. Schneider, A. Curioni and W. Andreoni, Science, 1998, 282, 265–268 CrossRef CAS PubMed.
- K. C. Hass, W. F. Schneider, A. Curioni and W. Andreoni, J. Phys. Chem. B, 2000, 104, 5527–5540 CrossRef CAS.
- J. Fester, M. Garcia-Melchor, A. S. Walton, M. Bajdich, Z. Li, L. Lammich, A. Vojvodic and J. V. Lauritsen, Nat. Commun., 2017, 8, 14169 CrossRef CAS PubMed.
- L. Giordano and A. M. Ferrari, J. Phys. Chem. C, 2012, 116, 20349–20355 CrossRef CAS.
- L. Giordano, J. Goniakowski and J. Suzanne, Phys. Rev. Lett., 1998, 81, 1271–1273 CrossRef CAS.
- S. Álvarez-Barcia and J. R. Flores, J. Chem. Phys., 2011, 134, 244305 CrossRef PubMed.
- S. Ohmura, F. Shimojo, R. K. Kalia, M. Kunaseth, A. Nakano and P. Vashishta, J. Chem. Phys., 2011, 134, 244702 CrossRef PubMed.
- J. R. Sambrano, J. R. Andres, L. Gracia, V. S. Safont and A. Beltran, Chem. Phys. Lett., 2004, 384, 56–62 CrossRef CAS.
- K. Morokuma and C. Muguruma, J. Am. Chem. Soc., 1994, 116, 10316–10317 CrossRef CAS.
- E. J. Meijer and M. Sprik, J. Phys. Chem. A, 1998, 102, 2893–2898 CrossRef CAS.
- C. Zhang, L. Xie, Y. Ding, Q. Sun and W. Xu, ACS Nano, 2016, 10, 3776–3782 CrossRef CAS PubMed.
- N. Markova, V. Enchev and I. Timtcheva, J. Phys. Chem. A, 2005, 109, 1981–1988 CrossRef CAS PubMed.
- D. N. Silverman and R. Mckenna, Acc. Chem. Res., 2007, 40, 669–675 CrossRef CAS PubMed.
- G. A. Voth, Acc. Chem. Res., 2006, 39, 143–150 CrossRef CAS PubMed.
- I. Dance, Dalton Trans., 2015, 44, 18167–18186 RSC.
- R. S. Walters, E. D. Pillai and M. A. Duncan, J. Am. Chem. Soc., 2005, 127, 16599–16610 CrossRef CAS PubMed.
- N. R. Walker, R. S. Walters and M. A. Duncan, New J. Chem., 2005, 29, 1495–1503 RSC.
- J. M. Lisy, Int. Rev. Phys. Chem., 1997, 16, 267–289 Search PubMed.
- H. C. Ke, C. v. d. Linde and J. M. Lisy, J. Phys. Chem. A, 2015, 119, 2037–2051 CrossRef CAS PubMed.
- Y. Z. Li, G. J. Wang, C. X. Wang and M. F. Zhou, J. Phys. Chem. A, 2012, 116, 10793–10801 CrossRef CAS PubMed.
- T. Iino, K. Ohashi, Y. Mune, Y. Inokuchi, K. Judai, N. Nishi and H. Sekiya, Chem. Phys. Lett., 2006, 427, 24–28 CrossRef CAS.
- T. Iino, K. Ohashi, K. Inoue, K. Judai, N. Nishi and H. Sekiya, J. Chem. Phys., 2007, 126, 194302 CrossRef PubMed.
- J. T. O'Brien and E. R. Williams, J. Phys. Chem. A, 2011, 115, 14612–14619 CrossRef PubMed.
- M. F. Bush, R. J. Saykally and E. R. Williams, J. Am. Chem. Soc., 2008, 130, 9122–9128 CrossRef CAS PubMed.
- M. F. Bush, R. J. Saykally and E. R. Williams, ChemPhysChem, 2007, 8, 2245–2253 CrossRef CAS PubMed.
- T. Wende, N. Heine, T. I. Yacovitch, K. R. Asmis, D. M. Neumark and L. Jiang, Phys. Chem. Chem. Phys., 2016, 18, 267–277 RSC.
- L. Jiang, T. Wende, R. Bergmann, G. Meijer and K. R. Asmis, J. Am. Chem. Soc., 2010, 132, 7398–7404 CrossRef CAS PubMed.
- M. L. Weichman, S. Debnath, J. T. Kelly, S. Gewinner, W. Schöllkopf, D. M. Neumark and K. R. Asmis, Top. Catal., 2018, 61, 92–105 CrossRef CAS.
- H.-G. Xu, X.-N. Li, X.-Y. Kong, S.-G. He and W.-J. Zheng, Phys. Chem. Chem. Phys., 2013, 15, 17126–17133 RSC.
- S. M. Lang, T. M. Bernhardt, D. M. Kiawi, J. M. Bakker, R. N. Barnett and U. Landman, Angew. Chem., Int. Ed., 2015, 54, 15113–15117 CrossRef CAS PubMed.
- S. M. Lang, T. M. Bernhardt, D. M. Kiawi, J. M. Bakker, R. N. Barnettd and U. Landman, Phys. Chem. Chem. Phys., 2016, 18, 15727–15737 RSC.
- Y. Chen, J. Jin, K. Xin, W. Yu, X. Xing, X. Wang and G. Wang, Phys. Chem. Chem. Phys., 2019, 21, 15639–15646 RSC.
- G. J. Wang, C. X. Chi, X. P. Xing, C. F. Ding and M. F. Zhou, Sci. China: Chem., 2014, 53, 1166–1169 Search PubMed.
- G. J. Wang, C. X. Chi, J. M. Cui, X. P. Xing and M. F. Zhou, J. Phys. Chem. A, 2012, 116, 2484–2489 CrossRef CAS PubMed.
- M. J. Frisch, G. W. Trucks, H. B. Schlegel, G. E. Scuseria, M. A. Robb, G. Cheeseman, J. R. Scalmani, V. Barone, B. Mennucci, G. A. Petersson, H. Nakatsuji, M. Caricato, X. Li, H. P. Hratchian, A. F. Izmaylov, J. Bloino, G. Zheng, J. L. Sonnenberg, M. Hada, M. Ehara, K. Toyota, R. Fukuda, J. Hasegawa, M. Ishida, T. Nakajima, Y. Honda, O. Kitao, H. Nakai, T. Vreven, J. A. J. Montgomery, J. E. Peralta, F. Ogliaro, M. Bearpark, J. J. Heyd, E. Brothers, K. N. Kudin, V. N. Staroverov, R. Kobayashi, J. Nomand, K. Raghavachari, A. Rendell, J. C. Burant, S. S. Iyengar, J. Tomasi, M. Cossi, N. Rega, J. M. Millam, M. Klene, J. E. Knox, J. B. Cross, V. Bakken, C. Adamo, J. Jaramillo, R. Gomperts, R. E. Stratmann, O. Yazyev, A. J. Austin, R. Cammi, C. Pomelli, J. W. Ochterski, R. L. Martin, K. Morokuma, V. G. Zakrzewski, G. A. Voth, P. Salvador, J. J. Dannenberg, S. Dapprich, A. D. Daniels, O. Farkas, J. B. Foresman, J. V. Ortiz, J. Cioslowski and D. J. Fox, Gaussian 09, Revision A.02, Gaussian, Inc., Wallingford CT, 2009 Search PubMed.
- C. Lee, W. Yang and R. G. Parr, Phys. Rev. B: Condens. Matter Mater. Phys., 1988, 37, 785–789 CrossRef CAS PubMed.
- A. D. Becke, J. Chem. Phys., 1993, 98, 5648–5652 CrossRef CAS.
- V. Kasalova, W. D. Allen, H. F. Schaefer, E. D. Pillai and M. A. Duncan, J. Phys. Chem. A, 2007, 111, 7599–7610 CrossRef CAS PubMed.
- P. D. Carnegie, J. H. Marks, A. D. Brathwaite, T. B. Ward and M. A. Duncan, J. Phys. Chem. A, 2020, 124, 1093–1103 CrossRef CAS PubMed.
- T. B. Ward, E. Miliordos, P. D. Carnegie, S. S. Xantheas and M. A. Duncan, J. Chem. Phys., 2017, 146, 224305 CrossRef CAS PubMed.
- N. R. Walker, R. S. Walters, E. D. Pillai and M. A. Duncan, J. Chem. Phys., 2003, 119, 10471–10474 CrossRef CAS.
- Y. Nakao, K. Hirao and T. Taketsugu, J. Chem. Phys., 2001, 114, 7935–7940 CrossRef CAS.
- M. Calatayud, B. Silvi, J. Andres and A. Beltran, Chem. Phys. Lett., 2001, 333, 493–503 CrossRef CAS.
- Z. Luo, Y.-C. Chang, H. Huang and C. Y. Ng, J. Phys. Chem. A, 2015, 119, 11162–11169 CrossRef CAS PubMed.
- M. Engeser, D. Schrçder and H. Schwarz, Chem. – Eur. J., 2005, 11, 5975–5987 CrossRef CAS PubMed.
- S. Chiodo, O. Kondakova, M. C. Michelini, N. Russo and E. Sicilia, Inorg. Chem., 2003, 42, 8773–8782 CrossRef CAS PubMed.
- S. Di Tommaso, T. Marino, F. Rondinelli, N. Russo and M. Toscano, J. Chem. Theor. Comput., 2007, 3, 811–815 CrossRef CAS PubMed.
- P. D. Carnegie, A. B. McCoy and M. A. Duncan, J. Phys. Chem. A, 2009, 113, 4849–4854 CrossRef CAS PubMed.
- B. Bandyopadhyay, K. N. Reishus and M. A. Duncan, J. Phys. Chem. A, 2013, 117, 7794–7803 CrossRef CAS PubMed.
- N. R. Walker, R. S. Walters, M.-K. Tsai, K. D. Jordan and M. A. Duncan, J. Phys. Chem. A, 2005, 109, 7057–7067 CrossRef CAS PubMed.
- B. M. Marsh, J. Zhou and E. Garand, J. Phys. Chem. A, 2014, 118, 2063–2071 CrossRef CAS PubMed.
- E. M. Duffy, J. M. Voss and E. Garand, J. Phys. Chem. A, 2017, 121, 5468–5474 CrossRef CAS PubMed.
- B. M. Marsh, J. M. Voss, J. Zhou and E. Garand, Phys. Chem. Chem. Phys., 2015, 17, 23195–23206 RSC.
- B. M. Marsh, J. Zhou and E. Garand, Phys. Chem. Chem. Phys., 2015, 17, 25786–25792 RSC.
- J. M. Headrick, E. G. Diken, R. S. Walters, N. I. Hammer, R. A. Christie, J. Cui, E. M. Myshakin, M. A. Duncan, M. A. Johnson and K. D. Jordan, Science, 2005, 308, 1765–1769 CrossRef CAS PubMed.
- S. Álvarez-Barcia and J. R. Flores, J. Phys. Chem. C, 2011, 115, 24849–24857 CrossRef.
- S. Álvarez-Barcia and J. R. Flores, J. Phys. Chem. A, 2012, 116, 8040–8050 CrossRef PubMed.
- M. Zhou, J. Dong, L. Zhang and Q. Qin, J. Am. Chem. Soc., 2000, 123, 135–141 CrossRef PubMed.
Footnote |
| † Electronic supplementary information (ESI) available. See DOI: 10.1039/d0cp04448b |
| This journal is © the Owner Societies 2021 |