Ultrathin ZnTi-LDH nanosheets for photocatalytic aerobic oxidation of aniline based on coordination activation†
Cheng
Liu
,
Wei
Guo
,
Jinsong
Chen
,
Junhua
Zou
,
Zhiwen
Wang
and
Ling
Wu
 *
*
State Key Laboratory of Photocatalysis on Energy and Environment, Fuzhou University, Fuzhou 350116, P.R. China. E-mail: wuling@fzu.edu.cn
First published on 30th October 2020
Abstract
In this work, ZnTi-LDH nanosheets with several monolayer thickness were prepared as photocatalysts for the aerobic oxidation of aniline to yield nitrosobenzene under visible light irradiation. UV-vis DRS, in situ FTIR and XPS results jointly revealed that aniline molecules were efficiently chemisorbed and activated on ZnTi-LDH to form surface coordination active species, improving visible light absorption and inducing the photocatalytic reaction. The surface OH groups on ZnTi-LDH as the Brønsted base sites facilitated the reductive deprotonation of aniline to form the anilino anion, which was a key step in promoting aniline oxidation. ESR and XPS data suggested that oxygen vacancies (OVs) were formed due to the interaction between exposed OH groups and aniline molecules. The OVs, as the centers to capture photoelectrons, achieve the reduction of oxygen molecules to ˙O2− radicals, which further oxidize anilino species to produce nitrosobenzene. Finally, a possible mechanism was proposed to reveal the photocatalytic process based on the surface coordination activation theory.
1. Introduction
Nitrosobenzene is a highly valuable intermediate that undergoes a variety of organic synthesis reactions, including addition, isomerization, oxidation, reduction and ene reactions.1,2 In the past, nitrosobenzene was synthesized by the oxidation of aniline using peracids as oxidizing agents, which were corrosive and unstable.3–5 Recent developments of heterogeneous catalytic oxidation have attracted much attention, but these processes require expensive hydrogen peroxide (H2O2) as the oxidant.6,7 Considering the viewpoint of environmentally friendly chemistry, catalytic oxidation with oxygen (O2) as the oxidant was subsequently developed.8,9 However, the high temperature and high pressure needed in those reactions cause very low selectivity to nitrosobenzene. Consequently, it is well worth finding a novel and economical strategy to achieve the oxidation of aniline to nitrosobenzene under mild conditions using oxygen as the oxidant.Much work so far has focused on photocatalytic organic transformation, a green and sustainable process, in which an organic reaction could be initiated by light irradiation under mild conditions.10–12 Thus, photocatalysis is a promising candidate for the selective aerobic oxidation of aniline to nitrosobenzene. Recently, the photocatalytic aerobic oxidation of aniline under UV irradiation was demonstrated in three studies.13–15 However, nitrosobenzene was hardly detected in those processes as a result of the formation of azobenzene. Afterwards, selective photocatalytic oxidation of aniline to nitrosobenzene over Pt/TiO2 was reported.16 However, the Pt/TiO2 catalyst was prepared under harsh conditions and used an expensive noble metal (Pt). Therefore, it is desired to explore efficient catalysts for the selective photocatalytic oxidation of aniline to nitrosobenzene in an economical and convenient way.
Considerable research efforts have been devoted to ultrathin two-dimensional (2D) materials due to their high specific surface area, unique surface states, abundant active sites and other distinctive physicochemical properties.17–20 In our previous work, a series of ultrathin 2D nanosheets such as HNb3O8,21 Bi2MoO6,22,23 H1.4Ti1.65O4·H2O (ref. 24–27) and BiOCl (ref. 28) were developed for photocatalytic selective organic transformation. It was revealed in these studies that the ultrathin 2D material is an ideal model to explore the interaction between reactants and catalysts, which probably provides an in-depth understanding of the photocatalytic reaction mechanism at a molecular level.
Layered double hydroxides (LDHs) as an important class of 2D materials have been widely applied in photocatalysis, catalysis, biomedical science, electrochemistry and so on.29–32 LDHs have become promising photocatalysts owing to several outstanding advantages, including abundant surface hydroxyl (OH) groups, unique structure, uniform distribution of different metal cations, flexible tunability and high chemical stability. In the photocatalysis region, most of the literature about LDHs focus on water splitting,33–35 CO2 reduction36,37 and degradation of pollutant.38 However, little has been reported on the photocatalytic organic transformation by LDHs.39,40 Recently, our research group has reported the photocatalytic selective oxidation of benzyl alcohol over Au–Pd/MgAl-LDH and ZnTi-LDH under visible light irradiation.41,42 Both studies highlight the interaction between the basic sites on the surface of LDHs and reactant molecules. It was demonstrated by Hirai et al. that Pt/TiO2 exhibited excellent photocatalytic performance in aniline oxidation to nitrosobenzene because the Pt particles with high electron density behaved as Lewis base sites to achieve reductive deprotonation of aniline, which was the rate-determining step in the oxidation of aniline.16 Following this thought, the function of the basic sites was further emphasized in our two reported studies.43,44 Therefore, the question is whether the surface OH groups of LDHs as the Brønsted base sites could facilitate the reductive deprotonation of aniline to increase the catalytic activity.
Herein, we fabricated ZnTi-LDH nanosheets 7–8 monolayers thick for the selective photocatalytic aerobic oxidation of aniline to nitrosobenzene under visible light irradiation. Three kinds of ZnTi-LDHs with different ZnII/TiIV molar ratios were prepared by varying the dosage of TiCl4. A unique ultrathin structure for ZnTi-LDH was exhibited through FESEM, TEM and AFM. The differences of the three kinds of ZnTi-LDHs in terms of specific surface area, light absorption, and the amount of surface OH groups were revealed by BET, UV-vis DRS and FTIR, respectively. The interaction between OH groups on the surface of ZnTi-LDH and aniline molecules was investigated by UV-vis DRS, in situ FTIR and XPS. The presence of oxygen vacancies produced by the interaction between ZnTi-LDH and aniline molecules was verified by ESR and XPS. The generation of superoxide radical (˙O2−) as the active oxidative species was further characterized by ESR combined with DMPO. Finally, a possible mechanism was proposed at the molecule level to illustrate the photocatalytic progress of the oxidation of aniline to nitrosobenzene based on the surface coordination activation theory.
2. Experimental
2.1 Reagents and chemicals
Zinc nitrate hexahydrate (Zn(NO3)2·6H2O, 99%), urea (CH4N2O, 99%), titanium tetrachloride (TiCl4, 98%), acetonitrile (CH3CN, 99%), aniline (C6H7N, 99%) and nitrobenzene (C6H5NO2, 99%) were purchased from Sinopharm Chemical Reagent Co., Ltd. (Shanghai, China). Nitrosobenzene (C6H5NO, 97%) and azobenzene (C12H10N2, 97%) were purchased from Sigma-Aldrich Co., Ltd. and Alfa Aesar China Co., Ltd., respectively. All these chemicals were used as received without further purification.2.2 Catalyst preparation
ZnTi-LDH was prepared using an improved co-precipitation preparation method by Duan et al.45 Firstly, 2.38 g of Zn(NO3)2·6H2O and 3 g of urea were dissolved in 70 mL of deionized water under stirring for 5 min to ensure complete dissolution. Then, 0.44 mL of TiCl4 was quickly added into the mixed solution under continuous stirring for 1 h. The resulting solution was subsequently transferred to a Teflon-lined stainless steel autoclave and then heated at 130 °C for 48 h. The white precipitate was collected by centrifugation, washed several times with deionized water to remove residual ions and then dried in an oven at 60 °C for 24 h. This product was denoted as ZT-2/1, meaning ZnTi-LDH with a ZnII/TiIV molar ratio of 2![[thin space (1/6-em)]](https://www.rsc.org/images/entities/char_2009.gif) :
:![[thin space (1/6-em)]](https://www.rsc.org/images/entities/char_2009.gif) 1. Similarly, ZT-4/1 and ZT-6/1 were also prepared using the same procedure by varying the amount of TiCl4.
1. Similarly, ZT-4/1 and ZT-6/1 were also prepared using the same procedure by varying the amount of TiCl4.
2.3 Material characterization
X-ray diffraction (XRD) patterns were collected on a Bruker D8 Advance X-ray diffractometer with Cu Kα radiation (λ = 0.15406 nm). A Hitachi SU8010 field-emission scanning electron microscope (FESEM) was used to obtain the morphologies of the prepared samples. Transmission electron microscopy (TEM) and higher-resolution transmission electron microscopy (HRTEM) images were characterized using a FEI Talos field emission transmission electron microscope at an accelerating voltage of 200 kV. A tapping-mode atomic force microscope (AFM, Bruker Dimension Icon) was used to determine the thickness of the samples. The Brunauer–Emmett–Teller (BET) surface area determination and Barret–Joyner–Halender (BJH) pore volume and size analysis were carried out using nitrogen adsorption/desorption isotherms at 77 K on an Autosorb-1C-TCD physical adsorption instrument (American Quantachrome) using a Micrometrics ASAP 2020 system. Ultraviolet-visible diffuse reflectance spectra (UV-vis DRS) were obtained on an Agilent Cary 500 UV-vis spectrophotometer using barium sulfate as background. Fourier transform infrared (FTIR) spectra were determined using a Nicolet IS50 Fourier transform infrared spectrometer at a resolution of 4 cm−1. The prepared LDHs were pressed into KBr discs with a weight ratio of sample to KBr of 1![[thin space (1/6-em)]](https://www.rsc.org/images/entities/char_2009.gif) :
:![[thin space (1/6-em)]](https://www.rsc.org/images/entities/char_2009.gif) 50. X-ray photoelectron spectroscopy (XPS) analysis was measured on a PHI Quantum 2000 XPS system with Al Kα irradiation as the excitation source. Electron spin resonance (ESR) spectra were collected on a Bruker A300 spectrometer. The light intensity was measured using a PL-MW2000 optical power meter (Beijing PerfectLight Technology Ltd, China).
50. X-ray photoelectron spectroscopy (XPS) analysis was measured on a PHI Quantum 2000 XPS system with Al Kα irradiation as the excitation source. Electron spin resonance (ESR) spectra were collected on a Bruker A300 spectrometer. The light intensity was measured using a PL-MW2000 optical power meter (Beijing PerfectLight Technology Ltd, China).
2.4 Electrochemistry measurement
The working electrode was prepared on fluorine-doped tin oxide (FTO) glass. First, the FTO surface was covered by Scotch tape, leaving a circular region exposed. Then, the exposed circular region on the FTO was coated with 15 μL of slurry, which was obtained by sonicating a mixture of 5 mg of the sample and 0.5 mL of DMF for 1 h. After being dried at 60 °C for 2 h, the attached Scotch tape was torn off to leave a circular region containing the sample. The circular region was isolated with epoxy resin and the exposed area of the electrode was 0.25 cm2. Electrochemical measurements were performed in a conventional three electrode cell in a 0.2 M Na2SO4 aqueous solution (pH 6.8) using a Pt plate as the counter electrode and a saturated Ag/AgCl electrode as the reference electrode. Mott–Schottky plots were obtained at three different frequencies (500 kHz, 1000 kHz and 1500 kHz) on a Bio-Logic SAS (SP-300) workstation. Photocurrent measurements were conducted on a CHI660D workstation using a 300 W Xe lamp with a 400 nm cutoff filter.2.5 Simulated in situ FTIR measurement
In situ FTIR spectra of aniline (AL) adsorbed on the samples were obtained on a Nicolet IS50 Fourier transform infrared (FTIR) spectrometer at a resolution of 4 cm−1. Each spectrum was obtained from a total of 64 scans. First, 20 mg of powder sample was pressed into a self-supporting IR disk with a size of 18 mm diameter, and then the disk was placed into the sample holder which could be moved vertically along a quartz tube of the cell. The sample disk was treated under dynamic vacuum (6 × 10⁻² hPa) at 150 °C for 4 h to remove surface absorbed gas before initiating the first FTIR measurement (degassing stage). After the sample was cooled to room temperature, 10 μL of AL was spiked into the cell using a syringe via the septum. Half an hour later, the second FTIR measurement of the sample was collected (physical and chemical adsorption stage). The physically absorbed AL was removed by further evacuation at 150 °C for 3 min under 6 × 10⁻² hPa, and then the third FTIR measurement of the sample was taken (chemical adsorption stage).2.6 Photocatalytic activity test
The photocatalytic oxidation of aniline (AL) to nitrosobenzene (NSB) with oxygen was carried out as follows. First, a total of 20 mg of catalyst, 0.026 mmol of AL, and 1.0 mL of acetonitrile were added in a 10 mL Pyrex glass reaction tube connected to an oxygen-filled balloon. Then the tube was stirred for 30 min to ensure that the catalyst blended evenly in the solvent. Subsequently the suspension was irradiated by a 300 W Xe lamp (Beijing Perfectlight Co. Ltd., PLS-SXE300D) with a 400 nm cutoff filter. The distance between the Xe lamp and the reaction tube is 6.5 cm, and the corresponding irradiation intensity is 522 mW cm−2. A thermostat bath was used to control the reaction temperature at 25 °C. After irradiation for 4 h, the catalyst was completely removed by centrifuging the mixture to obtain the remaining solution, which was finally analyzed using an Agilent gas chromatograph (GC-6898N). The conversion of AL and the selectivity to NSB were defined as the follows:| Conversion (%) = [(C0 − CAL)/C0] × 100 |
| Selectivity (%) = [CNSB/(C0 − CAL)] × 100 |
The details of the GC analysis are as follows: the remaining solution was determined using an Agilent GC-6898N instrument with a FID detector. An Agilent HP-5 column (15 m × 0.530 mm) was used as a separation column. The carrier gas was helium (99.999%) at the rate of 5.6 mL min−1. The temperatures of the injector and detector were respectively set as 300 °C and 270 °C. The injection volume was 10 μl. The column temperature was programmed from 40 °C to 160 °C at 20 °C min−1 and then held for 10.5 min at 160 °C.
3. Results and discussion
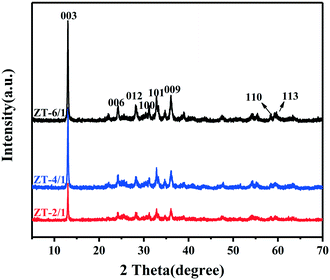
Fig. 1 illustrates the powder XRD patterns for the three kinds of ZnTi-LDHs with different ZnII/TiIV molar ratios, including ZT-2/1, ZT-4/1 and ZT-6/1. The patterns display reflections of (0 0 3), (0 0 6), (0 0 9), (1 0 0), (1 0 1), (0 1 2), (1 1 0) and (1 1 3), which belong to typical LDH materials.46 It can also be clearly noted that the diffraction peaks especially for (0 0 3) are sharp and intense, indicating the highly crystalline nature of the prepared samples. In addition, the basal interlayer reflection (2θ ≈ 13.4°, d003 = 0.66 nm) of ZnTi-LDH shows a small shift to a higher scattering angle compared with that of MgAl-LDH (2θ ≈ 11.7°, d003 = 0.75 nm) reported in a previous work,41 indicating the decrease of the basal interlayer distance. This result suggests that the electrostatic interaction between the inorganic layer and the guest carbonate in hydrotalcite materials is strengthened because the trivalent metal (Al3+) in MgAl-LDH is replaced by a tetravalent metal (Ti4+) for ZnTi-LDH.45Field-emission scanning electron microscopy (FESEM) and transmission electron microscopy (TEM) were used to obtain the morphology and structure of the LDH samples. The FESEM image, shown in Fig. 2A, reveals that the prepared ZnTi-LDHs consist of two-dimensional thin nanoflakes. The rough surface of the hierarchical structure contributes to the contact between catalysts and reactants, which plays an important role in improvement of the catalytic performance. It is further confirmed by the TEM image in Fig. 2B that the hierarchical structure of the sample consists of ultrathin nanosheets with a lateral dimension of 500–700 nm. As can be seen from the HRTEM image in Fig. 2C, the interplanar spacing of the sample is 0.25 nm, which is consistent with the calculated result (d009 = 0.25 nm) based on the XRD results. In addition, the thickness of the ZnTi-LDH nanosheets measured by atomic force microscopy (AFM) in Fig. 2D–F is approximately 4.7–5.2 nm, which can be considered as a 7–8 monolayer thickness according to the interlayer spacing of 0.66 nm from XRD data.
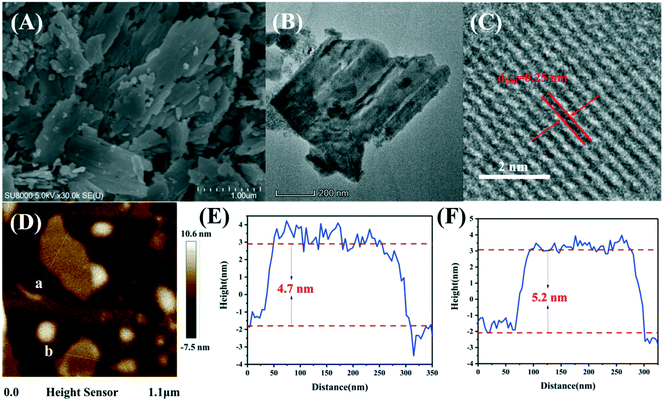 | ||
| Fig. 2 FESEM image (A), TEM image (B), HRTEM image (C), AFM image (D) and the corresponding height profiles (E and F) for ZT-2/1. | ||
The specific surface area and porosity of the ZnTi-LDHs were investigated by low temperature nitrogen adsorption–desorption. The N2-sorption data in Fig. S1A† show a type IV isotherm with an H3-type hysteresis loop for the ZnTi-LDHs, which demonstrates that the prepared ZnTi-LDHs are mesoporous materials. The corresponding wide distribution of pore size in Fig. S1B† further confirms that the pore width of the samples is distributed in 6–7 nm, most likely resulting from the use of urea as the template during the hydrothermal synthesis. Meanwhile, the specific surface areas of ZT-2/1, ZT-4/1, and ZT-6/1 were measured to be 129.07 m2 g−1, 86.79 m2 g−1 and 48.08 m2 g−1, respectively. Furthermore, the optical property of the prepared catalysts was analyzed by ultraviolet-visible diffuse reflectance spectra (UV-vis DRS) spectroscopy. UV-vis DRS and the corresponding Tauc plot in Fig. S2† reveal that the bandgaps of ZT-2/1, ZT-4/1, and ZT-6/1 are about 3.25 eV, 3.34 eV, 3.37 eV, respectively. As a result, the three ZnTi-LDHs can only respond to ultraviolet light (λ ≤ 382 nm). In addition, Mott–Schottky plots (Fig. S3†) were used to measure the flat-band potentials of ZT-2/1, ZT-4/1 and ZT/6/1, which are respectively −1.1 V, −1.0 V and −0.8 V (vs. Ag/AgCl), corresponding to −0.9 V, −0.8 V and −0.6 V (vs. NHE). It is generally known that the position of the conduction band (CB) is close to that of the flat band, and compared with the O2/˙O2− potential (−0.28 V vs. NHE), the CBs of the ZnTi-LDH samples are more negative. Therefore, all of them are thermodynamically permissible for the reduction of O2 to ˙O2−, which is an important active oxygen species.
The selective photocatalytic oxidation of aniline (AL) to nitrosobenzene (NSB) was carried out over ZnTi-LDHs and P25 under visible light (λ ≥400 nm) irradiation. As shown in Table 1, the conversion of AL (33.5%) with high selectivity to NSB (76.7%) was achieved over ZT-2/1 after irradiating for 4 h, which exhibited an obviously superior catalytic performance than ZT-4/1 (15.4%), ZT-6/1 (8.1%) and P25 (13.6%). In addition, two by-products were produced in the photocatalytic reaction, azobenzene (AB) and nitrobenzene (NB). The formation of AB, another high-value chemical, results from the condensation between AL and a part of the produced NSB.11 NB is produced owing to the further oxidation of NSB. Table S1† summarizes the photocatalytic data of aniline oxidation between the current study and those reported in the literature. Compared to various photocatalysts, ZT-2/1 shows excellent photocatalytic performance in the conversion of AL and selectivity to NSB. It is worth mentioning that no product was detected under the reaction condition without ZnTi-LDH as a catalyst or in the dark condition. In addition, the photocatalytic oxidation reaction did not take place in an Ar atmosphere. On the basis of these results, it is concluded that ZnTi-LDH, light source and oxygen are all necessary for the photocatalytic oxidation of AL. Moreover, the reusability and stability of ZT-2/1 were also investigated. After recycling ZT-2/1 five times, its photocatalytic activity remains stable (Fig. S4†). The XRD patterns for fresh and used ZT-2/1 (Fig. S5†) show no obvious change, indicating the high stability of ZT-2/1. In order to explore the effect of solvents on the catalytic activity, reaction experiments using different solvents were carried out. As shown in Fig. S6,† the activity order is acetonitrile > BTF > toluene > hexane > ethyl acetate > EtOH, indicating that acetonitrile is the best option as the reaction solvent in this photocatalytic process. In the organic solvents without oxygen-containing functional groups, the photocatalytic conversion of aniline is improved with the increasing polarity of the solvents (acetonitrile > BTF > toluene > hexane). This is mainly because aniline can dissolve well in organic solvents with high polarity. In organic solvents with oxygen-containing functional groups (ethyl acetate and EtOH), the conversion considerably decreases but the selectivity of NSB obviously increases. This result may have contributed to the competitive adsorption of the solvent and aniline in this system.
| Entry | Catalyst | Atm | Visible light (λ ≥400 nm) | Conv. (%) | Sel. NSB (%) | Sel. AB (%) | Sel. NB (%) |
|---|---|---|---|---|---|---|---|
| a Reaction conditions: aniline (0.026 mmol), catalyst (20 mg), acetonitrile (1.0 mL), temperature (25 °C), irradiation time (4 h). | |||||||
| 1 | ZT-2/1 | O2 | + | 33.5 | 76.7 | 16.1 | 7.2 |
| 2 | ZT-2/1 | O2 | — | — | — | — | — |
| 3 | None | O2 | + | — | — | — | — |
| 4 | ZT-2/1 | Ar | + | — | — | — | — |
| 5 | ZT-4/1 | O2 | + | 15.4 | 79.9 | 13.6 | 6.5 |
| 6 | ZT-6/1 | O2 | + | 8.1 | 86.4 | 6.2 | 7.4 |
| 7 | P25 | O2 | + | 13.6 | 62.9 | 33.3 | 3.8 |
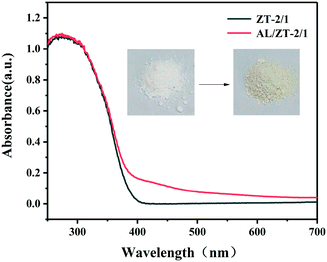
Why do ZnTi-LDHs as ultraviolet light responsive materials have catalytic performance under visible light irradiation? The optical absorption property of aniline-adsorbed ZT-2/1 (AL/ZT-2/1) was analyzed by UV-vis DRS and the results are shown in Fig. 3. After the absorption of AL molecules, ZT-2/1 exhibits visible light absorption with a color change from white to yellow, similar to a phenomenon reported in our previous work.21,25,42 This result indicates that the interaction of AL with ZT-2/1 would induce the formation of surface coordination species, which exhibited optical absorption in the visible region due to the ligand-to-metal charge transfer (LMCT).47–49 In addition, photocurrent measurements (Fig. S7†) suggest that three types of aniline-adsorbed ZnTi-LDHs have photocurrent response under visible light irradiation. AL/ZT-2/1 shows enhanced photocurrent intensity than AL/ZT-4/1 and AL/ZT-6/1, indicating that AL/ZT-2/1 has higher separation efficiency of photoelectrons. Therefore, the surface coordination active species with the property of absorption in the visible region guarantees the photocatalytic oxidation of AL under visible light irradiation.
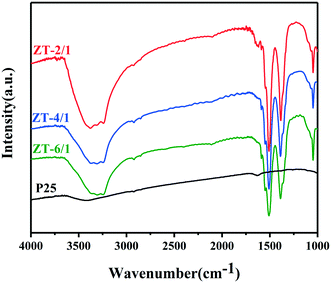
To find out the reason why ZT-2/1 has better photocatalytic performance than other kinds of ZnTi-LDHs, further material characterization was carried out. As shown in the FTIR spectra in Fig. 4, the intensity of the FTIR peak (3100–3500 cm−1) assigned to OH groups for ZT-2/1 significantly increases when compared with those for ZT-4/1, ZT-6/1 and P25, verifying that ZT-2/1 possesses a larger number of surface OH groups than the others. This is in good consistency with the results of specific surface area analyzed by N2-sorption. Consequently, it can be automatically concluded that more surface OH groups are efficiently exposed in ZT-2/1 owing to its higher specific surface area. It was demonstrated in three studies16,43,44 that basic sites could facilitate the reductive deprotonation of AL, which was the rate-determining step in the oxidation of AL. Taking into account the abundant OH groups on the surface of LDHs, we suppose that the OH groups on ZnTi-LDHs as the Brønsted base sites could also facilitate the reductive deprotonation of AL, resulting in the excellent photocatalytic performance in the oxidation of AL.
In situ FTIR analysis was further carried out to verify the interaction between ZnTi-LDH and AL molecules. As shown in Fig. 5c, after the adsorption of AL, several peaks assigned to AL molecules appeared in the spectrum compared with that of fresh ZT-2/1. The peaks also remained even after further evacuation (Fig. 5d), indicating that AL molecules efficiently chemisorbed on the surface of ZnTi-LDH. The peak at 1601 cm−1 could be ascribed to the stretching vibration of C![[double bond, length as m-dash]](https://www.rsc.org/images/entities/char_e001.gif) C (σC
C (σC![[double bond, length as m-dash]](https://www.rsc.org/images/entities/char_e001.gif) C) in the aromatic ring, while the two peaks at 1174 cm−1 and 1152 cm−1 could be assigned to the stretching vibration of C–H (σC–H) in the aromatic ring.50 Differently, the N–H bending vibration (δN–H) at 1621 cm−1 in the AL adsorbed on ZT-2/1 exhibited a shift toward a higher wavenumber compared with that in free AL molecules (1618 cm−1), indicating that AL molecules adsorbed on ZT-2/1 were transformed to the new species with a stronger N–H bond.51 It was proven in a previous study16 that the N–H vibrational band was strengthened via deprotonation by the base. In addition, the C–N stretching vibration (σC–N) at 1277 cm−1 in the AL/ZT-2/1 showed a similar move. These data clearly suggest that ZT-2/1 has some kind of basic sites to promote deprotonation of AL.
C) in the aromatic ring, while the two peaks at 1174 cm−1 and 1152 cm−1 could be assigned to the stretching vibration of C–H (σC–H) in the aromatic ring.50 Differently, the N–H bending vibration (δN–H) at 1621 cm−1 in the AL adsorbed on ZT-2/1 exhibited a shift toward a higher wavenumber compared with that in free AL molecules (1618 cm−1), indicating that AL molecules adsorbed on ZT-2/1 were transformed to the new species with a stronger N–H bond.51 It was proven in a previous study16 that the N–H vibrational band was strengthened via deprotonation by the base. In addition, the C–N stretching vibration (σC–N) at 1277 cm−1 in the AL/ZT-2/1 showed a similar move. These data clearly suggest that ZT-2/1 has some kind of basic sites to promote deprotonation of AL.
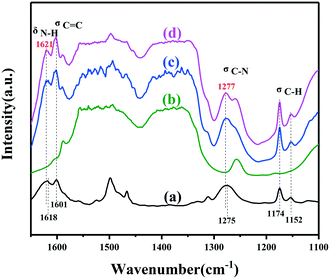 | ||
| Fig. 5 In situ FTIR spectra of aniline absorption on ZT-2/1. (a) FTIR spectra of free aniline. (b) Degassing stage. (c) Physical and chemical adsorption stage. (d) Chemical adsorption stage. | ||
To further explore the active sites for the interaction between ZnTi-LDH and AL molecules, X-ray photoelectron spectroscopy (XPS) characterization was used to compare the surface properties of naked ZT-2/1 with those of AL-adsorbed ZT-2/1. As shown in Fig. 6A, the Zn 2p XPS spectrum of AL/ZT-2/1 was identical to that of fresh ZT-2/1, providing the evidence of no interaction between Zn atoms and AL molecules. Nevertheless, the Ti 2p XPS spectrum of AL/ZT-2/1 in Fig. 6B exhibits a higher binding energy shift (0.1 eV) relative to that of the naked ZT-2/1, inferring the decrease in electron density in the Ti nucleus. This result reveals the transport of electrons from Ti atoms to AL molecules after the adsorption of AL. The O 1s XPS spectra for ZT-2/1 and AL/ZT-2/1 in Fig. 6C show three similar peaks at 529.6 eV, 532.1 eV and 532.9 eV, which are attributed to lattice oxygen, adsorbed water and C–O functional group, respectively.52,53 However, AL/ZT-2/1 shows a higher binding energy shift (0.3 eV) for OH groups compared to the naked ZT-2/1 (531.3 eV), suggesting the migration of electrons from surface OH groups to AL molecules due to the adsorption of AL. Moreover, the O 1s spectrum of AL/ZT-2/1 exhibits an extra peak at 530.2 eV, which is ascribed to the adsorbed oxygen species at the vacancy sites.54,55 From the results we have already obtained, it can be concluded that the interaction between ZnTi-LDH and AL molecules was triggered via Ti sites and OH sites as the active sites. As a result of the interaction, surface coordination active species as well as oxygen vacancies (OVs) were formed at the same time. In addition, combined with the results of in situ FTIR analysis and abundant OH sites on LDH materials, it was further inferred that the basic site to promote deprotonation of AL was OH sites on the surface of ZT-2/1.
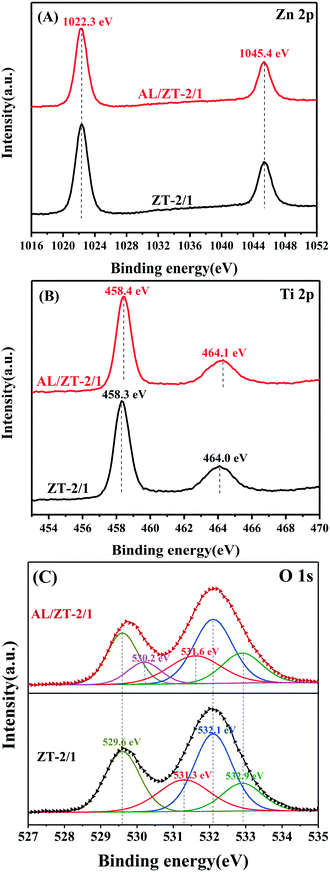 | ||
| Fig. 6 The Zn 2p (A), Ti 2p (B) and O 1s (C) XPS spectra of ZT-2/1 before and after the adsorption of aniline. | ||
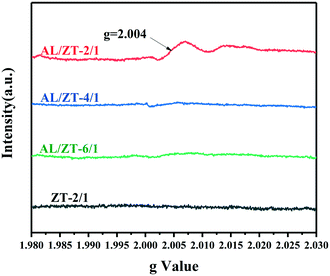
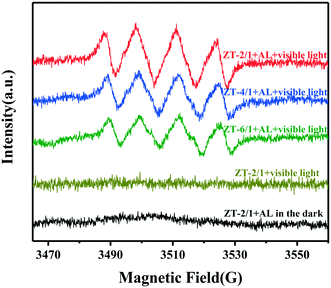
Subsequently, the existence of OVs in AL-adsorbed ZnTi-LDH was further confirmed by the analysis of electron spin resonance (ESR) spectra. As shown in Fig. 7, no apparent ESR signal can be examined for the fresh ZT-2/1. On the contrary, AL/ZT-2/1 exhibited the typical ESR signal centered at g = 2.004, which was ascribed to the electrons trapped in the OVs.56 It was evidenced again that OVs were produced when AL molecules were adsorbed on ZT-2/1. As for AL/ZT-4/1 and AL/ZT-6/1, they obviously exhibited the weaker ESR signals, indicating the formation of a smaller number of OVs compared to AL/ZT-2/1. Therefore, the more surface OH groups exposed on ZnTi-LDH, the more OVs it could produce via the adsorption of AL molecules.
The roles of O2 molecules in the photocatalysis reaction was evidenced by a simulated in situ ESR measurement coupled with 5,5-dimethyl-1-pyrroline N-oxide (DMPO) as a spin trapping reagent. As shown in Fig. 8, no obvious ESR signal was detected in the absence of AL molecules or in the dark condition. In contrast, ZT-2/1 with the addition of AL under visible light irradiation exhibited the typical signal assigned to the DMPO–˙OOH adduct, a spin derivative of DMPO–˙O2−, confirming the presence of ˙O2−.55,57 The results reveal that the generation of ˙O2− under visible light irradiation results from the surface coordination active species formed between ZnTi-LDH and AL molecules, which could absorb visible light and initiate the photocatalysis reaction. Moreover, the ESR signal intensity for ZT-2/1 is obviously stronger than those for ZT-4/1 and ZT-6/1, indicating that ZT-2/1 possessed a superior performance to produce ˙O2− than the others after the adsorption of AL molecules. It was demonstrated in a number of studies that OVs not only serve as the centers to capture photoelectrons from the photoexcited surface coordination species but also provide active sites for adsorption and activation of O2.58,59 Therefore, more OVs produced by the interaction between the ZnTi-LDH and AL molecules are definitely helpful to increase the performance to form ˙O2−, promoting photocatalytic oxidation organic reactions.
On the basis of the findings described above, a possible photocatalytic mechanism for the aerobic oxidation of aniline under visible light irradiation is explained in Scheme 1. Firstly, AL molecules are efficiently chemisorbed and activated on the surface of ZnTi-LDH via the Ti sites or OH sites as the active sites, resulting in not only formation of the surface coordination active species and OVs but also facilitation of the reductive deprotonation of AL to produce anilino species (I). Under visible light irradiation, the surface coordination species are excited to produce photogenerated electrons, which would be captured by OVs to reduce the adsorbed and activated oxygen molecules to ˙O2− radicals (II). Finally, ˙O2− radicals further oxidize anilino species to form nitrosobenzene (III).
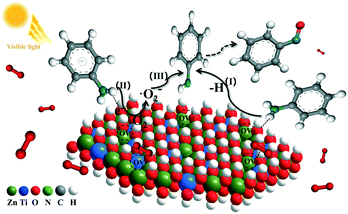 | ||
| Scheme 1 Possible mechanism for selective oxidation of aniline to nitrosobenzene over ZnTi-LDH under visible light. | ||
4. Conclusions
We have prepared ZnTi-LDH nanosheets with several monolayer thickness for the selective photocatalytic aerobic oxidation of aniline to nitrosobenzene under visible light irradiation. Aniline molecules were adsorbed and activated on the surface of ZnTi-LDH to form surface coordination species via Ti sites or OH sites as the active sites, which could extend light absorption into the visible range and induce a photocatalytic reaction under visible light irradiation. There are two reasons to explain why the ZnTi-LDH with more exposed OH groups exhibits a more excellent photocatalytic performance than the others. On the one hand, more surface OH groups as the Brønsted base sites are more beneficial to facilitate the reductive deprotonation of aniline, which is the rate-determining step in the oxidation of AL. On the other hand, more OVs are formed due to the interaction between more exposed OH groups and AL molecules. As a result, more photogenerated electrons would be captured by OVs to reduce the adsorbed and activated oxygen molecules to ˙O2− radicals, which more effectively oxidize anilino species to form nitrosobenzene. This work is helpful to understand the photocatalytic synthesis of nitrosobenzene at the molecular level on the basis of the interactions between catalysts and reactant molecules.Conflicts of interest
There are no conflicts to declare.Acknowledgements
This work was supported by the National Natural Science Foundation of China (21872032 and 51672048).References
- P. Zuman and B. Shah, Chem. Rev., 1994, 94, 1621–1641 CrossRef CAS.
- W. Adam and O. Krebs, Chem. Rev., 2003, 103, 4131–4146 CrossRef CAS.
- S. Meenakshisundaram, M. Selvaraju, N. M. M. Gowda and K. S. Rangappa, Int. J. Chem. Kinet., 2005, 37, 649–657 CrossRef CAS.
- B. G. Gowenlock and G. B. Richer-Addo, Chem. Rev., 2004, 104, 3315–3340 CrossRef CAS.
- A. Defoin, Synthesis, 2004, 5, 706–710 CrossRef.
- S. Fountoulaki, P. L. Gkizis, T. S. Symeonidis, E. Kaminioti, A. Karina, I. Tamiolakis, G. S. Armatas and I. N. Lykakisa, Adv. Synth. Catal., 2016, 358, 1500–1508 CrossRef CAS.
- S. Ghosh, S. S. Acharyya, T. Sasaki and R. Bal, Green Chem., 2015, 17, 1867–1876 RSC.
- N. S. Kus, Monatsh. Chem., 2010, 141, 1089–1091 CrossRef CAS.
- A. Grirrane, A. Corma and H. García, Science, 2008, 322, 1661–1664 CrossRef CAS.
- X. Lang, X. Chen and J. Zhao, Chem. Soc. Rev., 2014, 43, 473–486 RSC.
- Z. Chai, T. T. Zeng, Q. Li, L. Q. Lu, W. J. Xiao and D. Xu, J. Am. Chem. Soc., 2016, 138, 10128–10131 CrossRef CAS.
- F. Su, S. C. Mathew, L. Mohlmann, M. Antonietti, X. Wang and S. Blechert, Angew. Chem., Int. Ed., 2011, 50, 657–660 CrossRef CAS.
- C. Karunakaran, S. Senthilvelan and S. Karuthapandian, J. Photochem. Photobiol., A, 2005, 172, 207–213 CrossRef CAS.
- C. Karunakaran, S. Senthilvelan and S. Karuthapandian, Sol. Energy Mater. Sol. Cells, 2005, 89, 391–402 CrossRef CAS.
- C. Karunakaran and S. Senthilvelan, J. Mol. Catal. A: Chem., 2005, 233, 1–8 CrossRef CAS.
- Y. Shiraishi, H. Sakamoto, K. Fujiwara, S. Ichikawa and T. Hirai, ACS Catal., 2014, 4, 2418–2425 CrossRef CAS.
- Y. Sun, S. Gao, F. Lei and Y. Xie, Chem. Soc. Rev., 2015, 44, 623 RSC.
- Y. Zheng, Y. Jiao, L. Ge, M. Jaroniec and S. Z. Qiao, Angew. Chem., Int. Ed., 2013, 52, 3110–3116 CrossRef CAS.
- Z. Yin, J. Zhu, Q. He, X. Cao, C. Tan, H. Chen, Q. Yan and H. Zhang, Adv. Energy Mater., 2014, 4, 1300574 CrossRef.
- Y. Chen, C. Tan, H. Zhang and L. Wang, Chem. Soc. Rev., 2015, 44, 2681–2701 RSC.
- S. Liang, L. Wen, S. Lin, J. Bi, P. Feng, X. Fu and L. Wu, Angew. Chem., Int. Ed., 2014, 53, 2951–2955 CrossRef CAS.
- K. Jing, J. Xiong, N. Qin, Y. Song, L. Li, Y. Yu, S. Liang and L. Wu, Chem. Commun., 2017, 53, 8604–8607 RSC.
- K. Jing, W. Ma, Y. Ren, J. Xiong, B. Guo, Y. Song, S. Liang and L. Wu, Appl. Catal., B, 2019, 243, 10–18 CrossRef CAS.
- H. Wang, Y. Song, J. Xiong, J. Bi, L. Li, Y. Yu, S. Liang and L. Wu, Appl. Catal., B, 2018, 224, 394–403 CrossRef CAS.
- Y. Song, H. Wang, X. Gao, Y. Feng, S. Liang, J. Bi, S. Lin, X. Fu and L. Wu, ACS Catal., 2017, 7, 8664–8674 CrossRef CAS.
- Y. Song, H. Wang, S. Liang, Y. Yu, L. Li and L. Wu, J. Catal., 2018, 361, 105–115 CrossRef CAS.
- Y. Song, H. Wang, Z. Wang, B. Guo, K. Jing, Y. Li and L. Wu, ACS Catal., 2018, 8, 9656–9664 CrossRef CAS.
- Y. Ren, J. Zou, K. Jing, Y. Liu, B. Guo, Y. Song, Y. Yu and L. Wu, J. Catal., 2019, 380, 123–131 CrossRef CAS.
- F. Cavani, F. Trifirb and A. Vaccari, Catal. Today, 1991, 11, 173–301 CrossRef CAS.
- Q. Wang and D. O'Hare, Chem. Rev., 2012, 112, 4124–4155 CrossRef CAS.
- L. Mohapatra and K. M. Parida, J. Mater. Chem. A, 2016, 4, 10744–10766 RSC.
- K. M. Parida, M. Sahoo and S. Singha, J. Catal., 2010, 276, 161–169 CrossRef CAS.
- Y. Zhao, B. Li, Q. Wang, W. Gao, C. J. Wang, M. Wei, D. G. Evans, X. Duan and D. O'Hare, Chem. Sci., 2014, 5, 951–958 RSC.
- C. G. Silva, Y. Bouizi, V. Fornés and H. García, J. Am. Chem. Soc., 2009, 131, 13833–13839 CrossRef.
- N. Baliarsingh, L. Mohapatra and K. M. Parida, J. Mater. Chem. A, 2013, 1, 4236 RSC.
- Y. Zhao, G. Chen, T. Bian, C. Zhou, G. I. Waterhouse, L. Z. Wu, C. H. Tung, L. J. Smith, D. O'Hare and T. Zhang, Adv. Mater., 2015, 27, 7824–7831 CrossRef CAS.
- K. Teramura, S. Iguchi, Y. Mizuno, T. Shishido and T. Tanaka, Angew. Chem., Int. Ed., 2012, 51, 8008–8011 CrossRef CAS.
- Y. Guo, D. Li, C. Hu, Y. Wan, E. Wang, Y. Zhou and S. Feng, Appl. Catal., B, 2001, 30, 337–349 CrossRef CAS.
- X. Yang, B. Chen, X. Li, L. Zheng, L. Wu and C. Tung, Chem. Commun., 2014, 50, 6664 RSC.
- M. Sahoo, S. Mansingh and K. M. Parida, J. Mater. Chem. A, 2019, 7, 7614–7627 RSC.
- Z. Wang, Y. Song, J. Zou, L. Li, Y. Yu and L. Wu, Catal. Sci. Technol., 2018, 8, 268–275 RSC.
- J. Zou, Z. Wang, W. Guo, B. Guo, Y. Yu and L. Wu, Appl. Catal., B, 2020, 260, 118185 CrossRef CAS.
- J. Chen, J. Xiong, Y. Song, Y. Yu and L. Wu, Appl. Surf. Sci., 2018, 440, 1269–1276 CrossRef CAS.
- J. Chen, C. Shen, B. Guo, Y. Yu and L. Wu, Catal. Today, 2019, 335, 312–318 CrossRef CAS.
- M. Shao, J. Han, M. Wei, D. G. Evans and X. Duan, Chem. Eng. J., 2011, 168, 519–524 CrossRef CAS.
- O. Saber and H. Tagaya, J. Inclusion Phenom. Macrocyclic Chem., 2003, 45, 109–116 CrossRef CAS.
- S. Higashimoto, K. Okada, T. Morisugi, M. Azuma, H. Ohue, T. H. Kim, M. Matsuoka and M. Anpo, Top. Catal., 2010, 53, 578–583 CrossRef CAS.
- T. Shishido, K. Teramura and T. Tanaka, Catal. Sci. Technol., 2011, 1, 541–551 RSC.
- X. Lang, W. Ma, Y. Zhao, C. Chen, H. Ji and J. Zhao, Chem. – Eur. J., 2012, 18, 2624–2631 CrossRef CAS.
- J. C. Evans, Spectrochim. Acta, 1960, 16, 428–442 CrossRef CAS.
- E. V. Brown and W. H. J. Kipp, J. Org. Chem., 1971, 36, 170–173 CrossRef CAS.
- H. Luo, B. Wang, T. Liu, F. Jin, R. Liu, C. Xu, C. Wang, K. Ji, Y. Zhou, D. Wang and S. Dou, Energy Storage Mater., 2019, 19, 370–378 CrossRef.
- L. Zhang, C. Zheng, F. Li, D. G. Evans and X. Duan, J. Mater. Sci., 2007, 43, 237–243 CrossRef.
- G. T. Tyuliev and K. L. Kostov, Phys. Rev. B: Condens. Matter Mater. Phys., 1999, 60, 2900–2907 CrossRef CAS.
- H. Wang, D. Yong, S. Chen, S. Jiang, X. Zhang, W. Shao, Q. Zhang, W. Yan, B. Pan and Y. Xie, J. Am. Chem. Soc., 2018, 140, 1760–1766 CrossRef CAS.
- Q. Maqbool and A. Srivastava, Chem. – Eur. J., 2017, 23, 13864–13868 CrossRef CAS.
- Y. Shiraishi, S. Kanazawa, Y. Sugano, D. Tsukamoto, H. Sakamoto, S. Ichikawa and T. Hirai, ACS Catal., 2014, 4, 774–780 CrossRef CAS.
- X. Sun, X. Luo, X. Zhang, J. Xie, S. Jin, H. Wang, X. Zheng, X. Wu and Y. Xie, J. Am. Chem. Soc., 2019, 141, 3797–3801 CrossRef CAS.
- H. Li, F. Qin, Z. Yang, X. Cui, J. Wang and L. Zhang, J. Am. Chem. Soc., 2017, 139, 3513–3521 CrossRef CAS.
Footnote |
| † Electronic supplementary information (ESI) available. See DOI: 10.1039/d0cy01721c |
| This journal is © The Royal Society of Chemistry 2021 |

