Spectral dynamics and gas-phase oxidation of laser-produced plutonium plasmas
S. S.
Harilal
 *a,
C. M.
Murzyn
b,
E. J.
Kautz
 a,
M. K.
Edwards
a,
S. I.
Sinkov
a,
S. E.
Bisson
c,
S. S.
Mitra
a and
J. B.
Martin
a
a,
M. K.
Edwards
a,
S. I.
Sinkov
a,
S. E.
Bisson
c,
S. S.
Mitra
a and
J. B.
Martin
a
aPacific Northwest National Laboratories, Richland, WA 99352, USA. E-mail: hari@pnnl.gov
bSandia National Laboratories, Albuquerque, NM 87185, USA
cSandia National Laboratories, Livermore, CA 94550, USA
First published on 20th November 2020
Abstract
We report results and analysis from a series of laser ablation experiments conducted to study high-temperature plutonium (Pu) spectroscopy and gas-phase oxidation. Time-resolved emission spectra were compared to a Pu I spectral model to infer plasma temperature. At later times in the laser-produced plasma evolution, temperatures are lower, and resonant emission bands indicative of molecular species are observed. We tentatively assign these bands to plutonium oxides (PuxOy).
Introduction
Optical spectroscopy of plutonium (Pu) and its gas-phase chemistry is an important area of actinide research that is sparsely studied owing to the complexities of material handling and analysis. The atomic spectrum of Pu is similar to all actinides in that it has tens of thousands of spectral lines in the ultraviolet-visible spectral range arising from thousands of known energy levels belonging to the neutral atom and ions.1–4 Historical reports on the atomic Pu spectrum are comprehensive, although the excitation methods of electrodeless discharge lamps (EDL) and hollow cathode lamps (HCL) provide relatively low temperatures compared to what can be achieved with a laser-produced plasma (LPP) system. Prior work in Pu spectroscopy has focused on the precise isotopic shifts and hyperfine splitting.5,6 Until recently, quantitative spectral analysis using any method was limited by the dearth of available transition probabilities.Studies related to Pu spectral features, as well as gas-phase oxidation, are critical to nuclear proliferation detection and safeguard applications.7 Pu inventories worldwide for civilian applications (i.e. nuclear energy) are in the form of Pu oxide, however, for certain military applications, Pu metal is used. Safe management and monitoring of Pu inventories is essential for protecting workers, the public, and the environment from accident scenarios. Currently, mass-spectrometry (a laboratory-based technique) is used for Pu detection and analysis which requires extensive sample preparation and is thus time-consuming. Hence, rapid, real-time and in-field tools are crucial for Pu detection considering its high activity and toxicity and implications to several nuclear verification activities. Optical spectroscopy of laser ablation plumes is a potential method for rapid, in-field detection of actinides and its isotopes.8
In comparison to Pu spectroscopy and gas-phase oxidation, significant progress has recently been made on understanding the gas-phase chemistry of uranium (U). For example, extensive efforts were recently made on understanding chemical reaction pathways and physical conditions leading to gas-phase oxide formation in U plumes generated by lasers.9–16 Optical emission spectroscopy (OES) of laser ablation plumes, commonly called laser-induced breakdown spectroscopy (LIBS), has been used for these investigations and has proven to be a useful tool for tracking the progression of atoms to molecules in a high-temperature LPP.17–20 Several bands of UxOy (UO, UO2, UO3, etc.) were identified in the ultraviolet, visible, and IR spectral regions.13,21,22 Our previous studies also highlighted that gas-phase oxidation primarily happens at the outer edges of the plume where lower-temperature conditions exist.9,23 Although extensive research efforts are made on understanding Pu corrosion (solid-phase),24 the studies related to spectral dynamics of high-temperature Pu plumes are nearly non-existent. Additionally, to the best of the authors' knowledge, the gas-phase chemistry of Pu and spectral features of Pu molecular compounds are not reported in the literature.
In this article, we report time-resolved spectral features of laser-produced Pu plasmas. The measured time-resolved spectral features are compared with model fits for obtaining approximate temperatures. We also evaluated the oxide bands in Pu plumes that are present in the spectral features due to gas-phase oxidation at later times of plasma evolution when temperatures of the plumes are favourable for molecular formation. We identified potential Pu oxide bands and assigned them to PuxOy.
Experimental materials and methods
Laser ablation experiments were conducted to characterize the spatial, spectral, and temporal variations in Pu plasmas. The analyte used in these experiments was a 239Pu metal foil (2 μm thick) with a total mass of 6.207 mg. A summary of the isotopic purity of the sample and radioactivity of various isotopes and impurities are given in Table 1. The thickness of the foil limited the number of laser pulses that could be used in a single location. The Pu sample was mounted in a modular vacuum chamber pumped down to 9 mTorr and then backfilled with Argon to 75 Torr.| Isotope | Activity (Ci) | Mass (mg) | Mass (%) |
|---|---|---|---|
| Pu-239 | 3.81 × 10⁻⁴ | 6.15 × 10 | 99.095% |
| Pu-240 | 1.24 × 10⁻⁵ | 5.46 × 10⁻² | 0.880% |
| Pu-241 | 6.42 × 10⁻⁵ | 6.21 × 10⁻⁴ | 0.010% |
| Am-241 | 1.77 × 10⁻⁶ | 5.17 × 10⁻⁴ | 0.008% |
| Pu-242 | 1.23 × 10⁻⁹ | 3.10 × 10⁻⁴ | 0.005% |
| Pu-238 | 2.13 × 10⁻⁶ | 1.24 × 10⁻⁴ | 0.002% |
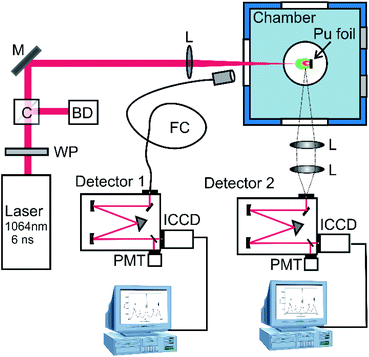
The schematic of the experimental setup is given in Fig. 1. The Pu was ablated with a 6 ns full-width half maximum (FWHM), 34 mJ pulse from an unseeded Nd:YAG (1064 nm, ∼300 μm spot size). A combination of a half waveplate and a polarizing cube was used to control the laser pulse energy. Emission spectra were collected in a variety of configurations to obtain different measurements. The first spectrometer (detector 1 in Fig. 1) was a 500 mm focal length with a 2400 lines per mm grating equipped with an intensified charged coupled device (ICCD, Princeton Instruments PI-MAX4) having an approximate spectral resolution of ∼35 pm. This spectrometer was fiber-coupled (NA = 0.39, core diameter = 1500 μm) to a collection lens and positioned such that the emission spectra are spatially integrated. The second spectrometer also had a 500 mm focal length with a 2400 lines per mm (detector 2 in Fig. 1), but the detector was an Andor iStar ICCD. This spectrometer was oriented orthogonal to the plasma expansion direction to allow for the collection of spatially resolved emission spectra to evaluate positional dependence of spectral features. Both spectrograph-ICCD systems were corrected for collection efficiency using a deuterium–tungsten halogen UV-VIS light source (Ocean Optics, DH-2000-DUV). Over the duration of the experiments, approximately 10 Torr of air leaked into the chamber which enabled the characterization of Pu oxidation.
Results and discussion
Plutonium spectral features
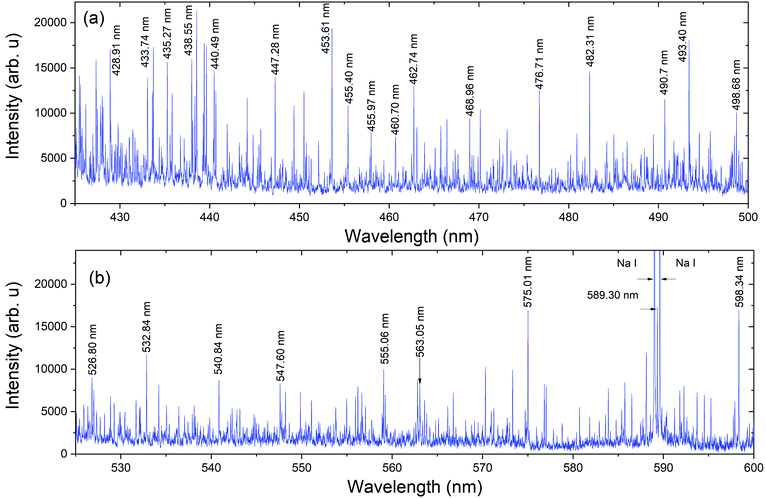
The spectral measurements of Pu plume were carried out at 75 Torr Argon (Ar) pressure. An inert (Ar) gas environment was used here to minimize Pu plasma oxidation. The background pressure of 75 Torr was selected based on prior work that demonstrated the signal to noise ratio (SNR) of ns laser ablation plumes are highest when the ambient pressure was ∼50–100 Torr.11,25 Pu gas-phase oxidation can take place through the interaction of Pu species with ambient oxygen and/or impurity oxygen from the sample. The Pu metal foil from a glovebox was loaded into the vacuum chamber in atmospheric conditions, and therefore the Pu metal oxidized. Thus, a laser cleaning shot was applied before measuring Pu spectral features.The spectral features of Pu plasmas were collected using both detectors detailed in the Experimental materials and methods section and schematically shown in Fig. 1. Fig. 2 gives the typical emission spectrum in the spectral range of 425–600 nm, showing highly congested features. The measurement was made using detector 1 (spatially integrated) with a delay time of 5 μs and a gate width of 1 μs. Laser ablation plumes are hotter and denser at the very early times of its evolution (≤100 ns) and the spectral features are dominated by continuum emission. As time after plasma onset increases, the plasma becomes cooler and less dense due to its rapid expansion in the ambient environment, and atomic lines dominate at times ≥1 μs.8 Select strong Pu emission lines are marked in the Fig. 2 spectrum for reference.1 The lines noted at 589 nm, and 589.6 nm results from Na contamination.
Temporally and thermally resolved emission spectra are particularly informative for studying the thermodynamics of recombination and oxidation processes during plasma cooling. Time-resolved spectral features were measured at three spectral range with central wavelengths 437 nm, 596 nm, and 603 nm (bandwidth ∼7 nm) to characterize the temporal variation in emission. These measurements were performed using detector 2 (see Fig. 1) at a distance of 2.5 mm from the target. Neutral Pu lines (Pu I) were fit to an approximate excitation temperature using transition probabilities and an optically thin emission model.26
The spectral model was constructed as follows: the Lorentz FWHM was calculated from an approximate collisional frequency at 75 Torr using a hard-sphere model. The Gaussian FWHM was calculated from the temperature. The Voigt line shape was calculated from those two components and taken as the real part of the Faddeeva function. The physically modelled spectrum was then convolved with a 35 pm Gaussian function of the spectrometer to reproduce the approximate instrument resolution.
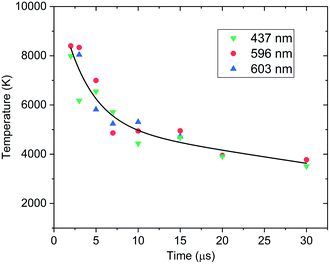
The model excludes higher-order line shape effects such as Stark broadening or asymmetry due to the hyperfine splitting in 239Pu (I = 1/2).27 The isotopic shifts and splitting of 239Pu are significantly finer than the resolution of these measurements. The spectral model was fit to the data using a Nelder–Mead optimization algorithm. The modelling and regression algorithms were custom written in Python version 3.7. Experimental data and model-fits of 593–599 nm spectral range are shown in Fig. 3. A summary of plasma temperature determined from fitting the model with experimental data is shown in Fig. 4.
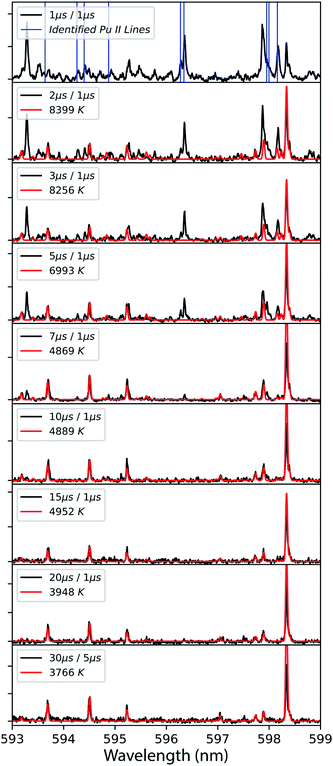 | ||
| Fig. 3 Time-resolved emission spectra from laser ablation (black) model-fit to temperature (red) using Pu I emission. Delay time, gate duration, and fitted temperatures are shown in legend for each spectrum. The top frame shows the known Pu II emission lines with vertical blue bars. Data was taken at 2.5 mm from the target surface using detector 2 (Fig. 1). | ||
Although there are several assumptions and simplifications in the modelled spectra, the spectral fits showed good agreement with measured spectral features, especially at later times where Pu I atomic emission dominates. The disagreement between the measured and modelled spectra are due to several factors. The collection geometry can influence the observed emission temperatures.28,29 This is due to the implicit path-integrated signal spanning the temperature gradient throughout the plume. More complicated physics can further distort the spectrum by introducing effects such as self-absorption of transitions falling to metastable states where the lower state has a significant population. These factors generate observed emission spectra that may be inadequately represented with a 1-dimensional model not accounting for the spatial anisotropy of temperature. In reality, the observed ion emission is probably emanating from a region of the plasma at a much higher temperature and the neutral atom emission originates from cooler regions.28 From this, it can be assumed that the excitation temperature of the neutral atom is likely a lower bound for the excitation temperature of the ion contribution to the measured spectrum. Hence the term temperature in this analysis is, therefore, referring to the excitation temperature of neutral Pu. Neither the excitation temperature of the ion nor the electron temperature was separately measured at this time and therefore local thermal equilibrium (LTE) cannot be verified.
Particularly with actinide spectra, the extraordinary line density, presence of gas-phase oxides that provide a broader spectral feature compared to atomic transitions,13,21 and instrument broadening lead to pseudo-continuum that has to be subtracted off before fitting the isolated resonant emission. Therefore, the preparation of the spectra prior to fitting will also influence the perceived temperature. These combined effects lead to relatively large uncertainties in the temperatures compared to other optical methods (e.g., laser absorption spectroscopy). Model regressions will typically provide superior analytical results compared to numerical integration because it is more robust against the extreme line density of actinide spectra. However, it has to be mentioned that this remains heavily limited by the completeness of the model. High-temperature spectra are heavily congested with Pu II emission which is not included in the model at this time and can lead to erroneous fitting especially at early times of plasma evolution. The accuracy can be qualitatively assessed by observing the model fits and seeing where known Pu II emission may be distorting the Pu I lines in the fit. In the case of the 596 nm spectral region, we excluded the strong line near 598.3 nm as it was found to erroneously distort the fit. We believe this behaviour to arise from radiative trapping and report only temperatures where the model appeared representative of the Pu I lines in the data.
Despite the identified limitations of the spectral model and measurement, first-order thermochemical insight can still be gleaned from modelling and simulation analysis of the data. Inspection of the experimental data and model-fits in Fig. 3 shows that at early times while the temperatures are above 8000 K the emission spectrum is heavily congested with both neutral and ion emission at approximately equal intensities. The known Pu II ion emission persists until the plasma cools to 5000 K when it appears that most of the emission then belongs to the neutral atom.
The intensity of a spectral line in emission from a transition between an upper level (u) and a lower level (l) is proportional to upper state number density. This also assumes the excited level is equilibrated which may not be valid in all cases. If the excited state is equilibrated the population fraction (ni/nT) in a given energy level has temperature dependence through the Boltzmann factor as well as the partition function. Particularly for actinides, the partition sum is a strong function of temperature due to the presence of a large number of low-lying energy levels. The equilibrium population fraction as a function of temperature is calculated for the upper state energy levels for five strong transitions of Pu I in the 596 nm range (Fig. 3) and results are given in Fig. 5. We show both the absolute values, as well as the same value normalized at 4000 K to highlight the relative change in upper state number density across the range of temperatures measured in our experiment.
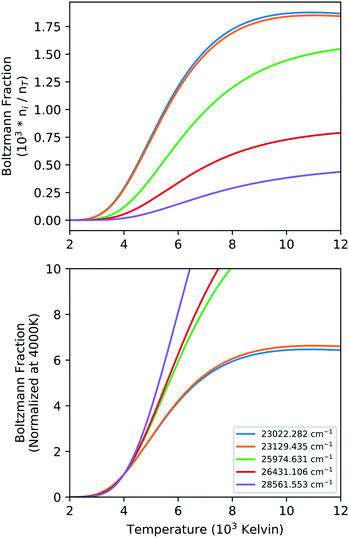 | ||
| Fig. 5 Graphical illustration of the temperature dependence of population fraction in neutral Pu energy levels. The top panel shows absolute fractions, and the bottom frame shows normalized values. | ||
At a fixed total number density (nT) of Pu I, the upper state population (ni) can easily change by a factor 10 across the temperatures seen in the LPP. The relative change in the upper state population density between the various levels as shown in Fig. 5 is an indicator of the dynamic range of temperatures that can be accurately measured with the transitions in that spectral range. However, the emission intensity of individual lines can be corrected with knowledge of material temperature by dividing intensity by the population fraction at that temperature. The corrected intensity is then proportional to the total number density instead of solely the upper state density. This correction would require the temperature for each material to be known, and even then, the intensity changes are only relative within the given material. Comparing intensities between materials to back out relative concentrations would further require the inclusion of the weighted transition probability (giAul). These factors must be considered when interpreting temporal data with such strong thermal gradients, and even then, assumptions of path length will be influenced by hydrodynamic phenomena in the plasma expansion.
Gas-phase plutonium oxidation
The oxidation of Pu metal surface is similar to U metal and it reacts rapidly with the oxygen in ambient air to form PuO2 and Pu2O3.30 The Pu surface corrosion in the presence of air or water vapor has been extensively investigated, and the thickness of the oxide layer on the Pu base metal is found to depend on oxygen concentration.23 While Pu metal oxidation is well studied, oxidation in the gas-phase has not yet been explored. The molecular formation in a laser-produced plasma system occurs at later times of plumes' lifetime when the plasma temperatures are cooler (≤ 5000 K).12,23,31 We collected the spectral features from Pu plasma at early and late times to explore the molecular features due to an undetermined oxide of plutonium, which we label PuxOy. The source of oxygen for Pu gas-phase oxidation is from the ablation of the oxide layer formed on the Pu metal and/or the oxygen impurity present in the ambient environment.We noticed that the Ar-back filled vacuum chamber used for the experiment was leaking with air intake of ∼1 Torr per day. The survey spectra taken at 5 μs and 15 μs are given in Fig. 6 and the spectrum measured at delayed times showed an appearance of broad spectral features, an indication of the presence of molecular bands. The spectral measurements were taken at a chamber pressure of ∼85 Torr (75 Torr Ar and 10 Torr air). To the best of authors' knowledge, this is the first published experimental data on the electronic spectrum of PuxOy. This spectrum shown in Fig. 6 is directly compared to the same spectral range measured at shorter delay times when temperatures are too high for molecular formation. We assign the broad spectral features highlighted around 593.2 nm, 606 nm, 624.5 nm, 634.4 nm, and 648.6 nm to PuxOy.
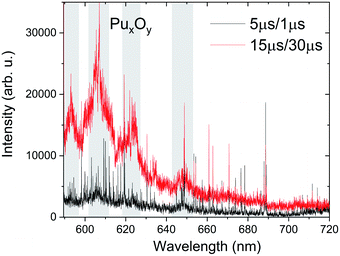 | ||
| Fig. 6 Survey spectra taken at 15 μs delay and 30 μs gate width showing potential molecular emission bands tentatively assigned to oxides of Pu (PuxOy). For comparison, the spectral features recorded at 5 μs delay and 1 μs gate width is also given. Marked regions correspond to potential molecular band emission. Spectra were collected using detector 1 and are spatially integrated (Fig. 1). | ||
Without resolution to measure the rotational moment of inertia of the molecule generating these band spectra, we can only tentatively assign the observed bands to PuxOy, but we extended our experiments to study the formation of these structures to increase confidence in that assignment. We collected these electronic spectra using two different experimental methods. The first method collected spectra from a cleaning shot, where the surface of the analyte is ablated to remove any contaminants. Despite the chamber being backfilled with argon (75 Torr), our Pu metal sample oxidized at an extremely rapid rate, so that an oxide layer formed during the sample loading. We observed that when using multiple laser pulses on the same sample location with 15 μs delay and 40 μs gate, the first shot produced the observed oxide structures and the second shot did not. Spectra from the first and second shots are shown in Fig. 7. We confirmed that we did not ablate through the entire Pu foil with the first shot, because the spectrum from the second shot retains the atomic emission of Pu metal. The spectral features collected during the cleaning shot showed broad spectral features along with strong background-like radiation, indicative of molecular emission.
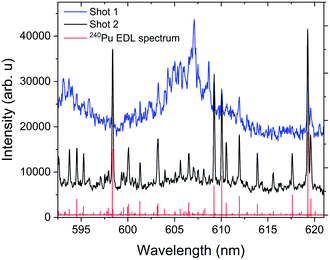 | ||
| Fig. 7 Molecular emission band head generated from the ablation of the passivating oxide layer formed on the surface of the Pu metal sample. The measurements were taken with a delay time of 15 μs and gate width of 30 μs. The spectra given were each obtained from a single ablation shot with no averaging. Shot 1 and shot 2 represent the spectral data obtained without and with cleaning. The red spectral features given corresponds to the 240Pu EDL spectrum.1,2 | ||
Our second method traced the temporal evolution of these spectral features with a series of time-resolved measurements and results are given in Fig. 8. The sample was cleaned, and then spectra were collected at varying delay times. Time-resolved spectral features are predominated by atomic transitions at early times. As time progress, broad molecular spectral features appeared. This is compared to the same spectral feature shown in Fig. 7 that was generated by vaporizing Pu oxide from the surface of the analyte.
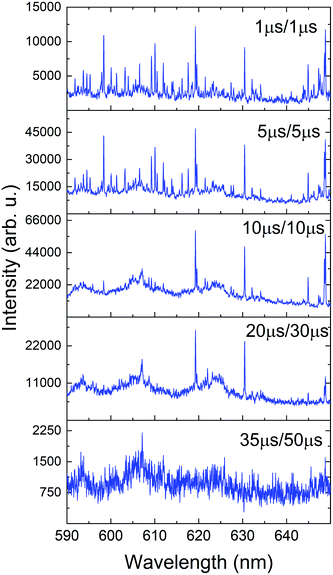 | ||
| Fig. 8 Time-resolved spectra showing the onset and offset of molecular emission features in the Pu plasma. Delay/gate times are shown in the legend of each frame. | ||
Several distinct bands due to PuxOy can be seen in both Fig. 6 and 8. In Fig. 8 it is clear that as the atomic emission lines of Pu subside, the molecular structures are forming at later times. This lends credence to the assignment of these bands to a lower oxide of Pu such as PuO. Our future investigations will look to definitively assign these bands with rotational resolution using more precise laser techniques such as laser absorption spectroscopy or laser-induced fluorescence.32 When interpreting the time-gated spectra in Fig. 8 we again must factor in the temperature dependence of emission. The bands we are tentatively assigning to PuxOy are present in the 10–35 μs window, which from our temperature fits corresponds to 5000 to 3500 K if the molecules and atoms are in LTE with one another and these temperatures favour molecular formation in laser ablation plumes.12,23 The absence of these bands after 35 μs can be interpreted that reactions have taken place and have progressed to higher oxides, or the temperature has sufficiently cooled to the point that the same molecules have stopped emitting. Further experiments will need to actively probe the plasma in absorption to determine which of those conclusions is more accurate.
Conclusions
In this article, we report temporal evolution of Pu spectral features, plasma temperatures, and Pu plasma chemistry evolution. Pu spectra features obtained via ns laser ablation are extremely congested due to numerous atomic, ionic, and molecular species present in the plume. Time-resolved Pu emission spectra were compared to simulated Pu I spectra, which allowed us to estimate the temperature in the ablation plume as a function of time. At later times in plasma evolution, when temperatures are much lower, we observe resonant emission bands indicative of molecular species. We tentatively assigned these structures to an undetermined Pu oxide (PuxOy). These spectral features have not previously been identified in the literature. Further work is needed to conclusively identify molecular bands to Pu oxide species. This first-ever report of Pu gas-phase oxidation spectra has implications for in-field detection of actinide materials where plasma chemistry is prominent.Conflicts of interest
There are no conflicts to declare.Acknowledgements
This work was funded by Sandia National Labs' LDRD Office (SAND2020-9478 J). SNL is managed and operated by NTESS under DOE NNSA contract DE-NA0003525. All experimental work was performed at Pacific Northwest National Laboratory (PNNL), which is operated for the U.S. DOE by the Battelle Memorial Institute under Contract No. DE-AC05-76RLO1830. PNNL's work is also partly supported by the Department of the Defense, Defense Threat Reduction Agency under award HDTRA1-20-2-0001. Any subjective views or opinions that might be expressed in the paper do not necessarily represent the views of the U.S. Department of Energy or the United States Government. The authors would like to thank Randall Berg (PNNL) for facilitating the experimental work and R. K. Harrison (SNL) for his technical review of this manuscript.References
-
J. Blaise, M. Fred and R. G. Gutmacher, Argonne National Laboratory report, Report No. ANL-83-95, 1984 Search PubMed
.
- M. C. Edelson, E. L. Dekalb, R. K. Winge and V. A. Fassel, Spectrochim. Acta, Part B, 1986, 41, 475–486 CrossRef
.
-
M. Edelson, E. DeKalb, R. Winge and V. Fassel, AMES Laboratory report, Repor No. IS-4883, 1986 Search PubMed
.
- J. Blaise, M. Fred and R. G. Gutmacher, J. Opt. Soc. Am. B, 1986, 3, 403–418 CrossRef CAS
.
- M. Miyabe, M. Oba, K. Jung, H. Iimura, K. Akoka, M. Kato, H. Otobe, A. Khumaeni and I. Wakaida, Spectrochim. Acta, Part B, 2017, 134, 42–51 CrossRef CAS
.
- C. A. Smith, M. A. Martinez, D. K. Veirs and D. A. Cremers, Spectrochim. Acta, Part B, 2002, 929–937 CrossRef CAS
.
-
D. L. Clark, S. S. Hecker, G. D. Jarvinen and M. P. Neu, in The Chemistry of the Actinide and Transactinide Elements, ed. L. R. Morss, N. M. Edelstein and J. Fuger, Springer, Netherlands, Dordrecht, 2006, pp. 813–1264, DOI:10.1007/1-4020-3598-5_7
.
- S. S. Harilal, B. E. Brumfield, N. L. LaHaye, K. C. Hartig and M. C. Phillips, Appl. Phys. Rev., 2018, 5, 021301 Search PubMed
.
- E. J. Kautz, P. Skrodzki, M. Burger, I. Jovanovic, B. E. Bernacki, M. C. Phillips and S. S. Harilal, J. Anal. At. Spectrom., 2019, 34, 2236–2243 RSC
.
- M. S. Finko, D. Curreli, D. G. Weisz, J. C. Crowhurst, T. P. Rose, B. Koroglu, H. B. Radousky and M. R. Armstrong, J. Phys. D: Appl. Phys., 2017, 50, 485201 CrossRef
.
- E. J. Kautz, J. Yeak, B. E. Bernacki, M. C. Phillips and S. S. Harilal, J. Anal. At. Spectrom., 2020, 35, 1574–1586 RSC
.
- E. J. Kautz, M. C. Phillips and S. S. Harilal, Anal. Chem., 2020, 92(20), 13839–13846 CrossRef CAS
.
- S. S. Harilal, B. E. Brumfield, N. G. Glumac and M. C. Phillips, Opt. Express, 2018, 26, 20319 CrossRef CAS
.
- K. Hartig, S. S. Harilal, M. C. Phillips, B. E. Brumfield and I. Jovanovic, Opt. Express, 2017, 25, 11477–11490 CrossRef CAS
.
- E. N. Weerakkody, D. G. Weisz, J. Crowhurst, B. Koroglu, T. Rose, H. Radousky, R. L. Stillwell, J. R. Jeffries and N. G. Glumac, Spectrochim. Acta, Part B, 2020, 170, 105925 CrossRef CAS
.
- X. L. Mao, G. C. Y. Chan, I. Choi, V. Zorba and R. E. Russo, J. Radioanal. Nucl. Chem., 2017, 312, 121–131 CrossRef CAS
.
- E. J. Kautz, J. Yeak, B. E. Bernacki, M. C. Phillips and S. S. Harilal, Phys. Chem. Chem. Phys., 2020, 22, 8304–8314 RSC
.
- E. Garlea, B. N. Bennett, M. Z. Martin, R. L. Bridges, G. L. Powell and J. H. Leckey, Spectrochim. Acta, Part B, 2019, 159, 105651 CrossRef CAS
.
- M. Singh and A. Sarkar, Plasma Sci. Technol., 2018, 20, 125501 CrossRef CAS
.
-
J. P. Singh and S. N. Thakur, Laser-induced breakdown spectroscopy, Elesiver, Amsterdam, 2020 Search PubMed
.
- P. Skrodzki, M. Burger, I. Jovanovic, B. E. Brumfield, M. C. Phillips and S. S. Harilal, Opt. Lett., 2018, 43, 5118 CrossRef CAS
.
- B. Koroglu, Z. R. Dai, M. Finko, M. R. Armstrong, J. C. Crowhurst, D. Curreli, D. G. Weisz, H. B. Radousky, K. B. Knight and T. P. Rose, Anal. Chem., 2020, 92, 6437–6445 CrossRef CAS
.
- S. S. Harilal, E. J. Kautz, B. E. Bernacki, M. C. Phillips, P. Skrodzki, M. Burger and I. Jovanovic, Phys. Chem. Chem. Phys., 2019, 21, 16161 RSC
.
- B. Y. Ao and R. Z. Qiu, Corros. Sci., 2019, 153, 236–248 CrossRef CAS
.
- S. S. Harilal, P. K. Diwakar, N. L. LaHaye and M. C. Phillips, Spectrochim. Acta, Part B, 2015, 111, 1–7 CrossRef CAS
.
- C. M. Murzyn, S. E. Bisson, S. S. Mitra and J. B. Martin, to be published.
- J. Butterworth, Philos. Mag., 1958, 3, 1053–1054 CrossRef CAS
.
- J. A. Aguilera and C. Aragon, Spectrochim. Acta, Part B, 2004, 59, 1861–1876 CrossRef
.
- M. Burger, P. J. Skrodzki, I. Jovanovic, M. C. Phillips and S. S. Harilal, Phys. Plasmas, 2019, 26, 093103 CrossRef
.
-
T. C. Totemeier, Argonne National Laboratory report ANL/ED/95-2, 1995 Search PubMed
.
- A. De Giacomo and J. Hermann, J. Phys. D: Appl. Phys., 2017, 50, 183002 CrossRef
.
- S. S. Harilal, C. M. Murzyn, M. C. Phillips and J. B. Martin, Spectrochim. Acta, Part B, 2020, 169, 105828 CrossRef CAS
.
| This journal is © The Royal Society of Chemistry 2021 |

