 Open Access Article
Facile assembly and improved photocatalytic activity of a special cuprous oxide/copper fluoride heterojunction induced by graphene oxide†
Mengya
Xi
,
Wanru
Zhang
,
Zhiyuan
Liu
,
Lixia
Qin
,
Shi-Zhao
Kang
 and
Xiangqing
Li
 *
*
School of Chemical and Environmental Engineering, Center of Graphene Research, Shanghai Institute of Technology, 100 Haiquan Road, Shanghai 201418, China. E-mail: xqli@sit.edu.cn
First published on 24th February 2021
Abstract
The simple fabrication of effective-contacted heterojunctional photocatalysts is still a challenge in practical applications. Herein, a special flower-like Cu2O/CuF2 heterojunction nanocomposite (Cu2O/GO/CuF2) was facilely achieved in situ induced by graphene oxide (GO). The assembly mechanism of the Cu2O/GO/CuF2 nanocomposite was studied by means of ultraviolet-visible spectroscopy, Fourier transform infrared spectroscopy, X-ray powder diffraction, and scanning electron microscopy. It was found that the introduction of GO can promote the formation of the Cu2O/CuF2 heterojunction. Furthermore, the performance of the composite was evaluated via photocatalytic hydrogen production. The results showed that its activity was much higher than those of the other comparisons. The mechanism of photocatalytic hydrogen production over the Cu2O/GO/CuF2 nanocomposite was explored, demonstrating that good light absorption, low interfacial resistance and high charge separation in the special heterojunction induced by GO were responsible for the enhanced performance.
1. Introduction
As an economical and environmentally friendly strategy, photocatalytic water splitting technology has attracted the attention of researchers because it can convert solar energy into conservable chemical fuels.1,2 In this regard, photocatalysts based on semiconductors that can effectively collect and transform light energy are of most interest.3,4As an environmentally friendly and cheap semiconductor with a narrow band gap, cuprous oxide has potential applications in many fields including solar cells, gas sensors, lithium-ion battery and photocatalysis.5 In particular, it has attracted wide attention from researchers due to high photocatalytic and photoelectrochemical performances in the water decomposition reaction.6 Unfortunately, a high combination of electrons and holes is observed due to the presence of random defects in pure Cu2O, which will severely limit the photocatalytic process.7 Therefore, the design and development of Cu2O-related photocatalysts with high charge separation and photocatalytic activity are still essential challenges.
In order to effectively decrease charge recombination in semiconductors and improve the catalytic activity, the fabrication of heterojunction structures has been considered as an effective strategy.8 Copper fluoride, a wide band-gap positive material with a rutile crystal structure, has been reported as a new type of photocatalyst.9 However, copper fluoride easily forms hydrogen bonds with water molecules, thereby reducing the nucleophilicity of fluoride ions. By combining CuF2 and the bis-phosphine ligand, Constantin et al. obtained a new catalyst system, and found that catalytic activity was improved by the introduction of CuF2.10 Casares et al. found that, in the coupling of arylalkoxysilanes, CuF2 greatly accelerated the reaction process so that the catalytic activity was enhanced.11
It is known that, by controlling the size and dispersion of the cocatalyst, and establishing the appropriate connection between the cocatalyst and the photocatalyst, the photocatalytic activity can be expected to significantly improve due to the low energy barrier and high charge transfer in the interface.12 The simple fabrication of effective-contacted heterojunctional photocatalysts is an effective way to solve the problem. In the various methods used to prepare the junctions (such as the sol–gel method, hydrothermal synthesis, coprecipitation, ball milling, solid phase synthesis, continuous deposition technology, and in situ growth method13), the heterojunction prepared by in situ synthesis exhibits better performance.14 No obvious lattice dislocations or defects were found at the interface synthesized using an in situ method compared with that prepared by continuous deposition.15 However, an individual heterojunction is easy to coalesce and shows poor dispersibility and low stability.
In recent years, many researchers have conducted extensive research on carbon-based catalysts.16–19 As an ideal catalyst support, GO has been widely used to improve the photocatalytic performance of semiconductors such as TiO2, ZnO, CdS, and ZnFe2O4.20 Generally, its enhancement mechanism can be attributed to the following facts: capture and transfer electrons, broaden spectral response range, prevent the agglomeration of nanoparticles, and enhance the adsorption of materials.21 Moreover, Pan et al. found that the composition, morphology and energy band structure of tin oxide–reduced graphene oxide nanocomposites can be controlled by GO.22 Lei et al. confirmed that GO can change the morphology of the carbonated resorcinol–formaldehyde particles and enhance the utilization of micropores, thus obtaining a better supercapacitor performance.23 Based on the above analysis, it is feasible to fabricate a special Cu2O/CuF2 heterojunction induced by GO in order to obtain a Cu2O-based photocatalyst with high charge separation for efficient photocatalytic hydrogen production. To our knowledge, there is no report about a GO-induced Cu2O/CuF2 heterojunction for photocatalytic H2 generation.
In this study, via in situ growth, a special Cu2O/CuF2 heterojunction is fabricated induced by GO. The morphology, structure, and composition of the target material (Cu2O/GO/CuF2 nanocomposite) are studied via SEM, TEM, XRD, FTIR and XPS. The in situ prepared Cu2O/GO/CuF2 nanocomposite shows a better photocatalytic activity for hydrogen production compared with those of the comparisons. In addition, the mechanisms of electron transfer and photocatalytic hydrogen production in the Cu2O/GO/CuF2 nanocomposite are studied.
2. Experimental section
2.1 Assembly of the Cu2O/GO/CuF2 nanocomposite
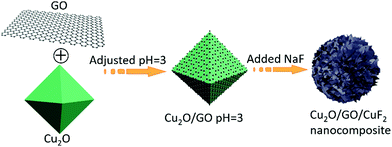
250 mg of Cu2O (prepared according to the method in the literature24) was added into 0.2 mg mL−1 of GO dispersion. The suspension was stirred for 24 h, and then the solid (Cu2O/GO) was separated centrifugally, washed to neutrality, and placed in a vacuum oven at 60 °C.100 mg of Cu2O/GO was suspended in 100 mL of secondary water, the pH value of the solution was adjusted to 3 with 0.1 mol L−1 of HCl, and then 39 mg of NaF was added and stirred at room temperature for 6 h. The solid (Cu2O/GO/CuF2 nanocomposite) was separated, washed to neutrality, and put in a vacuum oven at 60 °C. The main process is shown in Scheme 1.
In addition, the comparison, the Cu2O/GO/CuF2 (simply mixed) obtained by simply mixing Cu2O, GO and CuF2, was also prepared. The procedure was similar to the in situ assembly of the Cu2O/GO/CuF2, except that NaF was replaced with CuF2.
2.2 Characterizations
All samples used in TEM measurements were dispersed into double distilled water to form a suspension. A drop was then added onto a 230 mesh copper grid with an ultrathin carbon film. The morphology of the sample was taken using a Japanese JEOL JEM-2100F transmission electron microscope at an acceleration voltage of 200 kV. The SEM image of the sample was observed using a Japanese S-4800N Hitachi High Technologies scanning electron microscope. The powder X-ray diffraction (XRD) measurements of the sample were recorded on a German Bruker D8 Advance X-ray diffractometer with monochromatic Cu Kα radiation. The absorption spectra of the catalysts in the 350–700 nm range were obtained on a UV-3900 spectrophotometer from Japan. Fourier transform infrared spectroscopy (FTIR) was carried out on a Nicolet 6700 FTIR spectrometer from America. X-ray photoelectron spectroscopy was recorded on a Thermo ESCALAB 250 X-ray photoelectron spectrometer made in America using a monochromatic Al Kα X-ray source and an analyzer with an energy of 1486.6 eV. The Raman spectrum of the sample was measured on a i-Raman-532S manufactured in America. A Hitachi F-4600 fluorescence spectrophotometer manufactured in Japan was used to measure the steady-state emission.2.3 Electrochemical measurements
The electrochemical measurements of the sample were performed on the CHI660E electrochemical workstation using a conventional three-electrode system at room temperature. The counter electrode was a platinum electrode, Ag/AgCl was a reference electrode, and the working electrode was FTO glass coated with the sample. The conductive surface of the cleaned FTO glass (1 × 1.5 cm2) was covered by the dispersion of sample. After natural drying, it was heat-treated in an oven at 60 °C to obtain a working electrode. A 0.1 mol L−1 KCl aqueous solution containing 0.01 mol L−1 K3Fe(CN)6/K4Fe(CN)6 (1![[thin space (1/6-em)]](https://www.rsc.org/images/entities/char_2009.gif) :
:![[thin space (1/6-em)]](https://www.rsc.org/images/entities/char_2009.gif) 1) was deoxidized and used as an electrolyte. The working electrode was operated at the range of 1 cm2.
1) was deoxidized and used as an electrolyte. The working electrode was operated at the range of 1 cm2.
2.4 Measurement of photocatalytic activity
10 mg of photocatalyst was suspended in 50 mL of triethanolamine (TEOA) aqueous solution (VTEOA![[thin space (1/6-em)]](https://www.rsc.org/images/entities/char_2009.gif) :
:![[thin space (1/6-em)]](https://www.rsc.org/images/entities/char_2009.gif) VH2O = 1
VH2O = 1![[thin space (1/6-em)]](https://www.rsc.org/images/entities/char_2009.gif) :
:![[thin space (1/6-em)]](https://www.rsc.org/images/entities/char_2009.gif) 5) through stirring to form a uniform dispersion. A top-illuminated photolysis water reactor (CEL-SP2 N, China) containing the above dispersion was purged with high-purity nitrogen to drive away the residual air before lighting. The carrier gas was 99.99% high-purity nitrogen. A CEL-HXUV300 xenon lamp (300 W) (spectral range in 340–780 nm) was as the light source. The hydrogen generated was analyzed using an online gas chromatograph and an external standard method.
5) through stirring to form a uniform dispersion. A top-illuminated photolysis water reactor (CEL-SP2 N, China) containing the above dispersion was purged with high-purity nitrogen to drive away the residual air before lighting. The carrier gas was 99.99% high-purity nitrogen. A CEL-HXUV300 xenon lamp (300 W) (spectral range in 340–780 nm) was as the light source. The hydrogen generated was analyzed using an online gas chromatograph and an external standard method.
3. Results and discussion
3.1 The assembly of the Cu2O/GO/CuF2 nanocomposite system
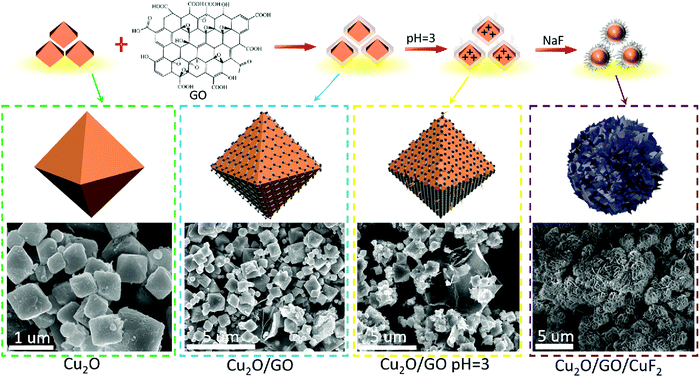
The morphology of the assembled Cu2O/GO/CuF2 nanocomposite system was first characterized. It can be seen from Fig. 1a, without GO, that the synthesized Cu2O/CuF2 consists of some lumpy particles without a definite morphology. Additionally, without GO, only by simply mixed CuF2 and Cu2O, no regular nanoflower-like morphology is observed (simple mixed) (Fig. S1, ESI†). In contrast, a uniform and nanoflower-like morphology is observed in the image of Cu2O/GO/CuF2 (Fig. 1b). Obviously, the introduction of GO can promote the construction of the nanoflower-shaped Cu2O/CuF2 heterojunction. Subsequently, the special Cu2O/CuF2 heterostructure has a close relationship with the synthesis method and the fabrication induced by GO. In order to further study the morphology and structure of the Cu2O/GO/CuF2, TEM and HRTEM images of the samples were taken. In the TEM image of the Cu2O/GO/CuF2 (Fig. 1c), the flower-like morphology is observed. The flower seems to be with an about 0.4 μm2 core surrounded by cross-linked nanosheets. In the HRTEM image of Cu2O/GO/CuF2 (Fig. 1d), the lattice spacings of 0.20 nm, 0.50 nm, and 0.42 nm are assigned to the Cu2O(111), (411), (222) crystal planes, the lattice spacings of 0.20 nm and 0.21 nm are attributed to the GO (101), (100) crystal planes, and those of 0.36 nm and 0.31 nm and 0.28 nm correspond to the (122), (022), and (−112) crystal planes of CuF2, respectively. The (202) crystal plane of CuO is also observed, indicating that a small amount of Cu2O is oxidized during the synthesis of the composite (due to its low photocatalytic activity and small amount, it was little discussed). Combining the SEM and TEM images (Fig. 1 and Fig. S1, ESI†), the nanoflower-like CuF2 could grow uniformly on the boundary of the Cu2O/GO (will be further confirmed by the “Element maps” following), indicating that the as-produced Cu2O/GO boundary is a relatively reactive site for the growth of CuF2. Moreover, the morphology and the interface in the Cu2O/GO/CuF2 nanocomposite is still maintained as shown in the HRTEM image even if it was treated by ultrasonic during the preparation of sample. The result evidences that the interaction between Cu2O and CuF2 is strengthened by forming the special heterojunction, which will facilitate the transfer of photogenerated e−/h+ pairs, and thus photocatalytic performance could be improved.25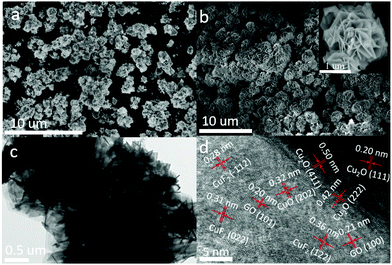 | ||
| Fig. 1 SEM images of (a) Cu2O/CuF2 and (b) Cu2O/GO/CuF2. (c) TEM image and (d) HRTEM image of the Cu2O/GO/CuF2. | ||
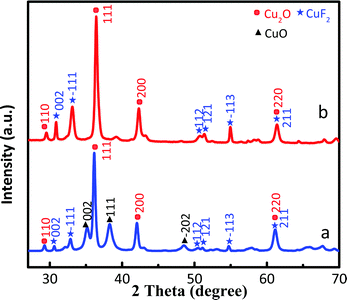
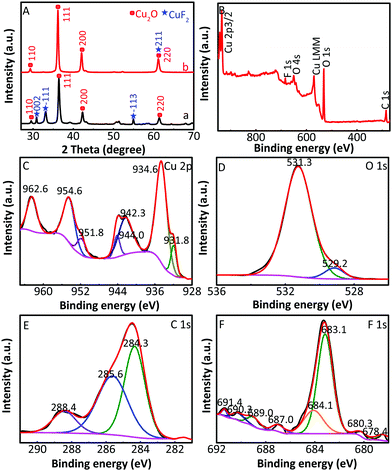
The XRD patterns of Cu2O/CuF2 and Cu2O/GO/CuF2 are shown in Fig. 2. The diffraction peaks at 29.4°, 36.2°, 42.1°, and 61.3° correspond to the (110), (111), (200), and (220) crystal faces of Cu2O, respectively, which match the PDF card of Cu2O (JCPDS 65-3288). Those new characteristic peaks at 30.6°, 32.8°, 50.4°, 51.1°, 54.8°, and 61.3° are attributed to the (002), (−111), (112), (121), (−113), and (211) crystal faces of CuF2, which match the PDF card of CuF2 (JCPDS 71-1131). It further suggests the formation of the CuF2 phase and not the doping of F− into Cu2O crystals. Additionally, no significant GO diffraction peaks are observed in the figure, possibly due to the low content of GO. Although some diffraction peaks of CuF2 can be observed in the XRD pattern of the Cu2O/CuF2 (Fig. 2a), the intensity of diffraction peaks is much lower than that in the Cu2O/GO/CuF2. Moreover, the peaks shift towards the direction of the big angle, suggesting that CuF2 could be incorporated into the lattice of Cu2O induced by GO.26 It is an important indication of the formation of heterojunctions.27 As a result, GO can promote the growth of CuF2 and the construction of the Cu2O/CuF2 heterostructure. It is consistent with the results in Fig. 1. Though the CuO phase can be observed in the HRTEM image of the Cu2O/GO/CuF2, it is hardly observed in the XRD pattern of the Cu2O/GO/CuF2. This indicates that the content of CuO is small. As the activity of CuO is lower than that of Cu2O under the same conditions,28 the small amount of CuO in the nanocomposite is ignored in the discussion of photocatalysis that follows.
According to the results in Fig. 1 and 2, the assembly mechanism of the Cu2O/GO/CuF2 composite system is proposed in Fig. 3. In the assembly process of the Cu2O/GO/CuF2 system, first, the carboxyl groups on the surface of the GO sheet can interact with hydroxyl groups on Cu2O, and thus GO is easily coated on the surface of Cu2O. After adjusting to pH = 3 with HCl aqueous solution, the GO on the Cu2O is protonated and positively charged. After NaF is introduced, the negatively charged fluoride ions can easily bond to the surface of the Cu2O/GO through electrostatic interaction, thus CuF2 is in situ grown on the Cu2O/GO. It further facilitates the interaction between components, especially, the interaction between Cu2O and CuF2, thereby the special Cu2O/GO/CuF2 nanocomposite is obtained. This will be further confirmed by the results in Fig. 4–6.
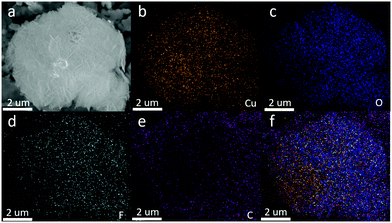 | ||
| Fig. 4 (a) Energy-filtered SEM image of the nanocomposite. Element maps: (b) Cu; (c) O; (d) F; (e) C and (f) overlying mapping of all elements. | ||
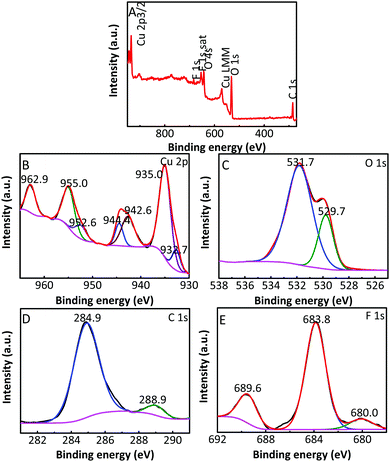 | ||
| Fig. 5 (A) Typical survey XPS of the Cu2O/GO/CuF2; high resolution XPS of (B) Cu 2p, (C) O 1s, (D) C 1s and (E) F 1s. | ||
3.2 The composition and interaction in the fabricated Cu2O/GO/CuF2 nanocomposite
The composition and element distribution of the composite were tested based on the region shown in Fig. 4a. It is observed that Cu, O, F and C elements are present in the composite (Fig. 4b–e), which is related to theoretical composition of the Cu2O/GO/CuF2 nanocomposite. In addition, the maps of Cu, O, F and C elements shown in Fig. 4(b–e) correspond to the SEM image shown in Fig. 4a. In particular, the distribution of F coincides well with that of the Cu. Additionally, C corresponds to GO, which indicates the presence of GO in the composite. According to the map of C, it shows that GO is mainly distributed at the periphery of the map. Furthermore, the map of F (representing CuF2) is in agreement with that of C (representing GO). This is indirect evidence for the formation of Cu2O/CuF2 heterojunction induced by GO. The result is consistent with that in Fig. 1.In order to study the composition and binding state of the prepared nanocomposite, XPS was measured (Fig. 5). From the survey spectrum (Fig. 5A), the peaks assigned to C, O, Cu and F elements are observed, which is in agreement with the elemental composition of the Cu2O/GO/CuF2 nanocomposite. From high resolution XPS image of Cu 2p (Fig. 5B), the binding energies at 932.7 eV and 952.6 eV are found to correspond to Cu 2p3/2 and Cu 2p1/2 of Cu+, respectively, indicating the presence of Cu+ in the composite.29 It is consistent with the characterizations of TEM image and XRD pattern. In addition, the shake-up peaks at 935.0 eV, 942.6 eV and 955.0 eV, and the satellite peaks at 944.4 and 962.9 eV attributed to the characteristic peaks of Cu2+ are observed,30 indicating that a small amount of CuO is present in the nanocomposite. It can be detected by XPS (Fig. 5B) and not by XRD (Fig. 2b), probably because XRD is a means of analyzing the structure of a material with lower sensitivity, while XPS can sensitively survey elemental composition on the surface of a material.23 Compared to the peak at 934.6 eV in pure Cu2O, the peak at 932.7 eV in the nanocomposite is shifted towards lower binding energy. It indicates that the electron density is enhanced in the nanocomposite, which is likely to obtain more photo-produced charges that can be excited in photocatalysis.31 In the case of the Cu2O/GO/CuF2 nanocomposite, the O 1s spectrum shows two peaks centered at 529.7 and 531.7 eV (Fig. 5C). The peak at 529.7 eV is due to the oxygen in the Cu2O crystal lattice.32 The peak at 531.7 eV is commonly ascribed to the surface oxygen complexes of carbon phase from GO.33 In the spectrum of C 1s (Fig. 5D), the asymmetrical C 1s peaks at about 284.9 and 288.9 eV suggest the co-existence of distinguishable models. The sharp peak located at 284.9 eV is attributed to sp2-hybridized carbons (C–C)34 while the relatively weak peak at 288.9 eV is ascribed to –COOH.35 In the spectrum of Fls (Fig. 5E), the peaks at 680.0 and 689.6 eV correspond to fluorine atoms, while the shoulder peak at 683.8 eV is assigned to CuF2.36 Compared to the pure Cu2O (529.9 eV) and CuF2 (684.5 eV), the binding energies for O 1s and F 1s are negatively shifted in the Cu2O/GO/CuF2. It indicates an increase of the electron density in Cu2O and CuF2, which is the result of the electron transfer from GO to Cu2O/CuF2.36–38 It is beneficial to improve the photocatalytic performance of the composite.
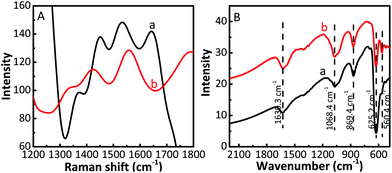
The Raman spectra and infrared spectra of the samples were measured at room temperature. Compared with bare Cu2O (Fig. S2A, ESI†), the Raman intensity of the Cu2O/CuF2 increases significantly, and all peaks are blue-shifted (Fig. 6A), indicating that the heterojunction has been successfully prepared.39 The Cu2O/GO/CuF2 shows two prominent peaks at approximately 1351 cm−1 and 1558 cm−1, corresponding to the D and G bands of GO, respectively. It further shows the presence of GO in the composite. The generation of the G band is because of the in-plane stretching motion of the symmetric sp2 C–C bond of GO, and the D band is related to the structural defects generated in the GO fragments during graphite exfoliation.40 Compared with the D band (about 1353 cm−1) and G band (about 1580 cm−1) of bare GO (Fig. S2A, ESI†), the two bands shift towards a low wavenumber. It is reported that the G band and the D band will move towards a low wavenumber when graphene is subjected to external interaction.39 In addition, charge doping and the change of Fermi level of graphene will also have a significant effect on its Raman characteristic peaks and the internal electron–phonon coupling.41 Therefore, it is suggested that there exists a strong interaction between Cu2O, GO and CuF2, which will have a great influence on the charge separation in the nanocomposite.
Additionally, in the FTIR of the samples (Fig. 6B and Fig. S2B, ESI†), the band at 869.1 cm−1 corresponding to the vibration of Cu–F can be observed in the FTIR spectrum of the Cu2O/GO/CuF2 (Fig. 6B), the vibration at 560.4 cm−1 can be designated as a Cu–O stretching vibration,42 and the band at 1068.4 cm−1 belonging to the vibration of O–Cu–F is also observed.43 However, the two bands are not observed in the spectra of the two comparisons (Fig. S2, ESI†). This is attributed to the formation of the Cu2O/GO/CuF2 nanocomposite. The result is in line with the results shown in Fig. 1–5.
3.3 Photocatalytic hydrogen evolution over the prepared nanocomposite
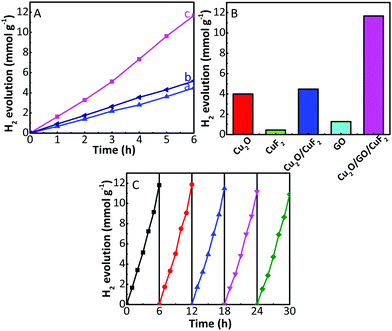
The photocatalytic activity and stability of the as-prepared samples were tested via photocatalytic hydrogen production with TEOA as a sacrificial agent and under the irradiation of a 300 W xenon lamp. As shown in Fig. 7A and Fig. S3 (ESI†), the samples can achieve steady hydrogen generation. The activity is in the order of CuF2 < GO < Cu2O ≈ Cu2O/CuF2 (simply mixed) (Fig. S3, ESI†) < Cu2O/GO < Cu2O/GO/CuF2 (simply mixed) < Cu2O/GO/CuF2 (Fig. 7A). In particular, compared with Cu2O/CuF2, the sample by directly mixing Cu2O, GO and CuF2 (denoted as Cu2O/GO/CuF2 (simply mixed)) only shows a slightly improved photocatalytic activity. In contrast, the Cu2O/GO/CuF2 heterostructure obtained via in situ growth shows a significantly enhanced photocatalytic activity (increased approximately 292.5%), which exceeds the rate of the Cu2O/GO/CuF2 (simply mixed) by more than two times. In addition, the hydrogen production over the Cu2O/GO/CuF2 composite is higher than the sum of Cu2O/CuF2 and GO (Fig. 7B). These results indicate that there exists a synergetic effect between Cu2O, CuF2 and GO. In particular, after the introduction of GO, the formation of the Cu2O/CuF2 heterojunction with special morphology, and increased CuF2 (Fig. 1 and 2) are both beneficial to improve the photocatalytic activity of the Cu2O/GO/CuF2.The reusability of photocatalysts is one of the most important factors to be considered in catalytic research and practical applications. Therefore, photocatalytic stability of the Cu2O/GO/CuF2 nanocomposite was investigated. Five cycles were carried out, and each cycle lasted for 6 h. Fig. 7C displays hydrogen production performance in each photocatalytic run. It is observed that the amount of hydrogen produced is almost unchanged in the first three cycles. After three consecutive usages for hydrogen evolution, the amount of hydrogen produced decreases slightly.
To investigate the reason for the slight decrease in hydrogen production after the third cycle, the photocatalyst was collected after five cycles, and its XRD pattern was obtained. Compared with the XRD of the as-prepared Cu2O/GO/CuF2, the (002), (−111), (−113) crystal planes corresponding to CuF2 were reduced while the (211) crystal plane of CuF2 at 2θ = 61.3° (JCPDS: 42-1244) was observed in the recycled Cu2O/GO/CuF2 (Fig. 8A). Moreover, the photocatalytic activity of the recycled Cu2O/GO/CuF2 is still higher than that of the other as-prepared comparisons, especially the as-prepared Cu2O/GO (Fig. 7A, B and Fig. S3, ESI†). Therefore, the slight decrease of hydrogen production in the third cycle could be attributed to the structural and crystalline changes of the CuF2 in the Cu2O/GO/CuF2. However, the changes have little effect on the activity of the nanocomposite.
In addition, in the XPS of the recycled Cu2O/GO/CuF2 (Fig. 8B), it is observed that the composition of the nanocomposite is unchanged compared with that of the as-prepared Cu2O/GO/CuF2 (Fig. 5A). In Fig. 8C, the binding energy of Cu 2p1/2 (at 950–957 eV) and Cu 2p3/2 (at 930–937 eV) are still attributed to those of Cu2+ and Cu+,30 and thus the valence state of Cu is hardly changed compared with those of the as-prepared sample (Fig. 5). The slight shift of the Cu 2p including O 1s peaks towards the low binding energy is observed, which can be attributed to the change of electron density around Cu and O.31 Besides, the peak of O 1s at 529.7 eV for the as-prepared Cu2O/GO/CuF2 is decreased, indicating that the content of O is reduced in the recycled Cu2O/GO/CuF2. Moreover, the peak of C 1s at 284.9 eV is divided into two peaks of 285.6 and 284.3 eV after recycling. In XPS spectrum of F 1s of the recycled Cu2O/GO/CuF2, the peaks at 689.0, 687.0, 684.1 and 680.3 eV belong to CuF2, while the peaks at 683.1 and 678.4 eV are attributed to fluorine atoms, and the peaks at 690.3 and 691.4 eV are assigned to C6F6.36,44 The result indicates that a small amount of C6F6 could be produced after several recycle runs. This was not observed in XRD images, probably due to the low crystallinity and small amount. Although a small amount of C6F6 could be generated during the recycle, the activity of the nanocomposite is changed little after five recycle runs. Therefore, it is concluded that the Cu2O/GO/CuF2 nanocomposite is a relatively stable photocatalyst.
3.4 Photocatalytic mechanism of the Cu2O/GO/CuF2 nanocomposite
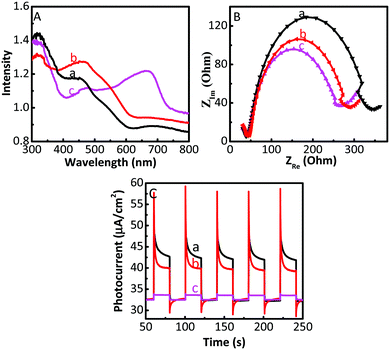
In order to analyse the reason for the enhanced activity of the Cu2O/GO/CuF2 photocatalyst, solid diffuse reflection spectra and electrochemical impedance spectra of samples are investigated. Fig. 9A shows the diffuse reflection spectra. An enhanced visible absorption is observed in the Cu2O/CuF2. Importantly, significant absorption is seen at about 675 nm in the Cu2O/GO/CuF2 composite, which is beneficial for enhancing the photocatalytic activity of the nanocomposite. Moreover, it shows a different spectrum and absorption edge from those of the Cu2O/CuF2, implying that some CuF2 could be incorporated into the Cu2O induced by GO. The close contact is very beneficial to improve the photocatalytic activity.It is known that the property of an interface has a close relationship with transfer efficiency of charges. Thus, investigating charge separation and transfer across the semiconductor interface is vital. Electrochemical impedance (EIS) is a powerful tool for exploring the charge transfer at the interface of materials. The arc radius of an impedance spectrum can represent the interfacial resistance, which can be used to demonstrate separation and transfer of charges. The smaller the radius of the arc, the easier the electron transfer, and generally, higher the photocatalytic activity. As shown in Fig. 9B, the order of the arc radius of the samples is Cu2O > Cu2O/CuF2 > Cu2O/GO/CuF2, thus the Cu2O/GO/CuF2 nanocomposite possesses the smallest interfacial resistance. It is deduced that the effective interaction arising from Cu2O, GO and CuF2 is responsible for the low interfacial resistance, which is helpful in promoting charge transfer and improving photocatalytic activity.
The photo-generated electron transfer was studied through the photocurrent spectra. As shown in Fig. 9C, under light conditions, the photocurrent response of the composites is lower than that of Cu2O. It is known that a photocurrent is formed because of the transition of photo-generated electrons to the underlying FTO through the grain boundaries of the composite coated on the electrode.45 In the Cu2O/GO or Cu2O/GO/CuF2 electrode, the electrons generated are transferred to FTO through a series of particle boundaries, and then are collected to produce the photocurrent. Although the light absorption of Cu2O/GO or Cu2O/GO/CuF2 is higher, the electrons that jump over the particle boundary in the electrode are trapped by GO, which reduces the photocurrent.45 That is, the GO layer on Cu2O is helpful for the interfacial electron transfer in the composite, but the retention of electrons in the GO reduces the photocurrent in the electrode systems.
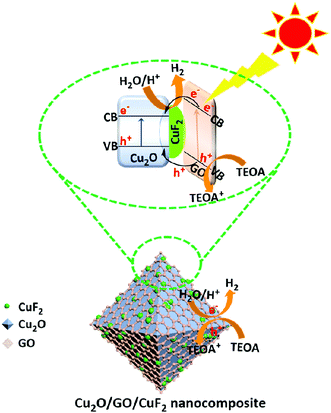
On the basis of the above experimental results, a possible photocatalytic mechanism is proposed (Scheme 2). It is known that the numbers of excited electrons at the interface between water and photocatalyst is critical to photocatalytic activity.46 In the Cu2O/GO/CuF2 nanocomposite, GO and Cu2O can both be excited according to their absorption spectra (not shown here) after irradiation, and thus more photo-generated electrons are produced. The conduction band level of Cu2O is lower than that of GO,47 so electrons can be transferred from GO to Cu2O/CuF2. Subsequently, e−/h+ is effectively separated on the special heterointerface between Cu2O and CuF2. After that, water molecules are reduced by the photo-produced electrons, and H2 is evolved. The holes are consumed by TEOA. In this case, an enhanced visible absorption (Fig. 6), strong synergetic effect between Cu2O, CuF2 and GO (Fig. 7), and decreased interfacial resistance from the special heterojunction (Fig. 9), result in a significant enhancement of photocatalytic activity in the Cu2O/GO/CuF2 nanocomposite.
4. Conclusions
Induced by GO, a special Cu2O/CuF2 heterojunction was fabricated in situ. It was found that GO can promote the formation of a uniform nanoflower-like Cu2O/CuF2 heterojunction, increase the crystalline of CuF2, and reduce the CuO phase with lower activity of hydrogen generation. Moreover, visible absorption and the separation of photogenerated electrons/holes can be effectively enhanced by fabricating the special heterojunction. Importantly, the photocatalytic activity of the Cu2O/GO/CuF2 nanocomposite increased by 260.4% and 139.6% compared to Cu2O/CuF2 and Cu2O/GO, respectively. It exceeded the rate of the Cu2O/GO/CuF2 (simply mixed) by more than two times. The photocatalytic mechanism showed that enhanced visible absorption, decreased interfacial resistance from the special heterojunction, and strong synergetic effect between Cu2O, CuF2 and GO, were all helpful to significantly improve the photocatalytic performance of the Cu2O/GO/CuF2 nanocomposite. Owing to the advantages of low cost and easy operation, the fabrication of the nanocomposite is expected to provide some ideas for preparing other semiconductor photocatalysts.Conflicts of interest
The authors declare that we have no known competing financial interests or personal relationships that could have appeared to influence the work reported in this paper.Acknowledgements
This work was financially supported by National Natural Science Foundation of China (No. 21771125, 21301118 and 21305092).References
- X. Guo, K. Hu, M. Chu, Y. Li, J. Bian, Y. Qu, X. Chu, F. Yang, Q. Zhao, C. Qin and L. Jing, ChemSusChem, 2020, 13, 3707–3717 CrossRef CAS.
- X. Wu, H. Ma, W. Zhong, J. Fan and H. Yu, Appl. Catal., B, 2020, 271, 1–8 Search PubMed.
- Y.-S. Chang, P.-Y. Hsieh, T.-F. Chang, C.-Y. Chen, M. Sone and Y.-J. Hsu, J. Mater. Chem. A, 2020, 8, 13971–13979 RSC.
- D. Ma, Z. Wang, J.-W. Shi, Y. Zou, Y. Lv, X. Ji, Z. Li, Y. Cheng and L. Wang, J. Mater. Chem. A, 2020, 8, 11031–11042 RSC.
- L. Pan, J. H. Kim, M. T. Mayer, M.-K. Son, A. Ummadisingu, J. S. Lee, A. Hagfeldt, J. Luo and M. Grätzel, Nat. Catal., 2018, 1, 412–420 CrossRef CAS.
- P. D. Tran, S. K. Batabyal, S. S. Pramana, J. Barber, L. H. Wong and S. C. Loo, Nanoscale, 2012, 4, 3875–3878 RSC.
- M. Mousavi-Kamazani, Z. Zarghami, R. Rahmatolahzadeh and M. Ramezani, Adv. Powder Technol., 2017, 28, 2078–2086 CrossRef CAS.
- Y.-H. Zhang, X.-L. Cai, Y.-L. Li, M.-M. Liu, C.-L. Ding, J.-L. Chen and S.-M. Fang, Chem. Phys. Lett., 2019, 734, 136748 CrossRef CAS.
- J. A. Aramburu and M. Moreno, Phys. Chem. Chem. Phys., 2019, 21, 11714–11723 RSC.
- C. Czekelius and E. Carreira, Org. Lett., 2004, 6, 4575–4577 CrossRef CAS.
- J. d elPozo, J. A. Casares and P. Espinet, Chem. – Eur. J., 2016, 22, 4274–4284 CrossRef.
- S. Zhu, Y. Zhang, X. Qian, X. Wang and W. Su, Appl. Surf. Sci., 2020, 504, 1–2 Search PubMed.
- D. Liu, S. Zhang, J. Wang, T. Peng and R. Li, ACS Appl. Mater. Interfaces, 2019, 11, 27913–27923 CrossRef CAS.
- C. Liu, Y. Yang, W. Li, J. Li, Y. Li, Q. Shi and Q. Chen, ACS Appl. Mater. Interfaces, 2015, 7, 10763–10770 CrossRef CAS.
- C. Liu, Y. Yang, W. Li, J. Li, Y. Li and Q. Chen, Sci. Rep., 2016, 6, 1–12 CrossRef CAS.
- C. Huang, Y. Li, N. Wang, Y. Xue, Z. Zuo and H. Liu, Chem. Rev., 2018, 118, 7744–7803 CrossRef CAS.
- Z. Zuo and Y. Li, Joule, 2017, 3, 899–907 CrossRef.
- L. Hui, Y. Xue, H. Yu, Y. Liu, Y. Fang and C. Xing, J. Am. Chem. Soc., 2019, 141, 10677–10683 CrossRef CAS.
- Y. Fang, Y. Xue, L. Hui, H. Yu and Y. Li, Angew. Chem., Int. Ed., 2020, 59, 2–7 CrossRef.
- H. Sun, S. Liu, S. Liu and S. Wang, Appl. Catal., B, 2014, 146, 162–168 CrossRef CAS.
- J. Yang, H. Miao, J. Jing, Y. Zhu and W. Choi, Appl. Catal., B, 2021, 281, 119547 CrossRef CAS.
- X. Pan and Z. Yi, ACS Appl. Mater. Interfaces, 2015, 7, 27167–27175 CrossRef CAS.
- Q. Lei, H. Song, X. Chen, M. Li, A. Li, B. Tang and D. Zhou, RSC Adv., 2016, 6, 40683–40690 RSC.
- R. Ge, X. Li, B. Zhuang, S.-Z. Kang, L. Qin and G. Li, Appl. Catal., B, 2017, 211, 296–304 CrossRef CAS.
- S. Gao, J. Zhang, W. Li, S. Jiao, Y. Nie, H. Fan, Z. Zeng, Q. Yu, J. Wang and X. Zhang, Chem. Phys. Lett., 2018, 692, 14–18 CrossRef CAS; J. Yu and J. Ran, Energy Environ. Sci., 2011, 4, 1364–1371 RSC.
- Q. Zhong, H. Y. Lan, M. M. Zhang, H. Zhu and M. Bu, Ceram. Int., 2020, 46, 12192–12199 CrossRef CAS.
- C. Qin, H. Li, J. Zhong, J. Li, S. Huang and L. Ma, Mater. Lett., 2021, 283, 128793–128796 CrossRef CAS.
- P. A. DeSario, C. L. Pitman, D. J. Delia, D. M. Driscoll, A. J. Maynes, J. R. Morris, A. M. Pennington, T. H. Brintlinger, D. R. Rolison and J. J. Pietron, Appl. Catal., B, 2019, 252, 205–213 CrossRef CAS.
- S. Joshi, S. J. Ippolito and M. V. Sunkara, RSC Adv., 2016, 6, 43672–43684 RSC.
- J. He, D. Shao, L. Zheng, L. Zheng, D. Feng and J. Xu, Appl. Catal., B, 2017, 203, 917–926 CrossRef CAS.
- F. Wang, Y. Zhao, F. Feng, C. Li, F. Cao and W. Shangguan, J. Alloys Compd., 2016, 688, 632–638 CrossRef CAS.
- M. Chi, X. Sun, A. Sujan, Z. Davis and B. J. Tatarchuk, Fuel, 2019, 238, 454–461 CrossRef CAS.
- J. Zhang, J. Jiang and X. S. Zhao, J. Phys. Chem. C, 2011, 115, 6448–6454 CrossRef CAS.
- R. Al-Gaashani, A. Najjar, Y. Zakaria, S. Mansour and M. A. Atieh, Ceram. Int., 2019, 45, 14439–14448 CrossRef CAS.
- H.-S. Jang, J.-M. Yun, D.-Y. Kim, D.-W. Park, S.-I. Na and S.-S. Kim, Electrochim. Acta, 2012, 81, 301–307 CrossRef CAS.
- J. Zhu, J. Sun, S. Tian, J. Yang, J. Feng and Y. Xiong, Environ. Sci.: Nano, 2020, 7, 2723–2734 RSC.
- Z. Zhang, L. Sun, Z. Wu, Y. Liu and S. Li, New J. Chem., 2020, 44, 6420–6427 RSC.
- J. Wu, P. Huang, H. Fan, G. Wang and W. Liu, ACS Appl. Mater. Interfaces, 2020, 12, 30304–30312 CrossRef CAS.
- Z. Ni, T. Yu, Y. Lu, Y. Wang, Y. Feng and Z. Shen, ACS Nano, 2008, 2, 2301–2305 CrossRef CAS.
- F. Berrellez-Reyes and S. Alvarez-Garcia, J. Phys. Chem. C, 2019, 123, 30021–30027 CrossRef CAS.
- J. Yan, Y. Zhang, P. Kim and A. Pinczuk, Phys. Rev. Lett., 2007, 98, 166802 CrossRef.
- N. Saima, S. Shamaila, A. K. L. Sajjad, A. Ishaq and M. Tariq, Mater. Res. Express, 2019, 6, 1–15 Search PubMed.
- G. Giester and E. Libowitzky, Z. Kristallogr., 2003, 218, 351–356 CAS.
- B. Mei, K. Han and G. Mu, ACS Catal., 2018, 8, 9154–9164 CrossRef CAS.
- Y. Park, S. Kang and W. Choi, Phys. Chem. Chem. Phys., 2011, 13, 9425–9431 RSC.
- Z. H. Ye, G. E. M. Schukraft, A. L'Hermitte, Y. Xiong, E. Brillas, C. Petit and I. Sirés, Water Res., 2020, 184, 115986 CrossRef CAS.
- P. Wang, M. Xi, S. Kang, L. Qin, G. Li and X. Li, Int. J. Hydrogen Energy, 2020, 45, 6508–6518 CrossRef CAS.
Footnote |
| † Electronic supplementary information (ESI) available. See DOI: 10.1039/d0ma00961j |
| This journal is © The Royal Society of Chemistry 2021 |

