 Open Access Article
Promotion effects of PrPO4 for the hydrogenation transformation of biomass-derived compounds over Pr–Ni–P composites
Ya-Fang
Zhang†
,
Ben
Dai†
,
Dan
Zhao
 *,
Di-Hui
Zhang
,
Meng-Xing
Xu
,
Xiang-Hua
He
and
Chao
Chen
 *
*
Key Laboratory of Jiangxi Province for Environment and Energy Catalysis, College of Chemistry, Nanchang University, Nanchang, Jiangxi 330031, China. E-mail: zhaodan@ncu.edu.cn; chaochen@ncu.edu.cn; Tel: +86-15879176996 Tel: +86-15179167359
First published on 30th April 2021
Abstract
To span the inherent application limitation of state-of-the-art catalysts for the chemical transformation of biomass derivatives, here, we formulate a series of Pr–Ni–P catalysts for the hydrogenation transformation of biomass-derived levulinic-acid, furfural and maleic anhydride. With comprehensive characterizations, Pr–Ni–P samples are verified as (PrPO4)m/Ni2P nanocomposites with a molar ratio (m) in the range of 0.24–11.0. In comparison with the poor catalytic performance of Ni2P, a ten-fold enhancement in TOF up to 0.45 s−1 and at least five-time promotion on the yield of objective products up to 91–98% are achieved by introducing proper amounts of PrPO4 to form reusable (PrPO4)m/Ni2P nanocomposites. Surface chemistry and kinetic mechanism studies further disclose that the cooperative catalytic function of two components, in particular the exclusive capability of PrPO4 to activate hydrogen, is responsible for the promoted hydrogenation transformation of biomass derivatives via a quick Langmuir–Hinshelwood process over (PrPO4)m/Ni2P. These findings imply that an easily obtainable, cost-affordable and robust rare earth phosphate like present PrPO4 could be a potential replacement catalytic component for the traditional metal catalyst in the hydrogenation transformation reactions of biomass derivatives, which was also worth noting as a new kind of basic material for other green mass-transformation techniques involving hydrogen activation processes such as corresponding optical and electrical transformations.
1. Introduction
As one of the most promising resources to replace fossil reserves for the sustainable production of fuels and chemicals, biomass, in particular plant-based materials and corresponding chemical transformations, has gained persistent interest for both academic research and industrial applications.1,2 The raw materials from plant biomass including cellulose, hemi-cellulose and lignin cannot be directly used, and hence, pretreatment involving an acid-catalyzed hydration process is always necessary for acquiring a great deal of platform compounds, which are mostly in the form of C3–C6 oxygen-containing hydrocarbon molecules such as levulinic-acid, furfural and maleic-anhydride. Therefore, the meaningful biomass application has been focused on producing value-added chemicals from these platform compounds. In the field, an efficient and reliable catalytic system is essential for implementing chemical transformations;3–6 however, there has been still a big gap between the application requirement and the developed catalytic systems.In the chemical reaction network raised from the biomass platform molecules, hydrogenation transformations such as the hydrogenation of levulinic-acid (LA) to gamma-valerolactone (GVL), hydrogenation of furfural (FAL) to furfuryl alcohol (FOH) and hydrogenation esterification of maleic anhydride (MA) to diethyl succinate (DES) could be the most popular or primary pathways since a large proportion of biomass derivatives contain unsaturated C![[double bond, length as m-dash]](https://www.rsc.org/images/entities/char_e001.gif) O or C
O or C![[double bond, length as m-dash]](https://www.rsc.org/images/entities/char_e001.gif) C bonds. Based on the reality, metal catalysts have stayed at the center of the reaction network till now, in virtue of the exclusive ability of metal sites to activate reactants in particular to activate hydrogen.5–7 A wide range of metals has been applied to the chemical transformation of some typical biomass platform compounds. Nobel metals such as Pt, Pd, and Ru have been testified to be efficient and stable catalysts for the hydrogenation transformations of levulinic acid and furfural under relatively mild conditions.6–9 Considering the cost limitation of precious metals for scaled-up applications, some researchers paid attention to cheap transition metal catalysts such as Cu, Co and Ni,10–16 and attractive catalytic performance over the deliberately fabricated metallic catalysts mostly in fashion of diverse nanostructures was reported in the literature. For example, Liu et al. prepared a Ni-embedded hierarchically porous carbon catalyst for the hydrogenation of LA to GVL,17 and the exquisite design of protecting highly dispersed Ni nanoparticles in carbon coverage prevented the Ni leakage in the reaction mixture and maintained the catalytic performance in reuse processes. These reports indicate that the state-of-the-art catalysts composed of mainly metallic components are promising for the chemical transformation of biomass derivatives; however, some inherent defects from the metallic nature of the catalytic transformation of biomass should also be carefully considered when extending the discovery into application. First, for transition metal catalysts, their surfaces are highly corrosive in the liquid reaction mixture, particularly when acidic substrates such as levulinic acid are present, which could lead to the severe leakage of the metal and quick deterioration in performance,11–15,18,19 greatly limiting the application of such catalysts. In addition, there are more than one unsaturated bond in some biomass platform molecules, which means that the selective hydrogenation of the definite bond is crucial for the application of these molecules, with furfural hydrogenation as an example, ensuring that the ideal selectivity to the objective product of furfuryl alcohol is highly desirable in industries,20,21 but it could still be a challengeable task even if using precious metal catalysts, since the metallic surface is prone to be equally functional for the hydrogenation of C
C bonds. Based on the reality, metal catalysts have stayed at the center of the reaction network till now, in virtue of the exclusive ability of metal sites to activate reactants in particular to activate hydrogen.5–7 A wide range of metals has been applied to the chemical transformation of some typical biomass platform compounds. Nobel metals such as Pt, Pd, and Ru have been testified to be efficient and stable catalysts for the hydrogenation transformations of levulinic acid and furfural under relatively mild conditions.6–9 Considering the cost limitation of precious metals for scaled-up applications, some researchers paid attention to cheap transition metal catalysts such as Cu, Co and Ni,10–16 and attractive catalytic performance over the deliberately fabricated metallic catalysts mostly in fashion of diverse nanostructures was reported in the literature. For example, Liu et al. prepared a Ni-embedded hierarchically porous carbon catalyst for the hydrogenation of LA to GVL,17 and the exquisite design of protecting highly dispersed Ni nanoparticles in carbon coverage prevented the Ni leakage in the reaction mixture and maintained the catalytic performance in reuse processes. These reports indicate that the state-of-the-art catalysts composed of mainly metallic components are promising for the chemical transformation of biomass derivatives; however, some inherent defects from the metallic nature of the catalytic transformation of biomass should also be carefully considered when extending the discovery into application. First, for transition metal catalysts, their surfaces are highly corrosive in the liquid reaction mixture, particularly when acidic substrates such as levulinic acid are present, which could lead to the severe leakage of the metal and quick deterioration in performance,11–15,18,19 greatly limiting the application of such catalysts. In addition, there are more than one unsaturated bond in some biomass platform molecules, which means that the selective hydrogenation of the definite bond is crucial for the application of these molecules, with furfural hydrogenation as an example, ensuring that the ideal selectivity to the objective product of furfuryl alcohol is highly desirable in industries,20,21 but it could still be a challengeable task even if using precious metal catalysts, since the metallic surface is prone to be equally functional for the hydrogenation of C![[double bond, length as m-dash]](https://www.rsc.org/images/entities/char_e001.gif) C on the ring and C
C on the ring and C![[double bond, length as m-dash]](https://www.rsc.org/images/entities/char_e001.gif) O on the branch.8,9
O on the branch.8,9
In view of defects of metal catalysts, we attempted to employ intermetallic compounds such as metal phosphide (M2P, M = Ni or Co) as hydrogenation catalysts,22,23 in consideration of the following interesting features of the compound. First, although metal phosphide is a kind of covalent compound with a metal component in the oxidized state, the compound could present properties analogous to metal alloys in both structure and catalytic performance;24,25 second, the cost-affordable compound could be more robust to bear the corrosion in the liquid reaction system than its metallic counterpart.22,23 Unfortunately, it were testified that the isolated M2P catalysts were not efficient for liquid hydrogenation reactions, for instance, when using Co2P for hydrogenation of levulinic acid, the desired gamma-valerolactone was just produced in low yields due to the poor capability of phosphide to activate hydrogen.23 However, when introducing Ce to fabricate Ce–Co–P composites, it was discovered that the ability of CePO4 to chemically activate hydrogen is comparable to the metal surface, which made the decisive contribution in improving the catalytic efficiency on composites.22,23 Recently, Wang et al. have also found that CePO4/Ni3P could act as an efficient and durable heterogeneous catalyst for hydrodeoxygenation of phenol and hydrogen-transferring transformation of biomass derivatives in a liquid environment.26,27 These findings prompt us to suppose that the composites consisting of rare earth, metal and phosphorus could be a kind of potential catalyst to span the defects of metallic structures for the chemical transformation of biomass-derived compounds. Along the expectation, in this work, we formulated a series of Pr–Ni–P composites to investigate their catalytic performance and the corresponding origin for hydrogenation transformation of typical biomass derivatives such as levulinic acid, furfural and maleic anhydride.
2. Experimental
2.1 Materials
Nickel(II) nitrate, diammonium hydrogen phosphate and γ-valerolactone (GVL) were purchased from Sinopharm Chemical Reagent Co., Ltd. Praseodymium(III) nitrate and levulinic acid (LA) were procured from Aladdin Reagent Co., Ltd. Furfural (FAL), furfuryl alcohol (FOH), maleic anhydride (MA) and diethyl succinate (DES) were obtained from Innochem Reagent Co., Ltd. All commercial chemical reagents used were of analytical grade and used directly without further purification.2.2 Preparation of catalysts
Samples with different Pr/Ni molar ratios were prepared from a one-pot solvothermal synthesis system. Briefly, nickel (Ni) nitrate and praseodymium (Pr) nitrate at different molar ratios were dissolved in deionized water, and then the aqueous solution of diammonium hydrogen phosphate (0.2 mol L−1) was added dropwise into the above mixture. After the solution was mixed well for 30 min at a stirring speed of 800 rpm, the solution was transferred into a hydrothermal kettle treatment system to react at 180 °C for 24 h. Then, the system is naturally cooled down to room temperature, and the precipitation in the reaction system was separated by centrifugation, washed and dried at 60 °C for 12 h to obtain the precursor. The obtained precursor was calcined at 600 °C in air for 4 h and successively reduced for 2 h under hydrogen flow at a rate of 50 mL min−1 to acquire the catalyst sample. For characterizations and catalytic measurements, the precursor was treated according to the thermal reduction procedure to get a fresh catalyst for investigation. As reference catalysts, Pr–P and Ni–P samples were also prepared following the same preparation procedure.2.3 Characterizations
The actual compositions of metal components (Pr and Ni) in catalyst samples were determined by the ICP-OES analysis of the aqua regia solution, which completely dissolves all parts of the catalyst, using an Agilent Technologies 5100 ICP-OES (inductively coupled plasma-optical emission spectrometer) apparatus.A Micromeritics ASAP 2020 analyzer was used to carry out the Brunauer–Emmett–Teller (BET) method for determining the specific surface area of the samples.
Powder diffraction (XRD) patterns of the samples were performed using a Persee XD-3 X-ray diffractometer with Cu Kα (1.5406 A) as the radiation source. The samples were scanned at a rate of 2° min−1 in the angle (2θ) range of 5–90°.
X-ray photoelectron spectroscopy measurements (XPS) of the samples were analyzed using an Axis Ultra DLD Electron-Spectrometer equipped with a monochromatic Al Kα source (hν = 1486.6 eV). The C 1s peak of adventitious carbon at 284.5 eV was referred to rectify the binding energy in the XPS spectra.
Transmission electron microscopic (TEM) images of samples were acquired using a JEOL JEM-2100 microscope configurated with an energy-dispersive X-ray spectroscopic analyzer operating at an accelerating voltage of 200 kV. The samples were sonicated in hydrous ethanol, and then, the suspended sample was dropped onto a carbon film-coated 400 mesh copper grid and dried.
Temperature-programmed desorption of H2 and LA [H2-TPD and LA-TPD] was carried out using a Micromeritic-Auto-Chem II 2920 chemisorption analyzer equipped with a thermal conductivity detector and a computer-controlled furnace. Prior to measurement, approximately 50 mg of fresh catalyst was placed in a U-shaped quartz tube for pretreatment at 400 °C for 60 min in pure argon (30 mL min−1) to exclude the possibly adsorbed air components on the fresh sample during the transferring process. For H2-TPD measurements, the system was cooled to room temperature under the protection of argon and saturated under a flow of H2 (30 mL min−1) for 60 min, and then pure argon was switched into the system again to exclude free adsorbates for 30 min. Subsequently, the sample was heated to 300 °C at a heating rate of 10 °C min−1 and desorption signals were monitored by TCD. For LA-TPD measurements, the LA steam at 100 °C balanced by pure argon (30 mL min−1) was bubbled into the system for 60 min. Then, the system was blown by pure argon (30 mL min−1) until the system was cooled to 50 °C. The temperature was raised at a heating rate of 10 °C min−1 and TCD signals were recorded simultaneously.
2.4 Catalytic measurements
The catalytic hydrogenation transformation reactions such as hydrogenation of levulinic acid (LA) to gamma-valerolactone (GVL), hydrogenation of furfural (FAL) to furfuryl alcohol (FOH) and hydrogenation esterification of maleic anhydride (MA) to diethyl succinate (DES) were all performed at 353–393 K under 3.0–5.0 MPa H2 flow in a 50 mL Teflon reactor with a stainless-steel autoclave heater equipped with a liquid-sampling device. According to the typical compositions of the reaction mixture employed in literature works,28–34 the initial compositions of three reaction systems were set as follows: for the LA reaction system, the mixture contained 2 mmol LA, 100 mg catalyst and 10 mL deionized water; for the FAL reaction, the mixture was composed of 1 mmol FAL, 100 mg catalyst and 20 mL isopropanol; for MA reaction, the solution contained 5 mmol MA, 50 mg catalyst and 10 mL ethyl alcohol. Prior to the reaction, the system was purged 3–5 times with H2 to exclude air and kept under stirring at a speed of 800 rpm, and then reaction condition was carefully manipulated to the desired pressure (3.0, 4.0 or 5.0 MPa) and temperature (353, 373 or 393 K). After the reaction condition was raised to the set value, the composition change of the reaction solution with time was recorded and analyzed by a gas chromatograph [GC 7820A, equipping a flame ionization detector and an Agilent 19091J-413 capillary column (DB-WAX, 30 m × 320 μm × 0.25 μm)] and a gas chromatograph mass spectrometry [GC-MS 7890B-5977A, equipping a Agilent 19091S-433 capillary column (HP-5MS, 30 m × 250 μm × 0.25 μm)]. The conversion of the reactant and the yield of objective product were simultaneously analyzed according to the standard composition curves, and the average result from more than three repeat measurements was recorded in plots.3. Results and discussion
3.1 Composition and structure of catalysts
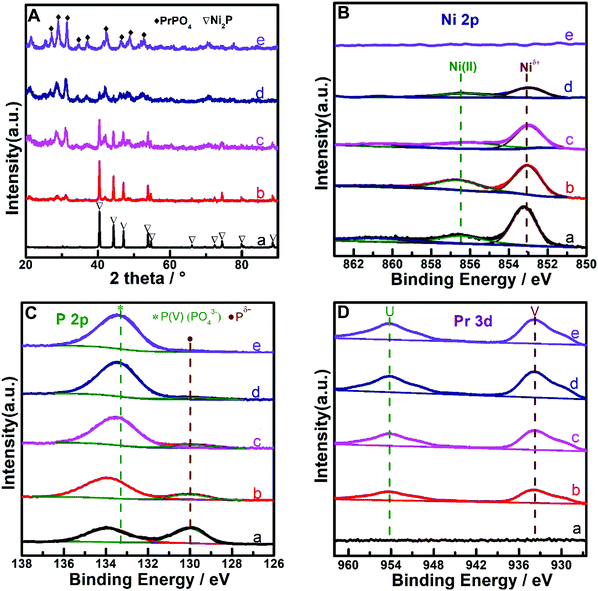
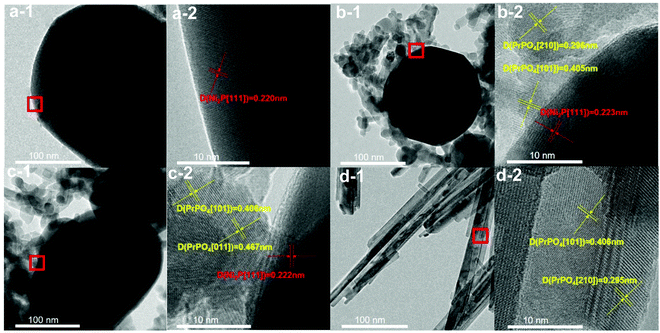
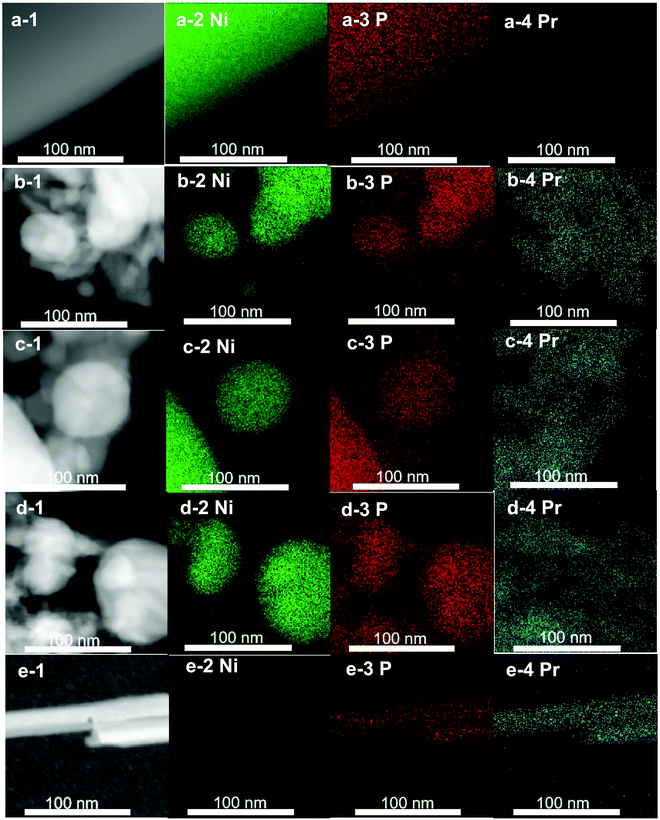
The metal compositions of the prepared Pr–Ni–P samples were measured by ICP-OES, and the Pr/Ni molar ratio range of 0.12–5.5 for five samples was clarified. With Ni–P and Pr–P as references, three Pr–Ni–P samples with Pr/Ni molar ratios of 0.12, 0.95 and 5.5 were selected as representative samples and analyzed by XRD and XPS measurements, as shown in Fig. 1. In Fig. 1A, distinct diffractions of Ni2P (PDF cards No. #03-0953) and PrPO4 (PDF cards No. #32-0885) crystalline were resolved on Ni–P and Pr–P samples, respectively; by increasing Pr/Ni ratio, both Ni2P and PrPO4 phases were observed with a gradual intensity increase in PrPO4 diffractions among Pr–Ni–P samples, suggesting that Pr–Ni–P samples were mainly composed of combined crystalline of PrPO4–Ni2P. In the following XPS spectra of samples given in Fig. 1B–D, the main peak around 853.2 eV marked as Niδ+ in the Ni 2p spectra (Fig. 1B) and the peak at 130.0 eV marked as Pδ− in the P 2p spectra (Fig. 1C) appeared simultaneously for Ni-containing samples, and the co-existence of Niδ+ and Pδ− photo emissions was always attributed to the surface properties of Ni phosphide;35,36 meanwhile, all Pr-containing samples showed two peaks located around 934.0 eV and 954.0 eV in Fig. 1D, which belonged to Pr(III) 3d photoemissions.37,38 As expected, the signals for Pr(III) peaks became intense with the increase in Pr composition among Pr–Ni–P samples. Interestingly, the P(V) peak around 133.6 eV pertinent to the PO43− group39,40 (Fig. 1C) also showed the same trend of change, which indicated that the Pr(III) species could combine with PO43− to form PrPO4 on the surface layers of Pr–Ni–P samples. These XPS analysis results are in accordance with the findings on the PrPO4–Ni2P crystalline feature for Pr–Ni–P samples recognized by XRD measurements; moreover, linking all of XPS spectra, the relative composition of Pr to Ni on the surface is much higher than that in the body, suggesting that the Ni2P surface was gradually covered by PrPO4 to from the PrPO4/Ni2P composite structure among Pr–Ni–P samples. In addition, besides Niδ+ species for phosphide, the Ni(II) species in minor proportions were found on the surface of Ni–P and Pr–Ni–P samples. Although the samples were previously reduced in H2 atmosphere, they would be inevitably exposed in air during the delivery process to measurements, and hence, the Ni2P component could suffer from oxidation and leave the Ni(II) species on surface.24,41The morphological feature of Pr–Ni–P samples refers to that of Pr–P and Ni–P, which was disclosed by TEM measurements, as shown in Fig. 2 and 3. In Fig. 2, the Ni–P sample are shown as dark particles of size 200–400 nm with a smooth projection edge; in contrast, the Pr–P sample is arranged as packed nanorods and two representative Pr–Ni–P samples as particle aggregations, in which the big particles of size around 120 nm were surrounded by nanoparticles of size ca. 20 nm. In high-resolution TEM images, the big dark particles observed in Ni–P and Pr–Ni–P samples were clarified as Ni2P[111] crystalline with a characteristic diffraction d-space around 0.222 nm ([Ni2P]-PDF#03-0953); in contrast, the nanoparticles in Pr–Ni–P samples showed feature d-spaces around 0.296 nm, 0.406 nm and 0.467 nm, which were close to the typical [210], [101] and [011] diffraction planes of PrPO4 crystalline ([PrPO4]-PDF#32-0885) observed on the Pr–P sample. With the elemental distribution map shown in Fig. 3, it was also observed that Ni was concentrated within the range of big particles, and Pr was well dispersed on the areas surrounding these big particles for Pr–Ni–P samples. These images further confirmed the results from the previous XRD and XPS measurements that the prepared Pr–Ni–P catalysts were verified as PrPO4/Ni2P nanocomposites. According to the resolved Pr:Ni ratio of 0.12–5.5, Pr–Ni–P catalysts can be readily denoted as (PrPO4)m/Ni2P, in which m presents the molar ratio between two components in the range of 0.24–11.0.
3.2 Catalytic performance of catalysts
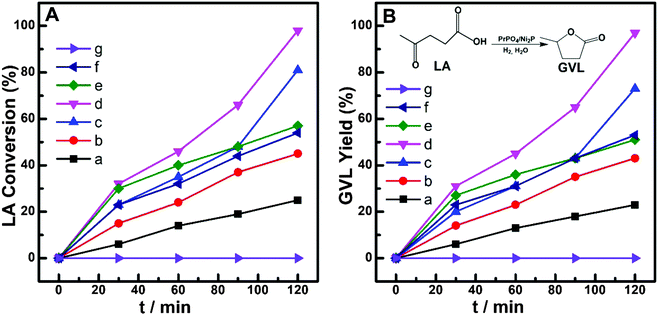
Considering that the corrosive effect of the acid reactant would greatly depress the application potential of Ni-containing catalysts,11–15 we employed levulinic acid (LA) as the primary reactant to investigate the catalytic hydrogenation performance of prepared catalysts in this work. Fig. 4 shows the dependences of LA conversion and gamma-valerolactone (GVL) yield on the reaction time over (PrPO4)m/Ni2P, PrPO4 and Ni2P catalysts. During the reaction time of 120 min, PrPO4 showed insignificant activity in view of almost unchanged LA concentration and the absence of GVL in the reaction mixture; over Ni2P, not more than 25% LA were converted into the objective product of GVL. In contrast, the obvious increase in both LA conversion and GVL yield from 40% to 97% was exhibited on (PrPO4)m/Ni2P catalysts. By modulating the molar ratio m of two components among five (PrPO4)m/Ni2P catalysts, the highest LA conversion and GVL yield beyond 95% were achieved on (PrPO4)1.9/Ni2P; for other (PrPO4)m/Ni2P samples, the GVL yield also increased proportionally with LA conversion by prolonging the reaction time, and the almost-quantitative yield of GVL with a superior selectivity above 95% for all (PrPO4)m/Ni2P samples can be resolved. These results indicated that the hydrogenation reactivity on the (PrPO4)m/Ni2P catalyst was obviously enhanced by the introduction of PrPO4 in view of the poor performance of isolated Ni2P.Considering that the hydrogenation reactivity of the catalyst was directly dependent on its ability to activate hydrogen, we employed H2-TPD measurements to clarify the feature of current catalysts, and the profiles are given in Fig. 5. In comparison with the nearly flat line observed on Ni2P, all of three typical (PrPO4)m/Ni2P catalysts showed an obvious H-desorption peak around 70 °C similar to the peak of the PrPO4 sample; the contrasting result clearly indicated that PrPO4 was the key component responsible for activating hydrogen in (PrPO4)m/Ni2P catalysts. As known, the area of the H-desorption peak from the H2-TPD profile is always employed to calculate the number of active sites for hydrogenation reactions using a known Pt-based catalyst as the calibrating sample.22,23,42,43 The widely accepted method is based on the assumption that actively adsorbed H atoms on the active site for a given catalyst would follow the quantitative ratio of 1![[thin space (1/6-em)]](https://www.rsc.org/images/entities/char_2009.gif) :
:![[thin space (1/6-em)]](https://www.rsc.org/images/entities/char_2009.gif) 1 between the H atom and the site analogous to the Pt catalyst, and hence, the essence of the method is to calibrate out the active site comparable with the Pt site for the given catalyst. In our case, although the real H2 activation process on (PrPO4)m/Ni2P and PrPO4, particularly its similarity or difference from the process on metal catalysts (as pointed out by a reviewer), still needs to be clarified from more experiment measurements or theory simulations in future, it could not hamper us to calibrate the H2 activation site comparable with the Pt site on (PrPO4)m/Ni2P and PrPO4 similarly to the literature works, and hence, the amount of desorbed H atoms or the numbers of active sites on our typical catalysts were also estimated by the method. In addition, it should be pointed out that the metal active site in an oxidized state (being not functional to raise the H-adsorption–desorption signal) should be previously reduced and then measured by the above-mentioned H2-TPD method, for the Ni-based compound. The method is the widely accepted and most reliable one to determine the Ni site on the surface; but for Ni2P, the method is not practical, as Ni2P is difficult to be reduced even with pure H2 to treat under 873 K for 4 h, and hence, we had to measure the site number of Ni2P by calibrating its specific area to the surface molecular density of Ni2P crystalline.22 The resolved numbers of active sites, taken together with other feature parameters such as crystallite size (from XRD), specific surface area (from BET tests), metal element surface distributions (Pr/Ni molar ratio determined by XPS measurements) and GVL yield for samples, are presented in Table 1.
1 between the H atom and the site analogous to the Pt catalyst, and hence, the essence of the method is to calibrate out the active site comparable with the Pt site for the given catalyst. In our case, although the real H2 activation process on (PrPO4)m/Ni2P and PrPO4, particularly its similarity or difference from the process on metal catalysts (as pointed out by a reviewer), still needs to be clarified from more experiment measurements or theory simulations in future, it could not hamper us to calibrate the H2 activation site comparable with the Pt site on (PrPO4)m/Ni2P and PrPO4 similarly to the literature works, and hence, the amount of desorbed H atoms or the numbers of active sites on our typical catalysts were also estimated by the method. In addition, it should be pointed out that the metal active site in an oxidized state (being not functional to raise the H-adsorption–desorption signal) should be previously reduced and then measured by the above-mentioned H2-TPD method, for the Ni-based compound. The method is the widely accepted and most reliable one to determine the Ni site on the surface; but for Ni2P, the method is not practical, as Ni2P is difficult to be reduced even with pure H2 to treat under 873 K for 4 h, and hence, we had to measure the site number of Ni2P by calibrating its specific area to the surface molecular density of Ni2P crystalline.22 The resolved numbers of active sites, taken together with other feature parameters such as crystallite size (from XRD), specific surface area (from BET tests), metal element surface distributions (Pr/Ni molar ratio determined by XPS measurements) and GVL yield for samples, are presented in Table 1.
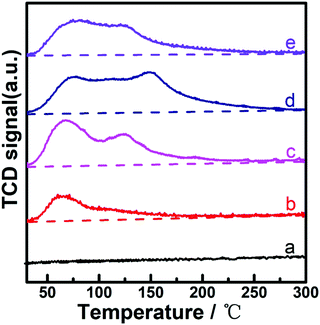 | ||
| Fig. 5 H2-TPD profiles of catalysts. a. Ni2P; b. (PrPO4)0.24/Ni2P; c. (PrPO4)1.9/Ni2P; d. (PrPO4)11/Ni2P; e. PrPO4. | ||
| Catalysts | PrPO4 crystallite sizea (nm) | Ni2P crystallite sizea (nm) | Surface area (m2 g−1) | Surface composition (Pr:Ni) | H desorption amount (μmol gcat.−1) | GVL yield (%) | TOFb (s−1) |
|---|---|---|---|---|---|---|---|
| a PrPO4 and Ni2P crystallite size were calculated from XRD spectra using Scherrer equation. b Turnover frequency (TOF) values over (PrPO4)m/Ni2P were resolved as the initial reaction rate (LA conversion within 10%) calibrated by active site number (determined by H desorption amount) on every sample;42–46 for Ni2P, the TOF was calculated as the initial reaction rate calibrated by the surface molecule number of Ni2P crystalline;22 the values in blanket are calculated with the rate constant k obtained from kinetic fitting measurements. | |||||||
| Ni2P | — | 41.8 | 10 | — | 0 | 22 | 0.04(0.02) |
| (PrPO4)0.24/Ni2P | 10.8 | 38.2 | 36 | 0.6 | 31 | 41 | 0.26 |
| (PrPO4)1.9/Ni2P | 12.1 | 34.6 | 66 | 3.3 | 106 | 95 | 0.45(0.42) |
| (PrPO4)11/Ni2P | 13.9 | 31.1 | 92 | 14.1 | 238 | 52 | 0.10 |
| PrPO4 | 18.5 | — | 58 | — | 113 | 0 | 0 |
As disclosed, the amount of desorbed H atoms showed a positive dependence on the increase in the molar surface distribution of PrPO4 among (PrPO4)m/Ni2P catalysts, further confirming that PrPO4 was the decisive component to activate hydrogen. With the analysis, the intrinsic activity presented as the turnover frequency (TOF) number can be estimated by calibrating the initial reaction rate to the active site number determined from H-desorption signals.44–46 In our case, because of the operation complexity of the high-pressure reactor, as the closest moment to the zero moment of the reaction, we had to have a delay for about 3 min after the reaction temperature reached the setting point to measure the first data. Notably, the observed values of LA conversion at the moment were not more than 3% for all samples, and such small values suggested that the conversion of LA during the temperature raising process can be ignored in our reaction systems. With the observation as baseline, considering that the values of initial reaction rate were widely accepted as the instant or average rate of reaction with low conversion of around 10% in reports,44–46 we followed the way to resolve TOF numbers over the present catalysts, and the numbers are also listed in Table 1. Interestingly, the (PrPO4)m/Ni2P catalyst with manipulated m at 1.9 would achieve a ten-fold enhancement in activity (TOF: 0.45 s−1) versus isolated Ni2P (TOF: 0.04 s−1), which further confirmed the outstanding promotion effect of PrPO4. The contrast result was analogous to the finding in our previous work,23 in which a higher TOF of 0.61 s−1 over (CePO4)m/Co2P versus 0.15 s−1 over Co2P was resolved for the hydrogenation of LA, in view of the TOF enhancement factor to isolated metal phosphide [11(0.45/0.04) versus 4 (0.61/0.15)], which implied that PrPO4 could be more efficient than CePO4 as the promotion component for liquid hydrogenation reactions. Linking with other parameters in Table 1, one may question that the difference in the crystallite size or specific area among (PrPO4)m/Ni2P and reference samples could be responsible for their observed difference in performance. Indeed, both PrPO4 and Ni2P phases in (PrPO4)m/Ni2P samples showed a slight decrease in tendency in the values of the crystallite size compared with the numbers of isolated PrPO4 and Ni2P reference catalysts, which could be the reason for the observed increase in specific area among the (PrPO4)m/Ni2P samples by increasing the PrPO4 composition. As known, the decrease in crystallite size or the increase in specific area of catalysts could greatly enhance the catalytic performance; however, in our case, the expectation was not true for (PrPO4)m/Ni2P samples, for instance, (PrPO4)11/Ni2P was not the best sample in view of GVL yields though the sample had the largest specific area among samples. In addition, the differences in crystallite sizes for both phases between (PrPO4)m/Ni2P and single component samples are in the low level not more than 10 nm; therefore, it is reasonable to believe that the difference in crystallite size or specific area is not the responsible factor to lead to the performance gap among the present catalysts.
A further comparison of the catalytic performance of the (PrPO4)m/Ni2P catalyst relative to the performance of the state-of-the-art catalysts is given in Table 2. In view of that the Ni-containing catalysts in this work were employed in a high-pressure liquid hydrogenation system, and that the reaction conditions particularly H2 pressure played important roles in not only governing the performance of reaction, but also determining the feasibility of application, we mainly collected reported Ni-based catalysts for the reaction under H2 pressure in 1.5–5.0 MPa as comparison ref. 10, 13, 15, 17 and 47–52. For further understanding the performance difference between Ni-based catalysts and precious metal catalysts, we also listed the parameters of some precious metal catalysts in the table.53–57 As shown, Ni2P itself exhibited the poor catalytic performance in view of the low level of GVL yield among Ni-based catalysts; however, with the combination of PrPO4 to form (PrPO4)0.24–11/Ni2P, the obvious enhancement in GVL yields up to the close level of reported Ni-based catalysts (93–100%) was achieved under moderate H2 pressure and a relatively lower temperature or shorter period, and such performance was even comparable with that of precious metal catalysts, indicating that the present cost-affordable (PrPO4)m/Ni2P catalysts could act as a kind of competitive candidate catalyst for hydrogenation of LA to GVL in virtue of the distinct promotion effect of PrPO4.
| Catalysts | P (H2) | T (°) | t (h) | Yield (%) | Ref. |
|---|---|---|---|---|---|
| Pd/SiO2 | H2 (9.0 MPa) | 180 °C | 6 h | 96.5 | 55 |
| Ru0.9Ni0.1–OMC | H2 (4.5 MPa) | 150 °C | 2 h | 94 | 56 |
| Ru/OMS | H2 (3.0 MPa) | 100 °C | 1 h | 99.8 | 53 |
| Ru/Zr-BDC | H2 (3.0 MPa) | 90 °C | 1 h | 100 | 57 |
| Pt40@Meso-SiO2 | H2 (1.0 MPa) | 150 °C | 5 h | 100 | 54 |
| Ni–MoOx/C | H2 (5.0 MPa) | 250 °C | 24 h | 99 | 10 |
| Ni/Al2O3 | H2 (5.0 MPa) | 200 °C | 4 h | 92 | 47 |
| Ni/Al-LDH | H2 (4.0 MPa) | 200 °C | 6 h | 100 | 13 |
| Ni-Sn(1.4)/AlOH | H2 (4.0 MPa) | 120 °C | 2 h | 100 | 15 |
| Ni/HZSM-5 | H2 (3.0 MPa) | 220 °C | 10 h | 93.1 | 48 |
| Ni-Cu/Al2O3 | H2 (3.0 MPa) | 220 °C | 0.5 h | >99 | 49 |
| Ni(0)@boehmite | H2 (3.0 MPa) | 200 °C | 6 h | 100 | 13 |
| Ni@NCMs | H2 (3.0 MPa) | 200 °C | 4 h | 99 | 17 |
| Ni/MgO–Al2O3 | H2 (3.0 MPa) | 160 °C | 1 h | 99.7 | 50 |
| Ni/MgO-N | H2 (2.0 MPa) | 150 °C | 2 h | 93.3 | 51 |
| Ni/SiO2–Al2O3 | H2 (1.5 MPa) | 200 °C | 0.5 h | 100 | 52 |
| Ni2P | H2 (4.0 MPa) | 100 °C | 2 h | 23 | This work |
| (PrPO4)0.24–11/Ni2P | H2 (4.0 MPa) | 100 °C | 2 h | 41–95 | |
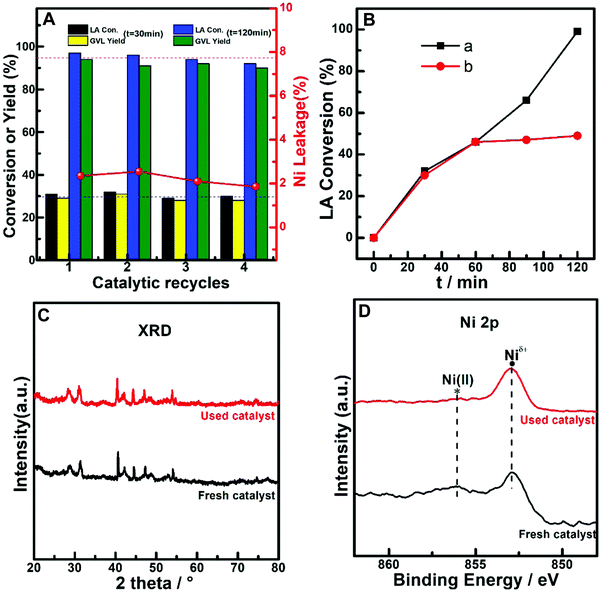
As the reaction mixture for the hydrogenation of LA is an acidic aqueous solution, the leakage of metals from acid-corrosion should be carefully considered when estimating the application potential of the catalytic system for the reaction.11–15,58,59 Here, (PrPO4)1.9/Ni2P was subjected to successive catalytic reuse tests, while the metal leakage particularly the Ni ion concentration in liquid was monitored by ICP-OES analysis during the reuse process. As shown in Fig. 6A, both LA conversion and GVL yield were kept at almost constant level from the low conversion stage (t = 30 min) to the high conversion stage (t = 120 min) during four catalytic cycles; simultaneously, a small Ni leakage around 2% was resolved from the reaction solutions of cycle runs. The possible influence of the Ni leakage on the reaction performance was further investigated by filtration comparison experiments, as shown in Fig. 6B. In contrast to the continuous increase in LA conversion for the reaction solution containing the catalyst during the whole reaction period, the reaction immediately suspended once the catalyst was filtered out of the reaction solution, indicating that even Ni could leak and stay in the reaction solution, and the contribution of the resolved Ni species to reaction performance was not evident. These results indicated that the leakage of Ni on the (PrPO4)1.9/Ni2P catalyst was not significant and the corresponding influence on catalytic performance could be ignored. In addition, the XRD patterns and Ni 2p XPS spectra of fresh and reused (PrPO4)1.9/Ni2P samples were compared (Fig. 6C and D), and the almost unchanged signals of the two samples further confirmed that both the body and the surface of (PrPO4)m/Ni2P catalysts were robust to undergo the catalytic reuse processes even when the catalysts were used in a harsh acid-corrosive environment. As far as the small leakage of Ni found in the reaction solution, the leakage could be attributed to the dissolved Ni(II) species from the Ni2P surface that was evidenced by previous XPS measurements (Fig. 1).
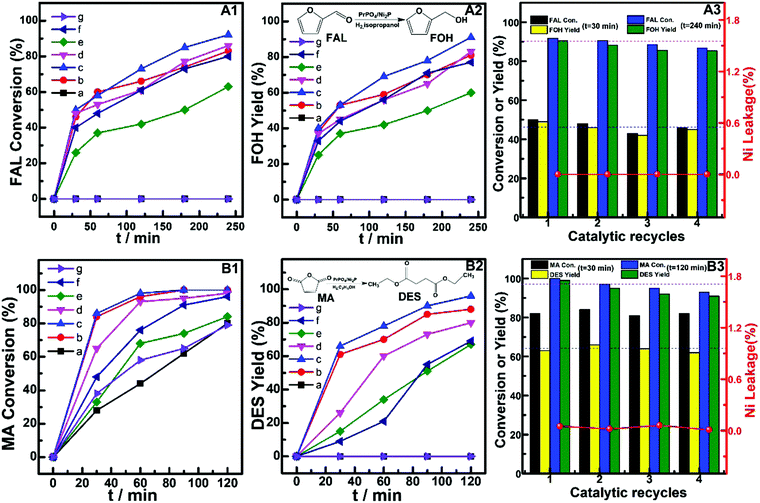
The potentials of (PrPO4)m/Ni2P catalysts for hydrogenation transformation of other biomass-derived platform molecules were further investigated by employing furfural (FAL) and maleic anhydride (MA) as reactants. The typical catalytic performances are shown in Fig. 7. In Fig. 7A1–A3, for hydrogenation of FAL to furfuryl alcohol (FOH), both the single-component catalysts PrPO4 and Ni2P showed insignificant FAL conversion during a reaction period of 240 min. Distinctly, the considerable FAL conversion of 61–92% and FOH yield of 59–91% were achieved on (PrPO4)m/Ni2P catalysts. On (PrPO4)0.66/Ni2P with the best catalytic performance among (PrPO4)m/Ni2P catalysts, both FAL conversion and FOH yield exhibited slight fluctuations from low conversion stage (t = 30 min) to high conversion stage (t = 240 min) during four successive cycle runs; meanwhile, there were not evident metal leakage found from the reaction solutions of cycle runs. These results indicated that (PrPO4)m/Ni2P composites could also act as efficient and robust catalysts for hydrogenation of FAL to FOH. Fig. 7B1–B3 shows the catalytic performance for hydrogenation esterification of MA to diethyl succinate (DES). As shown, the similar final MA conversion during a reaction period of 120 min up to 80% was observed on PrPO4 and Ni2P catalysts; however, no significant yield of objective hydrogenation esterification product DES was observed on two reference catalysts, instead of DES, and only unsaturated esterification product (diethyl fumarate, DEF) was present in two reaction systems. In contrast, the quick conversion of MA up to 100% within 60 min and the final DES yield as high as 98% (when reaction performed for 120 min) were achieved on (PrPO4)m/Ni2P catalysts by manipulating m at 0.66. Furthermore, the superior catalytic performance of (PrPO4)0.66/Ni2P would reappear during four catalytic runs (Fig. 7B3), and the metal leakages were almost absent in all of reaction solutions from cycle runs, and these results indicated that the (PrPO4)m/Ni2P composite with a properly manipulated component composition was also advanced for hydrogenation esterification of MA in view of the superior catalytic performance and good reusability.
In general, the superior catalytic performance of (PrPO4)m/Ni2P composite catalysts compared with Ni2P was clearly demonstrated via three typical hydrogenation transformation reactions, and the dramatic promotion effect of PrPO4 was evident not only on enhancing the yields of objective products, but also on speeding up the transformation process. To further clarify the catalytic origin of (PrPO4)m/Ni2P composites, we performed the kinetic and corresponding mechanism measurements, as explained in the following section.
3.3 Kinetic measurements and mechanism screen
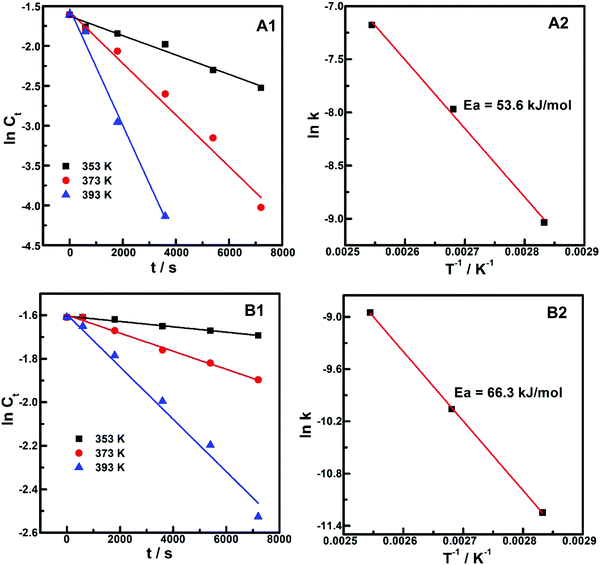
Considering that hydrogenation and chain-ring transformation were the typical processes or steps during the chemical transformation of biomass-derived platform molecules, and that these processes were simultaneously involved in hydrogen of LA to GVL, the reaction was chosen as a typical system for the investigation of kinetics and mechanism features of (PrPO4)m/Ni2P catalysts. First, the temperature effect (by altering reaction temperature to 353, 373 and 393 K) and corresponding kinetic data were measured, as shown in Fig. 8. It was resolved that ln Ct (Ct: LA concentration) correlated well with the reaction time (t) in linear relations at every employed reaction temperature on (PrPO4)1.9/Ni2P and Ni2P samples (Fig. 8A1 and B1), indicating that the dependences of the reaction rate on LA concentration over two catalysts all could follow a pseudo-first-order kinetic process.60,61 From the kinetic lines in Fig. 8A1, the reaction rate constant k on (PrPO4)1.9/Ni2P can be directly recognized as the slope of the linear ln Ct–t correlation, then ln![[thin space (1/6-em)]](https://www.rsc.org/images/entities/char_2009.gif) k was fitted with the reciprocal of the reaction temperature (T−1) according to the Arrhenius equation in Fig. 8A2, and the well-fitted linear dependence was acquired to resolve 53.6 kJ mol−1 as the apparent reaction activation energy (Ea) for (PrPO4)1.9/Ni2P. Following the same procedure, the Arrhenius correlation on Ni2P was also resolved, as given in Fig. 8B2, in which, the Ea value for Ni2P was estimated as 66.3 kJ mol−1. In view of the obvious quenched Ea value on (PrPO4)1.9/Ni2P compared with Ni2P, much higher TOF was obtained on (PrPO4)1.9/Ni2P, as expected. In addition, with the resolved rate constant k on (PrPO4)1.9/Ni2P and Ni2P, the TOF values on two samples were re-estimated and given in Table 1. Taking (PrPO4)1.9/Ni2P as the example, the calculated value of 0.42 s−1 was very close to the experimental value of 0.45 s−1, suggesting that the precision of the above-mentioned curve fitting measurements was at an acceptable level.
k was fitted with the reciprocal of the reaction temperature (T−1) according to the Arrhenius equation in Fig. 8A2, and the well-fitted linear dependence was acquired to resolve 53.6 kJ mol−1 as the apparent reaction activation energy (Ea) for (PrPO4)1.9/Ni2P. Following the same procedure, the Arrhenius correlation on Ni2P was also resolved, as given in Fig. 8B2, in which, the Ea value for Ni2P was estimated as 66.3 kJ mol−1. In view of the obvious quenched Ea value on (PrPO4)1.9/Ni2P compared with Ni2P, much higher TOF was obtained on (PrPO4)1.9/Ni2P, as expected. In addition, with the resolved rate constant k on (PrPO4)1.9/Ni2P and Ni2P, the TOF values on two samples were re-estimated and given in Table 1. Taking (PrPO4)1.9/Ni2P as the example, the calculated value of 0.42 s−1 was very close to the experimental value of 0.45 s−1, suggesting that the precision of the above-mentioned curve fitting measurements was at an acceptable level.
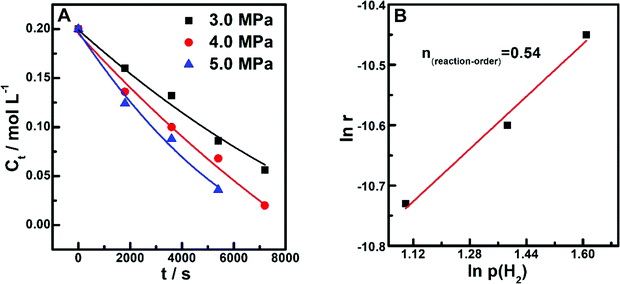
Besides temperature, the influence of H2 pressure on reaction properties was also investigated on (PrPO4)1.9/Ni2P. By manipulating the H2 pressure [P(H2)] at 3.0, 4.0 and 5.0 MPa, the dependences of LA concentration on reaction time were collected, as shown in Fig. 9A; from these curves, the correlation between ln![[thin space (1/6-em)]](https://www.rsc.org/images/entities/char_2009.gif) r (r: reaction rate) and ln
r (r: reaction rate) and ln![[thin space (1/6-em)]](https://www.rsc.org/images/entities/char_2009.gif) P(H2) was fitted in Fig. 9B; It can be found that a linear dependence was resolved, upon the line; the reaction order n for H2 pressure was estimated as 0.54. According to the above-mentioned kinetic measurements, the experimental reaction rate equation was determined as r = k·[LA]·[H2]0.54.
P(H2) was fitted in Fig. 9B; It can be found that a linear dependence was resolved, upon the line; the reaction order n for H2 pressure was estimated as 0.54. According to the above-mentioned kinetic measurements, the experimental reaction rate equation was determined as r = k·[LA]·[H2]0.54.
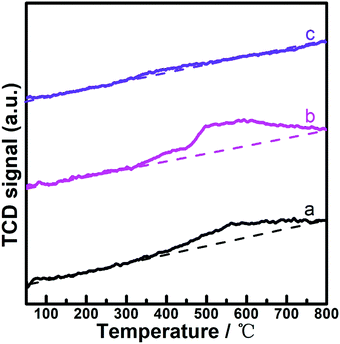
From the reaction rate equation, it was suggested that the reaction behaviors for the hydrogenation of LA on the (PrPO4)m/Ni2P surface could be conjunctively governed by the interactions between the catalyst surface and both of reactants, LA and H2. As disclosed by previous H2-TPD files (Fig. 5), PrPO4 was the essential component to activate H2, to clarify the interaction between the catalyst and LA, LA-TPD measurements were carried on Ni2P, (PrPO4)1.9/Ni2P and PrPO4 catalysts, as shown in Fig. 10. In comparison with the slightly varied baseline-like signal on PrPO4, the obvious desorption peaks calibrated with the similar baseline appeared on Ni2P and (PrPO4)1.9/Ni2P catalyst, and the result clearly indicated that LA was mainly activated by the Ni2P surface rather than PrPO4; in other words, the function of Ni2P surface is to activate LA.
In view of the different role of PrPO4 and Ni2P components for catalytic hydrogenation of LA, a Langmuir–Hinshelwood mechanism involving the following elemental steps was speculated for the reaction process on the (PrPO4)m/Ni2P composite catalyst, in which M represents the active site of the PrPO4 component to activate H2 and N denotes the Ni2P site to activate LA.
| H2 + 2 M ⇔ 2 H-M | (1) |
| LA + N ⇔ LA-N | (2) |
| H-M + LA-N ⇒ HLA-N + M | (3) |
| HLA-N + H-M ⇔ GVL-N + M + H2O | (4) |
| GVL-N ⇔ GVL + N | (5) |
By assuming the elemental reaction (3) as the rate-determining step,62,63 the general reaction rate equation could be expressed as r = k3·[LA-N]·[H-M] (k3 is the rate constant of step (3)). According to the equilibrium states of reaction (1) and (2), [H-M] and [LA-N] would be directly resolved using the following equations:
| [H-M] = K10.5·[H2]0.5·[M] (K1: the equilibrium constant of step (1)) |
| [LA-N] = K2·[LA]·[N] (K2: the equilibrium constant of step (2)) |
Thus, the general reaction rate equation can be transformed to r = k·[LA]·[H2]0.5 (k = k3 K10.5·K2·[M]·[N]). The deduced rate equation was close to that resolved from experimental measurements, so the Langmuir–Hinshelwood mechanism could be a reasonable pathway for the hydrogenation of LA to GVL on the (PrPO4)m/Ni2P composite structure, in which H2 and LA were respectively adsorbed-activated on PrPO4 and Ni2P to facilitate a quick hydrogen transformation of LA to GVL. The analysis also implied that the low reaction speed and poor conversion of LA observed on isolated Ni2P could be attributed to its poor ability to activate hydrogen although Ni2P is alive to activate LA; once it was combined with PrPO4, an efficient transformation of LA to GVL in virtue of the unique capacity of PrPO4 to activate hydrogen became sound on (PrPO4)m/Ni2P since a quick Langmuir–Hinshelwood process would present and greatly facilitate the transformation. As a result of such kinetic-mechanism behavior on (PrPO4)m/Ni2P, the exposed surface for two components in a proper ratio allocated by the component composition (m) was another factor to optimize the reaction performance, and this could be the reason for the difference in catalytic performance observed on (PrPO4)m/Ni2P by manipulating m.
With the above-mentioned characterizations and analyses, it was demonstrated that the robust and cost-affordable (PrPO4)m/Ni2P nanocomposite was worth noting as an efficient and universal catalyst for sustainable chemical transformation of biomass derivatives, in which the capability of PrPO4 to activate H2 and corresponding promotion effect for hydrogenation reactions could be an notable reference for designing novel non-metallic materials in hydrogen-involved applications.
4. Conclusions
A series of Pr–Ni–P catalysts in PrPO4/Ni2P nanocomposite structures were testified to be efficient, reusable and general catalysts for hydrogenation transformations of representative biomass derivatives. The catalysis advance of the composite is mainly dependent on the unique capability of PrPO4 to activate hydrogen; with the introduction of PrPO4 in appropriate amounts, dramatic promotions in both yield of objective product and speed of transformation compared with Ni2P were achieved on PrPO4/Ni2P nanocomposites. The findings verified that rare-earth phosphates like PrPO4 could be potential replacement components to conventional metal components for hydrogenation reactions, with a view that such salts could have peculiar optical and electrical properties, and the corresponding applications, particularly other mass-transformation green techniques such as optical or electrical transformations involving hydrogen, on the mimic rare-earth compounds were also worthy of expectation.Conflicts of interest
There are no conflicts of interest to declare.Acknowledgements
This work was financially supported by the National Natural Science Foundation of China (NSFC, No. 21563018, No. 21663016 and No. 22062014).References
- C. Somerville, H. Youngs, C. Taylor, S. C. Davis and S. P. Long, Science, 2010, 329, 790–792 CrossRef CAS PubMed.
- Y. Roman-Leshkov, C. J. Barrett, Z. Y. Liu and J. A. Dumesic, Nature, 2007, 447, 982–985 CrossRef CAS PubMed.
- L. T. Mika, E. Csefalvay and A. Nemeth, Chem. Rev., 2018, 118, 505–613 CrossRef CAS PubMed.
- E. Mahmoud, D. A. Watson and R. F. Lobo, Green Chem., 2014, 16, 167–175 RSC.
- K. Yan, C. Jarvis, J. Gu and Y. Yan, Renewable Sustainable Energy Rev., 2015, 51, 986–997 CrossRef CAS.
- X. Zhang, K. Wilson and A. F. Lee, Chem. Rev., 2016, 116, 12328–12368 CrossRef CAS PubMed.
- K. Dhanalaxmi, R. Singuru, S. Mondal, L. Bai, B. M. Reddy, A. Bhaumik and J. Mondal, ACS Sustainable Chem. Eng., 2016, 5, 1033–1045 CrossRef.
- L. Liu, H. Lou and M. Chen, Appl. Catal., A, 2018, 550, 1–10 CrossRef CAS.
- P. de Souza, L. Silvester, A. da Silva, C. Fernandes, T. Rodrigues, S. Paul, P. Camargo and R. Wojcieszak, Catalysts, 2019, 9, 132 CrossRef.
- K.-i. Shimizu, S. Kanno and K. Kon, Green Chem., 2014, 16, 3899–3903 RSC.
- A. M. Hengne and C. V. Rode, Green Chem., 2012, 14, 1064–1072 RSC.
- L. Zhang, J. Mao, S. Li, J. Yin, X. Sun, X. Guo, C. Song and J. Zhou, Appl. Catal., B, 2018, 232, 1–10 CrossRef CAS.
- S. Gundekari and K. Srinivasan, Catal. Commun., 2017, 102, 40–43 CrossRef CAS.
- G. B. Kasar, N. S. Date, P. N. Bhosale and C. V. Rode, Energy Fuels, 2018, 32, 6887–6900 CrossRef CAS.
- R. Rodiansono, M. D. Astuti, T. Hara, N. Ichikuni and S. Shimazu, Catal. Sci. Technol., 2016, 6, 2955–2961 RSC.
- K. Yan and A. Chen, Energy, 2013, 58, 357–363 CrossRef CAS.
- D. Liu, L. Zhang, W. Han, M. Tang, L. Zhou, Y. Zhang, X. Li, Z. Qin and H. Yang, Chem. Eng. J., 2019, 369, 386–393 CrossRef CAS.
- Z. Yu, X. Lu, J. Xiong and N. Ji, ChemSusChem, 2019, 12, 3915–3930 CrossRef CAS PubMed.
- R. Weng, Z. Yu, J. Xiong and X. Lu, Green Chem., 2020, 22, 3013–3027 RSC.
- Y. Nakagawa, M. Tamura and K. Tomishige, ACS Catal., 2013, 3, 2655–2668 CrossRef CAS.
- S. Chen, R. Wojcieszak, F. Dumeignil, E. Marceau and S. Royer, Chem. Rev., 2018, 118, 11023–11117 CrossRef CAS PubMed.
- J.-J. Shi, H.-J. Feng, C.-L. Qv, D. Zhao, S.-G. Hong and N. Zhang, Appl. Catal., A, 2018, 561, 127–136 CrossRef CAS.
- H.-J. Feng, X.-C. Li, H. Qian, Y.-F. Zhang, D.-H. Zhang, D. Zhao, S.-G. Hong and N. Zhang, Green Chem., 2019, 21, 1743–1756 RSC.
- S. Tian, X. Li, A. Wang, R. Prins, Y. Chen and Y. Hu, Angew. Chem., Int. Ed., 2016, 55, 4030–4034 CrossRef CAS PubMed.
- S. T. Oyama, J. Catal., 2003, 216, 343–352 CrossRef CAS.
- Z. Yu, F. Meng, Y. Wang, Z. Sun, Y. Liu, C. Shi, W. Wang and A. Wang, Ind. Eng. Chem. Res., 2020, 59, 7416–7425 CrossRef CAS.
- Z. Yu, Y. Wang, S. Liu, Y. Yao, Z. Sun, X. Li, Y. Liu, W. Wang, A. Wang, D. M. Camaioni and J. A. Lercher, Ind. Eng. Chem. Res., 2018, 57, 10216–10225 CrossRef CAS.
- S. Song, S. Yao, J. Cao, L. Di, G. Wu, N. Guan and L. Li, Appl. Catal., B, 2017, 217, 115–124 CrossRef CAS.
- Q. Xu, X. Li, T. Pan, C. Yu, J. Deng, Q. Guo and Y. Fu, Green Chem., 2016, 18, 1287–1294 RSC.
- X. Huang, K. Liu, W. L. Vrijburg, X. Ouyang, A. I. Dugulan, Y. Liu, M. W. G. M. T. Verhoeven, N. A. Kosinov, E. A. Pidko and E. J. M. Hensen, Appl. Catal., B, 2020, 278, 119314 CrossRef CAS.
- Z.-X. Li, X.-Y. Wei, Z. Yang, J. Li, W.-W. Yan, L.-L. Bie, Y.-Y. Zhang, S. Li and Z.-M. Zong, Mol. Catal., 2020, 492, 111007 CrossRef CAS.
- X. Meng, Y. Yang, L. Chen, M. Xu, X. Zhang and M. Wei, ACS Catal., 2019, 9, 4226–4235 CrossRef CAS.
- S. Nandi, A. Saha, P. Patel, N. H. Khan, R. I. Kureshy and A. B. Panda, ACS Appl. Mater. Interfaces, 2018, 10, 24480–24490 CrossRef CAS PubMed.
- D. Gao, H. Yin, A. Wang, L. Shen and S. Liu, J. Ind. Eng. Chem., 2015, 26, 322–332 CrossRef CAS.
- C. An, Y. Wang, Y. Wang, G. Liu, L. Li, F. Qiu, Y. Xu, L. Jiao and H. Yuan, RSC Adv., 2013, 3, 4628–4633 RSC.
- J. Li, Y. Chai, B. Liu, Y. Wu, X. Li, Z. Tang, Y. Liu and C. Liu, Appl. Catal., A, 2014, 469, 434–441 CrossRef CAS.
- J. Gurgul, M. T. Rinke, I. Schellenberg and R. Pöttgen, Solid State Sci., 2013, 17, 122–127 CrossRef CAS.
- R. Krishnan, H. C. Swart, J. Thirumalai and P. Kumar, Appl. Surf. Sci., 2019, 488, 783–790 CrossRef CAS.
- X. Lan, E. J. M. Hensen and T. Weber, Catal. Today, 2017, 292, 121–132 CrossRef CAS.
- Y. Li, Z. Jin, H. Wang, Y. Zhang and H. Liu, J. Colloid Interface Sci., 2019, 537, 629–639 CrossRef CAS PubMed.
- J. A. Cecilia, A. Infantes-Molina, J. Sanmartín-Donoso, E. Rodríguez-Aguado, D. Ballesteros-Plata and E. Rodríguez-Castellón, Catal. Sci. Technol., 2016, 6, 7323–7333 RSC.
- X. Han, R. Zhou, B. Yue and X. Zheng, Catal. Lett., 2006, 109, 157–161 CrossRef CAS.
- O. A. Yakovina and A. S. Lisitsyn, Langmuir, 2016, 32, 12013–12021 CrossRef CAS PubMed.
- T. J. Schwartz, S. D. Lyman, A. H. Motagamwala, M. A. Mellmer and J. A. Dumesic, ACS Catal., 2016, 6, 2047–2054 CrossRef CAS.
- W. Qian, L. Lin, Y. Qiao, X. Zhao, Z. Xu, H. Gong, D. Li, M. Chen, R. Huang and Z. Hou, Appl. Catal., A, 2019, 585, 117183 CrossRef CAS.
- S. Wei, Y. Zhao, G. Fan, L. Yang and F. Li, Chem. Eng. J., 2017, 322, 234–245 CrossRef CAS.
- K. Hengst, M. Schubert, H. W. P. Carvalho, C. Lu, W. Kleist and J.-D. Grunwaldt, Appl. Catal., A, 2015, 502, 18–26 CrossRef CAS.
- Z. Yi, D. Hu, H. Xu, Z. Wu, M. Zhang and K. Yan, Fuel, 2020, 259, 116208 CrossRef CAS.
- M. N. Gebresillase, R. Q. Raguindin, H. Kim and J. G. Seo, Catalysts, 2020, 10, 1354 CrossRef CAS.
- K. Jiang, D. Sheng, Z. Zhang, J. Fu, Z. Hou and X. Lu, Catal. Today, 2016, 274, 55–59 CrossRef CAS.
- J. Lv, Z. Rong, Y. Wang, J. Xiu, Y. Wang and J. Qu, RSC Adv., 2015, 5, 72037–72045 RSC.
- S. Gundekari and K. Srinivasan, Catal. Lett., 2018, 149, 215–227 CrossRef.
- J. Molleti, M. S. Tiwari and G. D. Yadav, Chem. Eng. J., 2018, 334, 2488–2499 CrossRef CAS.
- M. Nemanashi, J.-H. Noh and R. Meijboom, Appl. Catal., A, 2018, 550, 77–89 CrossRef CAS.
- K. Yan, T. Lafleur, G. Wu, J. Liao, C. Ceng and X. Xie, Appl. Catal., A, 2013, 468, 52–58 CrossRef CAS.
- Y. Yang, G. Gao, X. Zhang and F. Li, ACS Catal., 2014, 4, 1419–1425 CrossRef CAS.
- X. Zhang, P. Zhang, C. Chen, J. Zhang, G. Yang, L. Zheng, J. Zhang and B. Han, Green Chem., 2019, 21, 54–58 RSC.
- H. Wang, C. Chen, H. Zhang, G. Wang and H. Zhao, Chin. J. Catal., 2018, 39, 1599–1607 CrossRef CAS.
- R. Wang, L. Chen, X. Zhang, Q. Zhang, Y. Li, C. Wang and L. Ma, RSC Adv., 2018, 8, 40989–40995 RSC.
- M. Chalid, A. A. Broekhuis and H. J. Heeres, J. Mol. Catal. A: Chem., 2011, 341, 14–21 CrossRef CAS.
- J. Tan, J. Cui, X. Cui, T. Deng, X. Li, Y. Zhu and Y. Li, ACS Catal., 2015, 5, 7379–7384 CrossRef CAS.
- A. B. Jain and P. D. Vaidya, Can. J. Chem. Eng., 2016, 94, 2364–2372 CrossRef CAS.
- O. A. Abdelrahman, A. Heyden and J. Q. Bond, ACS Catal., 2014, 4, 1171–1181 CrossRef CAS.
Footnote |
| † These authors contribute equally. |
| This journal is © The Royal Society of Chemistry 2021 |

