 Open Access Article
Engineering a light-driven cyanine based molecular rotor to enhance the sensitivity towards a viscous medium†
Vishal
Kachwal
a,
Abhilasha
Srivastava
b,
Sumukh
Thakar
b,
Maria
Zubiria-Ulacia
 c,
Diplesh
Gautam
d,
Syamantak
Majumder
b,
Venkatesh
K. P.
 d,
David
Casanova
 c,
Rajdeep
Chowdhury
b,
Nigam
Rath
e,
Sudeshna
Mukherjee
*b,
Pere
Alemany
 *f and
Inamur Rahaman
Laskar
 *a
*a
aDepartment of Chemistry, BITS Pilani, Pilani Campus, Rajasthan, India. E-mail: ir_laskar@pilani.bits-pilani.ac.in
bDepartment of Biological Science, BITS Pilani, Pilani Campus, Rajasthan, India. E-mail: sudeshna@pilani.bits-pilani.ac.in
cDonostia International Physics Center (DIPC) and Universidad del País Vas co/Euskal Herriko Unibertsitatea (UPV/EHU), Donostia, Euskadi, Spain
dDepartment of Mechanical Engineering, BITS Pilani, Pilani Campus, Rajasthan, India
eDepartment of Chemistry and Biochemistry and the Centre for Nanoscience, University of Missouri-St. Louis, USA
fDepartment de Ciència de Materials i Química Física and Institut de Química Teòrica I Computacional (IQTCUB), Universität de Barcelona, Barcelona, Spain. E-mail: p.alemany@ub.edu
First published on 9th June 2021
Abstract
This article describes the enhanced sensitivity to a viscous medium by a molecular rotor based fluorophore (RBF), TPSI I. The TPSI I molecule is designed in such a way that it consists of a rotor and a fluorophore with a π-rich bridge between them. TPSI I is a light-responsive material in solution as well as in the solid state. The structural design of the molecule allows flexible rotation and photo-induced cis–trans isomerization both in the solid state as well as in solution. These combined attributes of TPSI I are responsible for the ultrasensitive viscosity response of the new material, which was verified through the Förster–Hoffmann equation. According to this equation, the derived ‘x’ value is 1.02 (x is related to the sensitivity) which is the highest among the contemporary reports for RBFs. The facts were evidenced both by experimental as well as theoretical data. The ultrasensitivity towards viscosity was further analyzed in in vitro studies by detecting the subtle changes in the alteration of intracellular viscosity in normal and cancerous cells. An alteration of intracellular viscosity in cells treated with viscosity modulators was also confirmed using a previously well-established viscosity measurement technique, dynamic measurement through the piezoelectric patch. Our research offers a detailed mechanism to improve viscosity sensors and an efficient probe for detecting minute changes in intracellular viscosity.
Introduction
In recent years, studies on the consequences of intracellular viscosity changes highlighted their importance in regulating cellular functions.1,2 The latest findings indicate that healthy breast epithelial cells exhibit a higher intracellular viscosity than cancerous ones, a change which is majorly driven by an altered actin distribution and a higher nucleus to cytoplasmic ratio in cancerous cells. Therefore, changes in viscosity are likely to be directly linked to diseases and malfunctioning at the cellular level. Although several mechanical based techniques are available to determine the viscosity of a fluid medium (capillary, falling ball, and rotational viscometer) – these are unlikely to be used to trace intracellular viscosity.3–5 The viscosity of the intracellular environment is, indeed, a very specific parameter for the efficient running of life. Various studies have revealed that an anomalous mitochondrial viscosity is related to neurodegenerative diseases, diabetes, and cell malignancy, while the change in the lysosomal viscosity suggests the onset of diseases of lysosomal storage, inflammation, and even cancer.6–9Many molecular ‘rotor based fluorophores (RBFs)’ and ‘aggregation-induced emission (AIE)’ fluorophores have been designed and synthesized to measure the intrinsic and extrinsic viscosity using the concept of Twisted Intramolecular Charge Transfer (TICT).10–12 The emission properties of these molecules depend on the rotating ability of the attached rotors at the excited state. The competition of the off/on state of emission depends on the radiative vs. non-radiative decays that can be regulated by the speed of rotation which can be restricted by a variation of the viscosity in the surrounding medium.13–15 Push–pull, BODIPY, cyanine, and porphyrin-based ‘fluorescent molecular rotors’ (FMRs) have been used as platforms in applications as viscosity sensors.16 The high sensitivity of these RBFs is essential for their ability to act as probes to measure the viscosity of biological fluids. Viscosity sensitivity is related to the fluorescence (FL) contrast (I/I0) of RBFs (I = FL intensity in high-viscosity media and I0 = FL intensity in low-viscosity media).17 The FL contrast strongly depends on the rotational ability of the molecular rotors. In addition to introducing rotors with a high rotation ability, several scientists have attempted to improve the sensitivity further by introducing multiple numbers of rotors into a single entity18,19 or by increasing the number of π-rich bridging between neighboring rotors.3,20 A very recent article by Ye et al. shows a general strategy for controlling the sensitivity of viscosity probes. It describes the inherent rotational energy barrier of RBFs that plays an important role in controlling the viscosity sensitivity of probes.21–24 Scientists also developed many viscosity-sensitive fluorescent probes that can monitor viscosity changes in specific subcellular organelles like mitochondria, lysosomes, etc.,25,26 although in these instances the possibilities of improving the sensitivity through such complicated synthetic approaches are less feasible.26–28 Thus, it is necessary to further explore simpler strategies which may rationally improve viscosity sensitivity in these applications.
Here, we have designed and synthesized a probe molecule (TPSI I) with an exceptionally high sensitivity on sensing viscosity following a simpler route. The new probe contains a molecular rotor with a π-rich bridge joining cyanine and phenyl pyridine. The structural design of the molecule enables it to transform via cis–trans isomerism through a vinyl bond by photoexcitation. The combined effect of the rotation of the phenyl pyridine and the photoisomerization characteristic of the molecule is shown to lead to an enhanced viscosity sensitivity.12,15,27 The rationale behind the high viscosity sensitivity of the probe was explored and the high sensitivity of TPSI I was successfully employed to mark alteration in intracellular viscosity both in healthy and cancerous cells in a simple way. The support of viscosity dependent emission in cells was given by measuring the intracellular viscosity by dynamic measurements.
Experiments and methods
All chemicals, 4-(pyridine-2-yl)benzaldehyde, 2,3,3-trimethyl-3H-indole, methyl iodide, and solvents were purchased from Sigma Aldrich, TCI Chemicals Company Ltd. All spectroscopic grade solvents, DCM, methanol, tetrahydrofuran, etc. were procured from the Merck Company and Spectrochem.(i) Instrumentation and spectroscopic studies
(ii) Synthesis
![[thin space (1/6-em)]](https://www.rsc.org/images/entities/char_2009.gif) :
:![[thin space (1/6-em)]](https://www.rsc.org/images/entities/char_2009.gif) 2, 1
2, 1![[thin space (1/6-em)]](https://www.rsc.org/images/entities/char_2009.gif) :
:![[thin space (1/6-em)]](https://www.rsc.org/images/entities/char_2009.gif) 3, 1
3, 1![[thin space (1/6-em)]](https://www.rsc.org/images/entities/char_2009.gif) :
:![[thin space (1/6-em)]](https://www.rsc.org/images/entities/char_2009.gif) 4, and 1
4, and 1![[thin space (1/6-em)]](https://www.rsc.org/images/entities/char_2009.gif) :
:![[thin space (1/6-em)]](https://www.rsc.org/images/entities/char_2009.gif) 5) to remove the unreacted part, and finally an orange-red coloured powder was obtained. Single crystals were obtained by dissolving the powder in DCM and by layering in hexane. (Fig. S2(a)–(e), ESI†).1H NMR (400 MHz, CDCl3) δH 8.74 (1 H, s), 8.38 (2 H, d, J 8.3), 8.30 (1 H, d, J 16.2), 8.24 (2 H, d, J 8.3), 8.16 (1 H, d, J 16.2), 7.86 (2 H, d, J 6.8), 7.72–7.67 (1 H, m), 7.66–7.50 (3 H, m), 7.33 (1 H, t, J 4.9), 4.60 (3 H, s), 1.89 (6 H, s). 1H NMR (400 MHz, DMSO-D6) δH 8.75 (1 H, dd, J 4.8, 1.7), 8.48 (1 H, d, J 16.4), 8.42–8.28 (5 H, m), 8.17 (1 H, d, J 8.0), 7.99–7.89 (3 H, m), 7.79 (1 H, d, J 16.4), 7.68–7.63 (2 H, m), 7.45 (1 H, dd, J 7.5, 4.7), 4.20 (3 H, s), 1.83 (6 H, s). (Fig. S2(a), ESI†)13C NMR (101 MHz, CDCl3) δ 182.46, 155.40, 154.17, 149.65, 143.90, 143.02, 141.55, 137.38, 134.36, 131.94, 130.07, 129.76, 127.88, 123.28, 122.51, 121.41, 115.08, 113.87, 77.35, 52.59, 37.07, 26.85. HRMS of TPSI I1 given (Fig. S2f and g, ESI†), m/z – found: exp 510.0819 [M + HCOO]+, 524.1102 [M + CH3COO]+, 126.90 [I – M]+ – Cal – [m/z: 465.0953]
5) to remove the unreacted part, and finally an orange-red coloured powder was obtained. Single crystals were obtained by dissolving the powder in DCM and by layering in hexane. (Fig. S2(a)–(e), ESI†).1H NMR (400 MHz, CDCl3) δH 8.74 (1 H, s), 8.38 (2 H, d, J 8.3), 8.30 (1 H, d, J 16.2), 8.24 (2 H, d, J 8.3), 8.16 (1 H, d, J 16.2), 7.86 (2 H, d, J 6.8), 7.72–7.67 (1 H, m), 7.66–7.50 (3 H, m), 7.33 (1 H, t, J 4.9), 4.60 (3 H, s), 1.89 (6 H, s). 1H NMR (400 MHz, DMSO-D6) δH 8.75 (1 H, dd, J 4.8, 1.7), 8.48 (1 H, d, J 16.4), 8.42–8.28 (5 H, m), 8.17 (1 H, d, J 8.0), 7.99–7.89 (3 H, m), 7.79 (1 H, d, J 16.4), 7.68–7.63 (2 H, m), 7.45 (1 H, dd, J 7.5, 4.7), 4.20 (3 H, s), 1.83 (6 H, s). (Fig. S2(a), ESI†)13C NMR (101 MHz, CDCl3) δ 182.46, 155.40, 154.17, 149.65, 143.90, 143.02, 141.55, 137.38, 134.36, 131.94, 130.07, 129.76, 127.88, 123.28, 122.51, 121.41, 115.08, 113.87, 77.35, 52.59, 37.07, 26.85. HRMS of TPSI I1 given (Fig. S2f and g, ESI†), m/z – found: exp 510.0819 [M + HCOO]+, 524.1102 [M + CH3COO]+, 126.90 [I – M]+ – Cal – [m/z: 465.0953]
![[thin space (1/6-em)]](https://www.rsc.org/images/entities/char_2009.gif) :
:![[thin space (1/6-em)]](https://www.rsc.org/images/entities/char_2009.gif) 3) mixture and dried in the oven (80 °C). Single crystals were obtained by dissolving the powder in DCM/hexane. The NMR spectrum shows the same peaks as for TPSI I. 1H NMR (400 MHz, DMSO) δ 8.75 (s, 1H), 8.49 (d, J = 16.3 Hz, 1H), 8.35 (s, 4H), 8.18 (d, J = 7.8 Hz, 1H), 8.06–7.87 (m, 3H), 7.80 (d, J = 16.4 Hz, 1H), 7.66 (s, 2H), 7.46 (s, 1H), 4.20 (s, 3H), 1.83 (s, 5H). (Fig. S3, ESI†). HRMS: m/z = 144.96 [PF6–M]+ (Fig. S3 a and b, ESI†).
3) mixture and dried in the oven (80 °C). Single crystals were obtained by dissolving the powder in DCM/hexane. The NMR spectrum shows the same peaks as for TPSI I. 1H NMR (400 MHz, DMSO) δ 8.75 (s, 1H), 8.49 (d, J = 16.3 Hz, 1H), 8.35 (s, 4H), 8.18 (d, J = 7.8 Hz, 1H), 8.06–7.87 (m, 3H), 7.80 (d, J = 16.4 Hz, 1H), 7.66 (s, 2H), 7.46 (s, 1H), 4.20 (s, 3H), 1.83 (s, 5H). (Fig. S3, ESI†). HRMS: m/z = 144.96 [PF6–M]+ (Fig. S3 a and b, ESI†).
(iii) Photoisomerization
The probes were dissolved in methanol to study their photoisomerization process in solution. Two different stock solutions with the probes (c, 1 × 10⁻⁵ M, methanol) were prepared. Then both the solutions were exposed under an UV lamp (λexc, 365 nm) for their respective times. Afterwards, time-dependent UV-VIS spectra were recorded for the prepared solutions. For solid-state samples, the powder of probes was mixed with barium sulfate as a reference and the mixture was applied to the sample holder. Then the sample holder was exposed under the UV-VIS lamp (λexc, 365 nm). The UV-VIS absorption spectra were recorded as a function of time.(iv) Electronic structure calculations
Quantum chemistry calculations were performed within the density functional theory (DFT) and its time-dependent version (TD-DFT) with the B3LYP functional and the 6-31G(d) basis set. Methanol solvent effects were taken into account by the polarized continuum model with the integral equation formalism (IEFPCM)29,30 and transition energies in solution were obtained within the linear response approach.31,32 Wave function-based methods were also used to further evaluate interstate relative energies and the nature of electronic states. All calculations were done using the Q-Chem program33 and the Gaussian package.34 Further details can be found in the ESI.†(v) Dynamic measurements
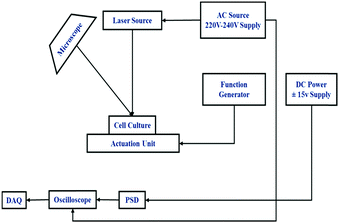
The cultured cells were placed on the actuation unit (piezoelectric patch). The piezo disc is driven by a function generator. Chirp signals up to 1 MHz frequency range, and 3 V (peak to peak) were applied to the Piezo disc using an arbitrary function generator (Tektronix, AFG1022). The prepared cell culture was placed over the cross slide and dynamic input was applied on the slide for the excitation of the cells. A microscope was used to determine the location of the cells in the dish. A Position-Sensitive Device (PSD) (Hamamatsu, S1880) was used as an optical position sensor (OPS) with a signal processing circuit (Hamamatsu, C4674-01) to measure the exact position of an incident light spot in two-dimensions on a sensor surface. A laser beam (RLM650TA-020R, Laser century) was focused on the cells and got refracted to the PSD. A schematic figure demonstrating the process is provided in Fig. 1.Displacement in the cells was traced by PSD and the oscilloscope gave the digital output voltage proportional to the displacement. A digital oscilloscope (Tektronix, TBS 1102B) was used to measure the voltage output from PSD in the time domain. Furthermore, a Data Acquisition system (DAQ) was used for processing the obtained time-domain data using MATLAB. We took the FFT of the time data to obtain the frequency response of the cells. A rectangular window was used for a better resolution of the sample rate in the oscilloscope. Response measurements were sequentially taken on the cell and the base. We took the cell's transfer function with respect to the base to take away all base related modes. The same procedure was repeated for different cell types. The frequency-domain response was processed in MATLAB. The natural frequency (ωn) of the cells was evaluated by using the peak picking approach. The quality factor (Q), a measure of damping present in the cell, was evaluated using the half power point approach. The damping ratio (ξ) was evaluated using the quality factor given by Q = 1/(2ξ). The time constant of the cell is given by τ = 1/(ξωn). Cells are a translucent structure and are mediated in a viscous fluid. Considering cells as micron-size droplets, the intracellular viscosity of the cell was determined using Lamb's relation35,36 given by
Results and discussion
(i) Synthesis
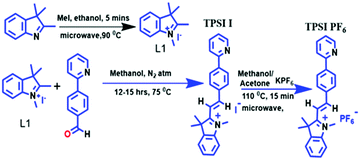
TPSI I was synthesized by methylation of [1,2,3,3-tetrame]thyl-3H-indol-1-ium (iodide) (L1) followed by reaction with 4-(pyridin-2-yl)benzaldehyde to form the desired product (E)-1,3,3-trimethyl-2-(4-(pyridin-2-yl)styryl)-3H-indol-1-ium(TPSI I). For TPSI PF6, the counter ion I− (iodide) of TPSI I was replaced by PF6− (potassium hexafluorophosphate) as shown in Scheme 1.(ii) Crystal structure
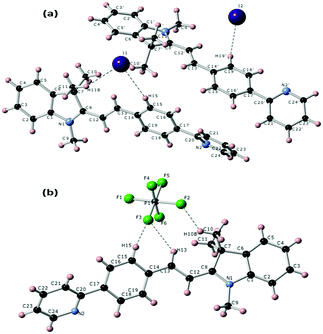
Single crystals for both compounds (TPSI I and TPSI PF6) were produced by the diffusion method using DCM/hexane as solvents. In both cases, the crystal structure and space group are triclinic and P1, respectively. A detailed description of the structures is given in the supporting document (Table S1 and S2, ESI†). Structural features for the TIPS+ cation in both compounds are given in Fig. 2. From the crystal structures, it is clear that the two hydrogen atoms present at the central double bonds (–HC12![[double bond, length as m-dash]](https://www.rsc.org/images/entities/char_e001.gif) C13H–) are in a trans disposition to each other, leading to a stable configuration of the TIPS+ cation in both TPSI I and TPSI PF6. In TPSI I, there are two non-equivalent molecules establishing hydrogen bonds to either the I1 or the I2 anions. The most remarkable difference between the conformation in the two independent cations is in the dihedral angle between the average planes passing through the phenyl pyridine and the cyanine groups, 39.04° and 24.26° for the molecules interacting with I1 and I2, respectively (Fig. S4(a) and (b), ESI†). In TPSI PF6 there is only a symmetry-independent TIPS+ cation with a dihedral angle of 36.08°, similar to that found for the first cation in TIPS I (Fig. S4c, ESI†).
C13H–) are in a trans disposition to each other, leading to a stable configuration of the TIPS+ cation in both TPSI I and TPSI PF6. In TPSI I, there are two non-equivalent molecules establishing hydrogen bonds to either the I1 or the I2 anions. The most remarkable difference between the conformation in the two independent cations is in the dihedral angle between the average planes passing through the phenyl pyridine and the cyanine groups, 39.04° and 24.26° for the molecules interacting with I1 and I2, respectively (Fig. S4(a) and (b), ESI†). In TPSI PF6 there is only a symmetry-independent TIPS+ cation with a dihedral angle of 36.08°, similar to that found for the first cation in TIPS I (Fig. S4c, ESI†).
(iii) Photophysical property studies
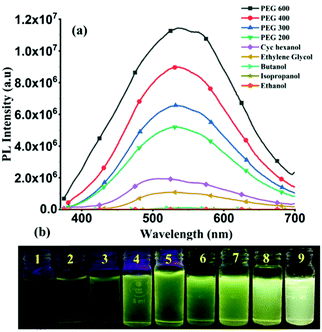
At room temperature, solutions of TPSI I and TPSI PF6 in methanol exhibit absorption peaks at λabs, 399 nm and 403 nm, respectively (Fig. S5, ESI†), similar to those reported for other cyanine analogues.24 Using the results from TD-DFT calculations (Fig. S6, S7 and Table S3, ESI†) these peaks may be attributed to a π–π*, HOMO-to-LUMO transition to the lowest excited singlet state37,38 (Fig. S8, ESI†).In the solid phase, TPSI PF6 shows a strong emission (λex = 368 nm; λem = 580 nm), while TPSI I exhibits only a very weak emission (λex = 368 nm, λem = 520 nm) (Fig. S9, ESI†), a demonstration, as it is well established that cyanine-type probes such as TPSI+ are sensitive to certain external stimuli such as the viscosity and the polarity of their environment.39 Both TPSI I and TPSI PF6 were tested for viscosity sensing experiments. The photoluminescence (PL) spectra and images of TPSI I were recorded in the presence of various solvents with increasing viscosity (0.98 cP in ethanol to 190 cP in PEG600, cP = centipoise) and polarity (Fig. 3a and b). The emission intensity increases drastically with the variation of the viscosity (∼255 times with increasing viscosity from 0.98 cP to 190 cP at λmax = 540 nm).
The experiment shows that the emission of TPSI I is highly sensitive to the viscosity of the medium. The dependency of the PL, the intensity of TPSI I and TPSI PF6 on viscosity, were compared by recording the PL spectra with a gradual increment of the viscosity through the addition of PEG400 into the solution containing TPSI I in methanol (10−5 M) (Fig. S10a and b, ESI†). Moreover, the relation between the emissions of TPSI I and TPSI PF6 with the viscosity of the solvent were quantified using the Förster–Hoffmann equation,40 log![[thin space (1/6-em)]](https://www.rsc.org/images/entities/char_2009.gif) I = C + x
I = C + x![[thin space (1/6-em)]](https://www.rsc.org/images/entities/char_2009.gif) log
log![[thin space (1/6-em)]](https://www.rsc.org/images/entities/char_2009.gif) η, where η is the viscosity of the solvents, I the emission intensity of the probe, C is a temperature-dependent constant, and x the viscosity sensitivity of the probe. By plotting log
η, where η is the viscosity of the solvents, I the emission intensity of the probe, C is a temperature-dependent constant, and x the viscosity sensitivity of the probe. By plotting log![[thin space (1/6-em)]](https://www.rsc.org/images/entities/char_2009.gif) I vs. log
I vs. log![[thin space (1/6-em)]](https://www.rsc.org/images/entities/char_2009.gif) η for TPSI I and TPSI PF6 we find a linear relation in the range 0.52 cP to 10.7 cP in the two cases with R2 = 0.98 and R2 = 0.97 for TPSI I and TPSI PF6, respectively (Fig. 4a and b). The values found for x for the two probes are 1.02 and 0.31 respectively. To the best of our knowledge, the value of x obtained for TPSI I, i.e. 1.02, is the highest value reported so far in the literature,41–46 supporting its high sensitivity to changes in the viscous medium. The detection limit for TPSI I is 0.93 cP and for TPSI PF6 is 1.29 cP. To check the response of TPSI I in small and long-range viscosity, the emission spectra and photoluminescence images of TPSI I were recorded in the presence of water (1 cP) and glycerol (1412 cP). The emission intensity is very high in glycerol in comparison to water (Fig. S10, ESI†). The emission spectra and photoluminescence images of TPSI I were also recorded in different concentrations of water-glycerol fractions (Fig. S10b and c ESI†). The emission intensity increases with an increase in the concentration of glycerol. In general, for the case of solvatochromic probes as the polarity of the solvent increases, the emission intensity decereases with a bathochromic shift and if the solvent polarity decereases, the emission intensity increases with a hypsochromic shift.47–49 Here, in both cases the emission intensity of TPSCI I increases without any noticeable change in the wavelength, from which we conclude that the changes depend only on the viscosity and not on the polarity. The significantly different values obtained for the two compounds despite sharing the same TIPS+ fluorescent cation is an indication of strong cation–anion interactions in solution, leading to a differential rigidification, and hence, sensitivity towards viscosity of the emitting cation in the two cases. A reversibility test was carried out by the gradually decreasing viscosity of the medium containing TPSI I by increasing the volume of methanol in the viscous solution. The emission intensity was found to decrease gradually (Fig. S11c, ESI†). Moreover, the emission intensity of TPSI I was found to increase gradually with the decreasing temperature of the medium (Fig. S12, ESI†).
η for TPSI I and TPSI PF6 we find a linear relation in the range 0.52 cP to 10.7 cP in the two cases with R2 = 0.98 and R2 = 0.97 for TPSI I and TPSI PF6, respectively (Fig. 4a and b). The values found for x for the two probes are 1.02 and 0.31 respectively. To the best of our knowledge, the value of x obtained for TPSI I, i.e. 1.02, is the highest value reported so far in the literature,41–46 supporting its high sensitivity to changes in the viscous medium. The detection limit for TPSI I is 0.93 cP and for TPSI PF6 is 1.29 cP. To check the response of TPSI I in small and long-range viscosity, the emission spectra and photoluminescence images of TPSI I were recorded in the presence of water (1 cP) and glycerol (1412 cP). The emission intensity is very high in glycerol in comparison to water (Fig. S10, ESI†). The emission spectra and photoluminescence images of TPSI I were also recorded in different concentrations of water-glycerol fractions (Fig. S10b and c ESI†). The emission intensity increases with an increase in the concentration of glycerol. In general, for the case of solvatochromic probes as the polarity of the solvent increases, the emission intensity decereases with a bathochromic shift and if the solvent polarity decereases, the emission intensity increases with a hypsochromic shift.47–49 Here, in both cases the emission intensity of TPSCI I increases without any noticeable change in the wavelength, from which we conclude that the changes depend only on the viscosity and not on the polarity. The significantly different values obtained for the two compounds despite sharing the same TIPS+ fluorescent cation is an indication of strong cation–anion interactions in solution, leading to a differential rigidification, and hence, sensitivity towards viscosity of the emitting cation in the two cases. A reversibility test was carried out by the gradually decreasing viscosity of the medium containing TPSI I by increasing the volume of methanol in the viscous solution. The emission intensity was found to decrease gradually (Fig. S11c, ESI†). Moreover, the emission intensity of TPSI I was found to increase gradually with the decreasing temperature of the medium (Fig. S12, ESI†).
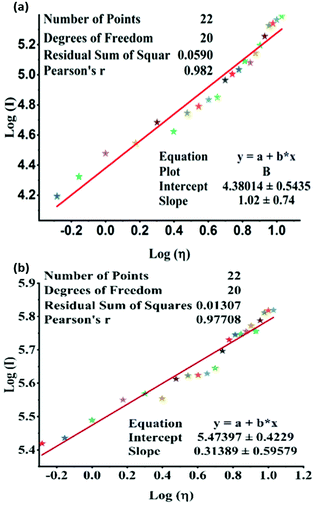 | ||
| Fig. 4 Linear fit between log(I) (I = PL intensity of (a) TPSI I, (b) TPSI PF6; c = 10−5 M, in methanol) and log(η) (η = viscosity of the solvent). | ||
The experiment supports the theory that the ease of motion of the rotating units (cyanine/pyridyl) might be responsible for the observed enhanced PL intensity. Hence, along with the rotation of the cyanine and phenyl pyridine units, the existing double bond that connects them may be playing a major role in the increased sensitivity towards the viscosity of the medium.
Computational modelling of the molecular torsion around the central double bond identifies it as a non-radiative decay path, where the gap between the ground and the first excited singlet gradually vanishes as the molecule loses its planarity (Fig. 5). Optimization of the ground state molecular structure at the DFT level shows a preference for the planar trans conformation of TPSI+ (coordinates for the optimized structure are provided in the ESI†). TD-DFT calculations at the Franck–Condon region identify the absorption band at ∼500 nm in solution (Fig. S6 and S7, ESI†) as the transition to the lowest excited singlet state (S1). The S0 → S1 excitation is dipole allowed, as indicated by a sizeable oscillator strength (f = 1.535) and is obtained as the electron promotion from the HOMO to the LUMO (Fig. S8, ESI†). Both frontier orbitals hold a π-type character with respect to the molecular plane and are largely delocalized over the entire molecule. Moreover, at the ethylene unit linking the cyanine ring with the phenyl pyridine, the HOMO and LUMO present π-bonding and π-antibonding character, respectively. Hence, the molecular torsion around the central double bond reduces the HOMO/LUMO energy difference. As a consequence, the gap between the ground and excited singlet diminishes as the molecule loses its planarity, with nearly S0/S1 degeneracy at the orthogonal position (Fig. 5). The shrinkage of the gap between the ground and excited relative energies upon molecular torsion has been further confirmed by multiconfigurational electronic structure calculations (Tables S4 and S5, ESI†).
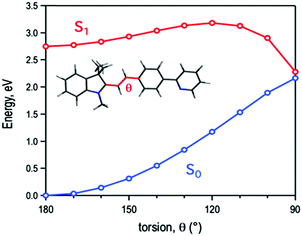 | ||
| Fig. 5 Energy profiles for the ground (S0) and first excited (S1) states of TPSI+ along the molecular torsion around the central double bond. | ||
The computed energy profiles clearly show a photo-induced non-radiative decay path back to the ground state following the torsion of the central double bond. The rotation around the ethylene unit involves a rather large simultaneous displacement of the cyanine ring and the phenyl pyridine moiety, which can be impeded by environmental factors such as a high viscosity of the medium or the establishment of hydrogen-bond interactions with the anions. The non-radiative decay of TPSI+ is in agreement with the photoinduced isomerization described for similar systems such as retinal50 or stilbene.51 These facts led us to predict that the exceptionally high sensitivity of TPSI I compared to TPSI PF6 and others on the viscosity might be associated with the photo-induced cis–trans isomerization process and the influence of hydrogen-bond interactions with the anions in this process.
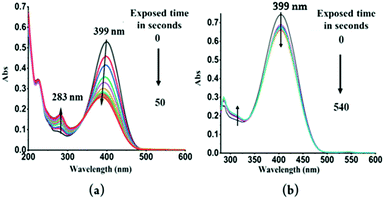
To further explore these questions, several controlled experiments were conducted on both probes. The following experiment was carried out in two parts. First, TPSI I and TPSI PF6 were irradiated with a UV-Vis lamp (λext = 365 nm) at increasing time intervals and after each excitation, the UV-Vis absorption spectra were recorded. In the case of TPSI I, we observed that the intensity of the long-wavelength absorption peak (λabs, 398 nm) decreased gradually with a slight blue shift upon exposure to UV light (λex, 365 nm; 0–50 s) and, in parallel, the absorption of the new peak (λabs, 281 nm) gradually increased. After this, no further change was observed (Fig. 6a). In TPSI PF6−, no significant changes were observed in the absorption peak upon exposure to the UV light, even up to ten minutes later (Fig. 6b). To check the reversible nature of the process, the absorption spectra of TPSI I (exposed to UV radiation) were recorded at different time intervals (0–85 s) by switching off the lamp (Fig. S13a, ESI†), observing that the peak at 283 nm (Fig. 6) gradually decreased along with the appearance of a broad absorption peak at 398 nm with an intensity that gradually increased with time. It took ∼16 h to return to the original form (Fig S13b, ESI†). Such observations support a cis–trans isomerization process in TIPS I.
According to a recent report, cyanine-type chromophores act as rotors in the compounds to which they are attached.52 Hence, we assume that the cyanine in TPSI I and TPSI PF6 will also act as a rotating unit. The 1H NMR spectrum of TPSI I with PEG400 was recorded to understand whether there is any sort of interaction, apart from the viscosity effect, playing between PEG400 and the probe molecule. Only a slight change in the chemical shifts of all the 1H NMR peaks, moving from the deshielded to the shielded region, was observed, indicating that there are no specific interactions existing between PEG400 and the probe molecule (Fig. S15(a) and (b), ESI†).
We also investigated the X-ray crystal structures of both compounds to compare them and to try to get some clues on their significant difference in viscosity sensing. Since the emitting cation is the same in the two cases, the different behaviour is expected to arise from specific anion–cation interactions that modify the rigidity for the cation in the two compounds. As shown in Fig. S15a, ESI,† the unit cell of TPSI I contains four cations (the four cations in the centre of the figure) that form an approximate rectangular box and four iodide anions forming an approximate square around the two central cations. These four iodide anions all lie on the same plane (although it is not the plane shown in the figure, where anions at different heights belonging to neighbouring unit cells are superposed). As is evident in Fig. S15a in the ESI,† molecules in the unit cell group together form two different pairs of head-to-tail dimers that alternate in a perpendicular arrangement along the direction shown in the figure. It is noteworthy that the volume comprised between the two molecules in each of these dimers is left empty, with anions adopting positions in the space between the different dimers. For the dimer shown in the centre of the figure, where the methyl groups on the cyanine fragment point towards the exterior of the dimer, the empty volume between the two molecules, ∼46.6 Å3, is considerable. On the other hand, in the crystal structure of TPSI PF6 (Fig. S15b, ESI†), we find only two symmetry-equivalent molecular cations in the unit cell, where no formation of cages or voids is observed. Further details of all the interactions in the crystal packing of TPSI I (Fig. S16a, ESI†) and TPSI PF6 are included in the supplementary documents (Fig. S16b, ESI†). As is evident when comparing Fig. S15a and b, ESI,† very different packing patterns are obtained with the same cationic entity using different counter ions i.e., PF6− or I−. In TPSI I, the basic structural unit is formed by head-to-tail dimers of TPSI+ cations, with the relatively small I− anions disposed around these dimers.
From the point of view of the rigidity of the TPSI+ cations upon aggregation, the large size effect of the PF6− anion is predicted to restrict the free rotation of the pyridyl and cyanine moieties by pinning the molecular geometry through a more homogeneous net of electrostatic interactions around each cation. In the case of TIPS I, on the contrary, the formation of loosely bound dimers surrounded by iodine anions may be the cause of higher flexibility of the emitting cations in the solid state. Taking the observed packing patterns in the two crystal structures as a reference, we propose that upon aggregation, the formation of loosely bound TIPS+ dimers surrounded by the small I− anions allows, upon excitation, more efficient energy dissipation through a non-radiative channel in the case of TPSI I. In the case of TPSI PF6, we expect, on the contrary, aggregation of individual TPSI+ cations surrounded by a shell of PF6− anions. In this case the formation of TIPS+⋯PF6− hydrogen bonds lead to a restriction of internal motion in the emitting TIPS+ cation that prevents non-radiative decay upon excitation. Since this behaviour is also observed in solution, we conclude that interacting anion-cation units are the basic entities found in solution.
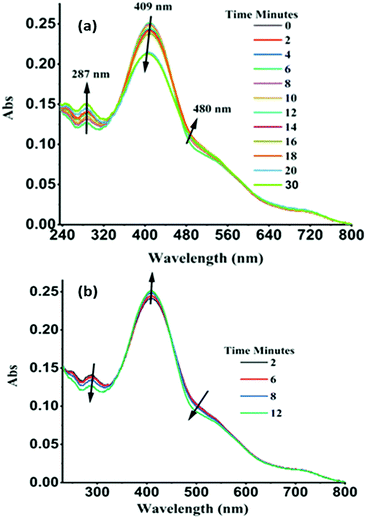
A UV-Vis absorption-based experiment was performed to support to these hypotheses. A sample of solid powder of TPSI I was irradiated by a UV lamp (λex, 250 nm) at a certain interval and then the UV-Vis absorption spectrum was recorded. Similarly, the process was continued for 30 minutes. The characteristic absorption peaks of TPSI+ (λabs, 287 nm; 409 nm) were observed to change systematically with increasing time interval. In this case, the intensity of the original absorption peak at 287 nm increased, while that of the peak at 409 nm was found to gradually decrease, with the observation of isosbestic points at 360 nm and 450 nm (Fig. 7a). The peak reached a maximum absorption within 30 minutes of initiating the excitation and then it reverted to the original absorption intensity within 12 min (Fig. 7b). Besides, we observed an increase in the intensity of the absorption peak at 409 nm when changing the excitation wavelength to 365 nm (Fig. S17a and b, ESI†). Computations of vertical energies along the molecular torsion path of TPSI+ suggest a redshift of the absorption energy at the cis conformation with respect the trans form (Table S6, ESI†), in agreement with the decrease and increase of the 409 nm and 480 nm absorption peaks upon irradiation. On performing an analogous absorption study for TPSI PF6, we did not observe such changes irrespective of the excitation wavelengths (Fig. S18a and b ESI†).
These observations suggest that TPSI I becomes unstable under photoexcitation and it is constantly transformed into the photo-isomerized product due to the presence of relatively flexible units in the crystals which may undergo movement. The absence of such phenomena in TPSI PF6 confirms our hypothesis of the effect of hydrogen bonding cation–anion interactions in the packing and restriction of internal motion in TPSI I and TIPS PF6, explaining the emissive nature of the TPSI+ cations in TIPS PF6 in the solid-state. Moreover, the significant extent of overlapping of emission and absorption spectra of TPSI+ in TPSI I [overlap integral J(λ), 3.46 × 10¹⁶; Fig. S19, ESI†] leads to the self-absorption of the emitted energy, that added to the more effective non-radiative decay channel, justifies the non-emissive nature of TIPS I in the solid state.
(iv) Measurement of intracellular viscosity in normal and cancerous cells
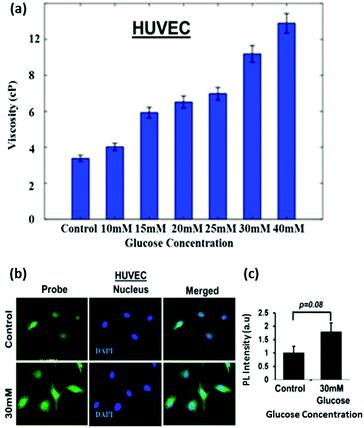
To test the efficacy of the TPSI I for detecting alterations in viscosity we initially used primary cells from human origin, the HUVEC (Human Umbilical Vein Endothelial Cells). The compound was found to be non-cytotoxic to the HUVECs, as analysed by an XTT assay (data not shown). The cells were then treated with different concentrations of glucose ranging from 5.5 to 40 mM and the effect of glucose on the alteration of the intracellular viscosity was measured. At the onset, we used a well-accepted position sensing device (PSD) based analysis for the measurement of intracellular viscosity. Using a standard protocol as elaborated in the Methodology section, we performed sequential measurements on the cell and the base. Fig. 8a shows the frequency response of the cell and the base captured using the PSD system. We considered the transfer function of the cell with respect to the base to take away all base related modes. Fig. 8a also shows the transfer function of the cell. We evaluated the viscosity using the dynamic measurements as per the details provided in the Methods section. The PSD system depicted an increase in intracellular viscosity with an increase in the concentration of glucose. This experiment acted as an affirmation for an increase in intracellular viscosity with an increase in the concentration of glucose.Thereafter, since a statistically significant increase in viscosity was observed with 30 mM glucose in HUVECs, we selected the same dose for fluorescence microscopy-based analysis of the TPSI I compound. We found that for HUVECs, a treatment with 30 mM of glucose was sufficient to cause an increase in intracellular viscosity detected through TPSI I fluorescence (Fig. 8b).
Although a 1.8-fold increase in intracellular viscosity was observed, yet this change was not found to be statistically significant (p = 0.08), at least by the current TPSI I staining protocol (Fig. 8c). Subsequently, we planned to analyse the potential of the probe for monitoring intracellular viscosity in tumour cell models. We cultured the human tumour cell line Huh7 and exposed the cells to different concentrations of TPSI I.
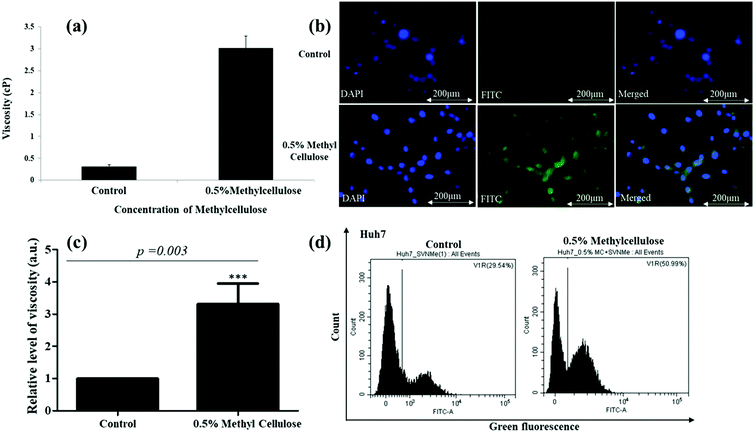
Dose kinetics for viability was performed to detect any cytotoxic effect imparted by the compound on the tumour cells and the compound was found to be non-cytotoxic (Fig. S20, ESI†). Thereafter, we selected methylcellulose (MC) to enhance the intracellular viscosity of the Huh7 cells.53 PSD analysis showed an approximately 3-fold increase in intracellular viscosity upon MC treatment (Fig. 9a) supporting the fact that cellular viscosity increases upon MC exposure. Following confirmation of the alteration of intra-cellular viscosity, fluorescence microscopy was performed with the compound. Fluorescence microscopic images (Fig. 9b and c) show a substantial increase in green fluorescence intensity in cells treated with MC. To have a quantitative evaluation of the same, we compared a shift in fluorescence through flow cytometry in Huh7 cells treated with TPSI I alone or with TPSI I plus MC. Importantly, flow cytometric analysis also provided further evidence for the viscosity probing the function of TPSI I, as an increase in fluorescence was observed upon MC exposure (Fig. 9d).
Conclusion
In summary, the present article reports the water-soluble novel ultra-sensitive viscosity probe TPSI I, with a sensitivity of x = 1.02 (Förster–Hoffmann equation). The TPSI+ cation in TPSI I rotates freely, photo isomerizes, and shows a weak photoluminescence in a low-viscosity environment, while in the high viscosity media, the emission intensity is strongly enhanced. The restriction of motion in a highly viscous medium reduces the dissipation of energy in the excited state through non-radiative paths and enhances the photoluminescence intensity. The restriction of internal motion was also supported by changing the counterion with larger size PF6 which is found to restrict the internal motion of the TPSI+ cation and thus making it less sensitive to changes in viscosity. The enhancement of photoluminescence was further applied to measure the intracellular viscosity using an imaging technique in normal and cancerous cells of human origin. The probe was able to distinguish the altered viscosity of cancerous from normal cells. Therefore, we believe that the present probe, TPSI I, holds the potential to be utilized in the future for pre-diagnosis of various diseases linked to altered cellular viscosity, thus enabling an image-based approach towards disease diagnosis.Author's contribution
The manuscript was written through the contributions of all authors. All authors have approved the final version of the manuscript.Conflicts of interest
The authors declare no competing financial interest.Acknowledgements
V. K. thanks CSIR India for the SRF fellowship [09/719(0082)/2018EMR-I]. We gratefully acknowledge to DRDO, Govt. of India, for supporting the financial assistance through the research project no. ARMREB/CDSW/2019/216. A. S. thanks BITS Pilani, Pilani Campus for Institute Fellowship. The ‘UGC-SAP’ and DST-FIST programs, Department of Chemistry, BITS Pilani, Pilani Campus, have been acknowledged for instrumental support. We gratefully thank DST-FIST [SR/FST/CSI-270/2015] for the HRMS Facility, Department of Chemistry, BITS Pilani. This work was partially supported by an Additional Competitive Research Grant from BITS-Pilani to SM1(PLN/AD/2017-18/02) and SM2(PLN/AD/2018-19/2). M. Z.-U. and D. C. acknowledge financial support from the Spanish Government MINECO/FEDER (projectCTQ2016-80955-P) and the EuskoJaurlaritza (Basque Government, project PIBA19-0004). P. A.'s research has been supported by the Spanish Ministerio de Economia y Competitividad (project PGC2018-093863-B-C22 and the Maria de Maeztu Units of Excellence Program under Grant MDM-2017-0767) and Generalitat de Catalunya (project 2017 SGR 1289).References
- M. K. Kuimova, Chima, 2012, 66, 159–165 CrossRef CAS PubMed.
- P. A. Valberg and H. A. J. B. j. Feldman, Int. Rev. Cytol., 1987, 52, 551–561 CAS.
- L. Tang, L. Zhou, X. Yan, K. Zhong, X. Gao, X. Liu and J. Li, Dyes Pigm., 2020, 182, 108644 CrossRef CAS.
- M. K. Kuimova, S. W. Botchway, A. W. Parker, M. Balaz, H. A. Collins, H. L. Anderson, K. Suhling and P. R. Ogilby, Nat. Chem., 2009, 1, 69–73 CrossRef CAS PubMed.
- J. Gong, C. Liu, X. Jiao, S. He, L. Zhao and X. Zeng, Microchem. J., 2020, 158, 105191 CrossRef CAS.
- X. Zhang, L. Wang, N. Li and Y. Xiao, Chin. Chem. Lett., 2021 DOI:10.1016/j.cclet.2021.02.031.
- T. D. Thanh, J. Balamurugan, N. T. Tuan, H. Jeong, S. H. Lee, N. H. Kim and J. H. Lee, Biosens. Bioelectron., 2017, 89, 750–757 CrossRef CAS PubMed.
- Y. Wu, W. Shu, C. Zeng, B. Guo, J. Shi, J. Jing and X. Zhang, Dyes Pigm., 2019, 168, 134–139 CrossRef CAS.
- J. Cui, H. Nie, S. Zang, S. Su, M. Gao, J. Jing and X. Zhang, Sens. Actuators, B, 2021, 331, 129432 CrossRef CAS.
- R. Kotani, H. Sotome, H. Okajima, S. Yokoyama, Y. Nakaike, A. Kashiwagi, C. Mori, Y. Nakada, S. Yamaguchi and A. Osuka, J. Mater. Chem. C, 2017, 5, 5248–5256 RSC.
- S.-C. Lee, J. Heo, H. C. Woo, J.-A. Lee, Y. H. Seo, C.-L. Lee, S. Kim and O.-P. Kwon, Chem. – Eur. J., 2018, 24, 13706–13718 CrossRef CAS PubMed.
- X. Peng, Z. Yang, J. Wang, J. Fan, Y. He, F. Song, B. Wang, S. Sun, J. Qu, J. Qi and M. Yan, J. Am. Chem. Soc., 2011, 133, 6626–6635 CrossRef CAS PubMed.
- J. Sutharsan, D. Lichlyter, N. E. Wright, M. Dakanali, M. A. Haidekker and E. A. Theodorakis, Tetrahedron, 2010, 66, 2582–2588 CrossRef CAS PubMed.
- M. A. Haidekker and E. A. Theodorakis, Org. Biomol. Chem., 2007, 5, 1669–1678 RSC.
- L. Wang, Y. Xiao, W. Tian and L. Deng, J. Am. Chem. Soc., 2013, 135, 2903–2906 CrossRef CAS PubMed.
- M. K. Kuimova, Phys. Chem. Chem. Phys., 2012, 14, 12671–12686 RSC.
- N. Boens, V. Leen and W. Dehaen, Chem. Soc. Rev., 2012, 41, 1130–1172 RSC.
- D. Su, C. L. Teoh, L. Wang, X. Liu and Y.-T. Chang, Chem. Soc. Rev., 2017, 46, 4833–4844 RSC.
- F. Liu, Y. Luo and M. Xu, Tetrahedron Lett., 2018, 59, 4540–4544 CrossRef CAS.
- X. Peng, F. Song, E. Lu, Y. Wang, W. Zhou, J. Fan and Y. Gao, J. Am. Chem. Soc., 2005, 127, 4170–4171 CrossRef CAS PubMed.
- S. Ye, H. Zhang, J. Fei, C. H. Wolstenholme and X. Zhang, Angew. Chem., Int. Ed., 2020 DOI:10.1002/anie.202011108.
- A. Vyšniauskas, I. López-Duarte, N. Duchemin, T.-T. Vu, Y. Wu, E. M. Budynina, Y. A. Volkova, E. Peña Cabrera, D. E. Ramírez-Ornelas and M. K. Kuimova, Phys. Chem. Chem. Phys., 2017, 19, 25252–25259 RSC.
- A. Li, Y. Liu, C. Bi, W. Xu, Z. Ma, H. Cui and S. Xu, Spectrochim. Acta, Part A, 2020, 237, 118390 CrossRef CAS PubMed.
- S. Toliautas, J. Dodonova, A. Žvirblis, I. Čiplys, A. Polita, A. Devižis, S. Tumkevičius, J. Šulskus and A. Vyšniauskas, Chem. – Eur. J., 2019, 25, 10342–10349 CrossRef CAS PubMed.
- X. Song, N. Li, C. Wang and Y. Xiao, J. Mater. Chem. B, 2017, 5, 360–368 RSC.
- C. Ma, W. Sun, L. Xu, Y. Qian, J. Dai, G. Zhong, Y. Hou, J. Liu and B. Shen, J. Mater. Chem. B, 2020, 8, 9642–9651 RSC.
- Z. Yang, Y. He, J.-H. Lee, N. Park, M. Suh, W.-S. Chae, J. Cao, X. Peng, H. Jung, C. Kang and J. S. Kim, J. Am. Chem. Soc., 2013, 135, 9181–9185 CrossRef CAS PubMed.
- J. A. Robson, M. Kubánková, T. Bond, R. A. Hendley, A. J. P. White, M. K. Kuimova and J. D. E. T. Wilton-Ely, Angew. Chem., Int. Ed., 2020, 59, 21431–21435 CrossRef CAS PubMed.
- E. Cancès and B. Mennucci, J. Chem. Phys., 2001, 114, 4744–4745 CrossRef.
- D. M. Chipman, J. Chem. Phys., 2002, 116, 10129–10138 CrossRef CAS.
- R. Cammi and B. Mennucci, J. Chem. Phys., 1999, 110, 9877–9886 CrossRef CAS.
- M. Cossi, N. Rega, G. Scalmani and V. Barone, J. Comput. Chem., 2003, 24, 669–681 CrossRef CAS PubMed.
- M. Frisch, et al., Gaussian 09, Rev. D.01, Gaussian, Inc., Wallingford, CT, 2013 Search PubMed.
- M. Ehara, K. Toyota, R. Fukuda, J. Hasegawa, M. Ishida, T. Nakajima, Y. Honda, O. Kitao, H. Nakai and T. Vreven.
- H. Lamb, Hydrodynamics, Cambridge University Press, 1993 Search PubMed.
- A. Prosperetti, J. Fluid Mech., 1980, 100, 333–347 CrossRef.
- R. F. Khairutdinov and N. Serpone, J. Phys. Chem. B, 1997, 101, 2602–2610 CrossRef CAS.
- L. Qun, L. Guo-Liang, P. Bi-Xian and L. Zheng-Xin, Dyes Pigm., 1998, 38, 211–218 CrossRef.
- Y. Xu, Y. Liu and X. Qian, J. Photochem. Photobiol., A, 2007, 190, 1–8 CrossRef CAS.
- W. Akers and M. Haidekker, J. Biomech. Eng., 2004, 126, 340–345 CrossRef CAS PubMed.
- I. López-Duarte, T. T. Vu, M. A. Izquierdo, J. A. Bull and M. K. Kuimova, Chem. Commun., 2014, 50, 5282–5284 RSC.
- S. Khopkar, M. Jachak and G. Shankarling, Dyes Pigm., 2019, 161, 1–15 CrossRef CAS.
- R. D. Telore and N. Sekar, Dyes Pigm., 2016, 129, 1–8 CrossRef CAS.
- M. Rajeshirke, A. B. Tathe and N. Sekar, J. Mol. Liq., 2018, 264, 358–366 CrossRef CAS.
- G. Zhang, Y. Ni, D. Zhang, H. Li, N. Wang, C. Yu, L. Li and W. Huang, Spectrochim. Acta, Part A, 2019, 214, 339–347 CrossRef CAS PubMed.
- F. Liu, J. Wen, S.-S. Chen and S. Sun, Chem. Commun., 2018, 54, 1371–1374 RSC.
- A. Yu, C. A. Tolbert, D. A. Farrow and D. M. Jonas, J. Phys. Chem. A, 2002, 106, 9407–9419 CrossRef.
- A. V. Kulinich, E. K. Mikitenko and A. A. Ishchenko, Phys. Chem. Chem. Phys., 2016, 18, 3444–3453 RSC.
- S. Nigam and S. Rutan, Appl. Spectrosc., 2001, 55, 362A–370A CrossRef CAS.
- R. Schoenlein, L. Peteanu, R. Mathies and C. Shank, Science, 1991, 254, 412–415 CrossRef CAS PubMed.
- Y. Dou and R. E. Allen, J. Chem. Phys., 2003, 119, 10658–10666 CrossRef CAS.
- Y. Shiraishi, T. Inoue and T. Hirai, Langmuir, 2010, 26, 17505–17512 CrossRef CAS PubMed.
- G. Stephen, B. Anne and W. Margaret van, In Vitro Cell. Dev. Biol.: Anim., 1993, 29A, 755–757 Search PubMed.
Footnote |
| † Electronic supplementary information (ESI) available: 1H NMR, 13C NMR, and mass spectra, crystal data, theoretical calculations, UV-visible and fluorescence spectroscopic analyses and other related materials. CCDC 2023139 and 2023140. For ESI and crystallographic data in CIF or other electronic format see DOI: 10.1039/d1ma00277e |
| This journal is © The Royal Society of Chemistry 2021 |

