 Open Access Article
Advances in the designs and mechanisms of MoO3 nanostructures for gas sensors: a holistic review
Ritu
Malik
a,
Nirav
Joshi
b and
Vijay K.
Tomer
 *c
*c
aDepartment of Physics, D.C.R. University of Science & Technology, Murthal-131039, Haryana, India
bSão Carlos Institute of Physics, University of São Paulo, CP 369, São Carlos 13560-970, São Paulo, Brazil
cDepartment of Materials Science & Nanotechnology, D.C.R. University of Science & Technology, Murthal-131039, Haryana, India. E-mail: vjtomer@gmail.com
First published on 1st June 2021
Abstract
The rapid expansion and development of industrial sectors and corridors pose a significant threat to the world today owing to the deteriorating air quality resulting from the release of harmful and toxic gases into the atmosphere. To combat and tackle air pollution, reliable and precise sub-ppm detection of these gases is highly desirable for human safety and the environment. For a gas sensor to perform its level best, the choice of nanomaterials is a critical factor that can significantly impact the robustness, stability, cost-effectiveness, sensitivity, and selectivity of the sensing device. Molybdenum trioxide (MoO3), as an n-type semiconducting metal oxide, has been rated as a research hotpot material in recent years due to its utility in a wide range of important technological applications. Owing to the advancement of synthetic techniques, it has been made possible to explore numerous novel nanostructures and integrate them into smart gas sensing devices. In this quest, this review is an effort to highlight the various nanostructures of MoO3 and the influence of these morphologies on the gas sensing performance. A detailed morphological overview of pristine MoO3 nanomaterials ranging from one-dimensional (1-D) to three-dimensional (3-D) nanostructure formation, followed by the preparation of different heterostructures including MoO3/metal oxides (p-type and n-type), MoO3/noble metal decoration, and MoO3/2D materials in the thematic domain of gas sensing, has been presented. Finally, a future outlook on the further progress of MoO3 gas sensors based on the current scenario is also suggested.
Introduction
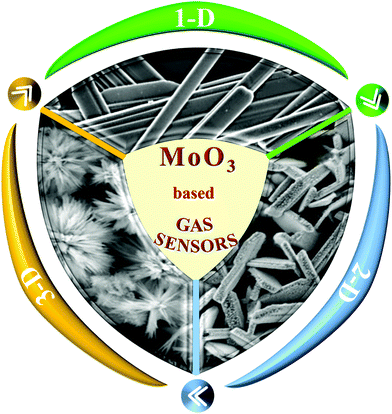
Recent advancement in technology and its rapid adoption by the society has indeed marked an unparalleled impression on the quality of our lives. Nevertheless, the increasing usage of energized devices and various other components to sustain the routine lifestyle has undoubtedly harmed Earth with increased emissions of toxic and greenhouse gases and the spilling of hazardous chemicals/substances into the atmosphere.1–5 As a consequence, the last two decades have witnessed a surprising upsurge in environmental monitoring technologies along with routine industrialization. One important aspect in mitigating environmental pollution is monitoring toxic and hazardous gases, where the search for faster, more sensitive, and low power consumption gas sensors is never-ending.6–10 As an example, the efficient and quick detection of harmful gases as a result of accidents at petrochemical plants/sewage plants/mines could not only save money but also many important lives11–15 with the assistance of a distributed network of gas sensors.16,17 A single sensor in such a network should accurately identify gases present in a complex mixture, be sensitive enough to detect harmful gases at lower concentrations, function at low power consumption, and be cheap enough to provide high spatial resolution across a wide range of sensors.18–22 Yet, commercially available gas sensors are not mature with respect to some of these characteristics. In particular, the selectivity between NH3, NOx, and CO for room temperature operation is still a matter of concern for commercially available gas sensors, particularly in the low ppm range.23–26 Besides, most of the existing gas sensors work at temperatures tens or hundreds of degrees above room temperature and require a huge amount of power for their functioning.27–29 So far, numerous gas sensors including acoustic, electrochemical, optical, and resistance have been developed based on their working principle; however, metal oxide (MOx)-based resistive gas sensors have enjoyed a privilege over other materials due to their high sensitivity, easy fabrication, lightweight, low fabrication cost, and simple detection method.5,30–35Molybdenum trioxide (MoO3) is an intriguing wide band gap n-type semiconductor with three unique polymorphous crystalline forms—orthorhombic α-MoO3 (thermodynamically stable phase), monoclinic β-MoO3 (low temperature metastable phase), and hexagonal h-MoO3 phases.36–40 MoO3 has several merits such as a unique layered structure, tunable band gap (2.8–3.6 eV), high electron mobility, low cost-phase-controlled synthesis, non-toxicity, and excellent electrochemical property, which prompts increasing interest in this fascinating material. In particular, α-MoO3 has excited the research community with its layered anisotropic structure wherein the layers are parallel to the (010) crystal plane.41–43 Every layer is composed of two further sublayers, which are formed by corner-sharing MoO6 octahedra along the [001] and [100] directions. The two sublayers then bind together with van der Waals forces by sharing the edges of the octahedra along the [001] direction to form MoO6 octahedra layers.44,45 These layers then alternately stack along the [010] direction to form an α-MoO3 structure.46–48 This unique layered structure of α-MoO3 increases the content of pentavalent Mo5+ ions, which possesses strong affinity to oxygen.49,50 Since gas sensors function by the reaction between oxygen and the adsorbed analyte gas molecules, the presence of Mo5+ increases the adsorption effect, thus resulting in enhanced gas sensor response.49,51–54 In recent times, MoO3-based gas sensors have been intensively investigated for determining the trace concentration of toxic gases such as NO2,55 H2,56 ethanol,57 CO,58 NH3,59 and triethylamine.60 The main governing factors that affect the sensitivity of a gas sensor are its size, morphology, and structure.61,62 Thus, great efforts are being invested so as to improve the gas-sensing performance of MoO3 by incorporating tailored nanostructures with controlled shapes, sizes, and morphologies. Owing to this, nanostructured MoO3 with zero-dimensional (0-D), one dimensional (1-D), two dimensional (2-D), and three dimensional (3-D) morphologies have been synthesized (Scheme 1) employing various synthesis methods such as hydrothermal,63 solvothermal,64 sol–gel,65,66 co-precipitation,67 physical vapor deposition,68 thermal evaporation,69 RF magnetic sputtering,54 chemical vapor deposition,70 and spray-pyrolysis.71 Also, because of its intrinsic structural anisotropy, α-MoO3 has demonstrated rich nanostructured morphologies; therefore, in the past few years, efforts have been made to enhance the sensitivity and enable the sensor to perform at low concentration by designing nanostructures that not only possess high crystallinity but also high surface to volume (S/V) ratio such as nanobelts,72,73 nanorods,74,75 nanofibers,76,77 nanoplates,78,79 nanosheets,80,81 nanowires,82 and nanoflowers.83,84 In particular, a high S/V ratio enables the swift diffusion of analyte gas molecules into the sensor layer, thus resulting in quicker response, higher selectivity, better sensitivity, and lower power consumption; however, the selectivity and operation temperature remain major constraints for MoO3-based gas sensors. To overcome these challenges, great progress has been achieved in the recent past, which is reflected in the increased number of scientific articles primarily focusing on the formation of heterostructures, surface functionalization with a noble metal, and use of light illumination.85–89
Considering these aspects, a review article is the need of hour, which can summarize the latest happenings in gas sensing technology while putting forth a detailed morphological investigation of nanostructured MoO3 in the current scenario of the sensing domain. This review has been drafted in line with the holistic coverage of MoO3-based gas sensors since it is one of the metal oxide materials that have experienced excessively increased interest in the recent years (Scheme 2). Although there are many reports on the detection of harmful and toxic gases using resistive gas sensors,25,29,30,90–95 none such review on MoO3 could be located in the research database, which can provide a holistic overview of the sensing abilities and performances of this rising star of the SMOx family. The review is divided into three main sections, which provide an in-depth overview of the detection of hazardous gases using different MoO3 nanostructures (1-D, 2-D, and 3-D). Different morphologies of MoO3 in relation to their gas sensing attributes are addressed, while key challenges and future research perspectives have been discussed, which could serve as a roadmap for exploring this fascinating material not only for gas sensing but also for other technologically important applications.
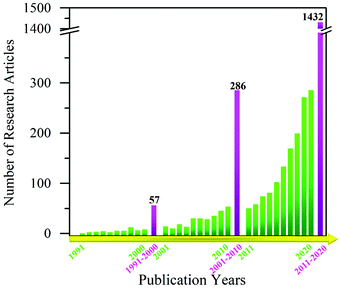 | ||
| Scheme 2 Yearly publications demonstrating the increasing interest in MoO3-based gas sensors in the last three decades (Source: ISI Web of Science database and search criteria ‘MoO3 + gas sensor’). | ||
One dimensional (1-D) MoO3 nanostructures for gas sensors
In recent years, the development of 1-D MoO3 nanostructures with a high S/V ratio has received tremendous attention due to their speedy charge transfer throughout one spatial dimension in the range of 1–100 nm.96–98 1-D nanostructure materials consist of a networked structure, which reduces agglomeration while simultaneously facilitating the diffusion of the analyte gas molecules on the material surface.99,100 Ultralong 1-D structures are known for providing a direct transport path for electrons to propagate along the axis, which greatly enhances the gas sensing performance. Moreover, gas sensors made of these 1-D nanostructures offer ultra-sensitivity, fast response, higher stability, low-temperature operation, and less power consumption.101,102 To date, a variety of 1-D nanostructures including nanobelts,60,72,73,96,99,101–105 nanoribbons,56,59,100,106,107 nanorods,74,75,97,108–113 nanofibers,76,114 nanowires,82 and microrods98,115,116 of MoO3 have been utilized in gas sensors and the following section summarizes these nanostructures with their gas sensing performance and mechanism. An overview of gas sensors based on 1-D MoO3 nanostructures is listed in Table 1.| Class | Material | Synthesis method | Gas | Conc. (ppm) | Operating temp. (°C) | Response | Resp./Reco. time (s/s) | Ref. |
|---|---|---|---|---|---|---|---|---|
| a Not given. | ||||||||
| Nanobelt | MoO3/Fe2(MoO4)3 | Hydrothermal | Toluene | 50 | 250 | 5.3 | <30/<30 | 191 |
| MoO3/ZnO | Hydrothermal | Ethanol | 100 | 250 | 19 | 2.5/3.5 | 192 | |
| MoO3 | Hydrothermal | Ethanol | 800 | 300 | 174 | 42a/4a | 193 | |
| Zr/MoO3 | Hydrothermal | Xylene | 100 | 206 | 7.99 | 32/264 | 194 | |
| MoO3/Fe2O3 | Hydrothermal | Xylene | 100 | 206 | 6.9 | 87/190 | 195 | |
| Ce/MoO3 | Hydrothermal | TMA | 50 | 240 | 17.4 | <10/<20 | 196 | |
| MoO3 | Chemical spray pyrolysis | NO2 | 100 | 200 | 68(%) | 15/150 | 55 | |
| Fe/MoO3 | Hydrothermal | Xylene | 100 | 206 | 6.1 | 20/75 | 117 | |
| Au/MoO3 | Hydrothermal | 1-butyl amine | 100 | 240 | 300 | 23/388 | 197 | |
| In2O3/MoO3 | Hydrothermal + chemical synthesis | TMA | 10 | 260 | 31.69 | 6/9 | 198 | |
| Zn–MoO3 | Hydrothermal | Ethanol | 1000 | 240 | 321 | 15/121 (100 ppm) | 103 | |
| RuO2/MoO3 | Chemical synthesis | TEA | 1 | 260 | 12.8 | 2/10 | 60 | |
| Fe2O3/MoO3 | 2-Step hydrothermal | Xylene | 100 | 233.5 | 22.48 | 4/102 | 104 | |
| CoMoO4/MoO3 | Hydrothermal + dipping-annealing process | TEA | 100 | 220 | 104.8 | <10/<10 | 105 | |
| Au/MoO3 | Hydrothermal + chemical synthesis | TMA | 50 | 280 | 70 | 6/9 | 72 | |
| Pt/MoO3 | Hydrothermal + chemical reduction | Formaldehyde | 200 | RT | 39.3 | 17.8/10.5 (100 ppm) | 73 | |
| W/MoO3 | Hydrothermal | TMA | 50 | 200 | 13.8 | 6/11 | 101 | |
| Pd/MoO3 | Spray pyrolysis + chemical dip | NO2 | 100 | 200 | 95.2(%) | 74/297 | 102 | |
| Cd/MoO3 | Hydrothermal | H2S | 100 | 140 | 378.5 | 23/45 (50 ppm) | 96 | |
| MoO3 | Hydrothermal | TMA | 50 | 240 | 582 | 15/50 (1 ppm) | 99 | |
| Nanoribbon | MoO3 | Hydrothermal | H2 | 1000 | 200 | 14.1 | 21/75 | 100 |
| MoO3/Graphene | Hydrothermal | H2 | 1000 | RT | 20.5 | 10/30 | 106 | |
| MoO3 | Hydrothermal | H2 | 1000 | RT | 17.3 | 10.9/30.4 | 56 | |
| MoO3 | Hydrothermal | H2 | 100 | RT | 3.2a | 3/16 | 107 | |
| MoO3 | Hydrothermal | NH3 | 25 | 450 | 60 | 21/216.9 (5 ppm) | 59 | |
| Nanorod | NiCo2O4/MoO3 | Hydrothermal + chemical deposition | Ethanol | 1 | 350 | 20 | N.G. | 74 |
| Ag–MoO3 | Hydrothermal + chemical reduction | TEA | 100 | 200 | 408.6 | 3/107 | 75 | |
| MoO3 | Hydrothermal | TEA | 100 | 300 | 101.74 | 4/88 | 97 | |
| MoO3/BiVO4 | Hydrothermal + metal organic deposition | TEA | 20 | 125 | 1.86 | 15/110 | 108 | |
| MoO3/GO | Solvothermal + annealing | NH3 | 100 | 200 | 15.3 | 5/84 | 109 | |
| MoO3 | Hydrothermal | NO2 | 20 | 110 | 84 | 20/45 | 110 | |
| h-MoO3 | Chemical bath technique | NH3 | 50 | 200 | 67 | 183/202 | 111 | |
| p-Si/MoO3 | Hydrothermal + physical vapor deposition | CO2 | 100 | 250 | 12.08 | 8/15 | 112 | |
| rGO/MoO3 | Hydrothermal + in situ microwave | H2S | 40 | 110 | 44.7 | 109/36 | 113 | |
| Nanofiber | SnO2/MoO3 | Hydrothermal + wet chemical | CO | 300 | 300 | 2.4 | 1430/1524 | 76 |
| MoO3 | Hydrothermal | Ethanol | 100 | 275 | 25 | 45/138 | 114 | |
| Nanowire | MoO3 | Hydrothermal | H2 | 1.5(%) | 260 | 0.85 | 28/42 (500 ppm) | 82 |
| Microrod | MoO3 | Hydrothermal | Ethanol | 500 | 332 | 8.24 | N.G. | 98 |
| MoO3 | Probe sonication | TMA | 1000 | 200 | 2533 | 8/9 (1 ppm) | 115 | |
| h-MoO3 | Microwave assisted hydrothermal | Acetone | 10 | 200 | 1.48 | 60/500 | 116 | |
MoO3 nanobelts (NBs)
Nanobelts of MoO3 are one of the most prominent 1-D morphologies that have attracted huge attention owing to their single crystalline nature and large aspect ratio. It is due to their faceting nature, which makes NBs suitable candidates for probing size- and dimensionality-dependent physical or chemical phenomena. Yang et al.103 prepared NBs of Zn-doped MoO3 using the hydrothermal (HT) method and demonstrated the ethanol sensing performance. The group prepared the nanocomposites in various Mo/Zn ratios, and the FESEM images in Fig. 1a–f reveal that the increase in the Zn ionic content in the layered MoO3 causes an increase in the spaces between its layers to accommodate more Zn ions, thereby broadening the width of the MoO3 nanobelts. The operating temperature (OT)-dependent response toward 1000 ppm ethanol gas in Fig. 1h reveals that Zn doping in MoO3 not only causes depreciation in the OT by 100 °C but also enhances the response at least 15 times than pure MoO3 NBs. Besides, the response (Tres) and recovery (Trec) transients to different concentrations of ethanol at the OT of 240 °C in Fig. 1i display good reversibility along with a selective response to the ethanol gas was also observed among the other tested gases in Fig. 1j. The improved gas sensing performance was accredited to the increased ethanol concentration, enhanced dehydrogenation progress at a lower temperature, diminishing probability of ethoxy recombination, and the narrowed band gap owing to Zn doping. To further promote the sensing properties and selectivity improvement, the combination of two metal oxides could be an ideal method. For example, Wang and his group60 combined MoO3 NBs with RuO2 nanoparticles by a simple soaking method and demonstrated that the prepared MoO3@RuO2 nanocomposites had superior sensing characteristics. The morphology of the NBs (diameter ∼0.8 μm) was confirmed in the FESEM results as displayed in Fig. 1(k and l); however, no apparent change in the morphology and dimension of the MoO3 NBs was observed on account of the addition of RuO2 nanoparticles (Fig. 1(m and n)). Due to the n-type behavior of pristine MoO3 NBs and MoO3@RuO2 nanocomposites, it was quite evident that pristine MoO3 NBs demonstrated an impressive sensing performance (Fig. 1o) while the electronic movement greatly impacted the resistance of the nanocomposite. While evaluating the sensing response for triethylamine (TEA) gas, the results in Fig. 1p illustrated that an OT dependent response of 9.22 and 71.43 was observed at 260 °C and 300 °C for MoO3 NBs and MoO3@RuO2 nanocomposites, respectively. The transient response curve in Fig. 1q not only illustrated a fast response and recovery (2 s and 10 s) behavior for the prepared nanocomposites but also displayed the benefit of functionalization of pristine MoO3 NBs with RuO2 nanoparticles in enhancing the sensing properties. In addition, the histogram results in Fig. 1r also confirmed the good selective response of the MoO3@RuO2 nanocomposites for TEA gas. The TEA sensing mechanism in Fig. 1o illustrated that the existence of highly catalytic RuO2 NPs significantly increases the resistance of the nanocomposites in air. Also, the O2 molecules in air tend to get absorbed to generate oxide ions while a great mass of electron is trapped onto the oxygen. These electrons flow from MoO3 to RuO2 to generate a potential barrier at their interface, which gets reduced in the TEA atmosphere, thus causing 5 times greater response for the MoO3@RuO2 nanocomposites than that of pure MoO3 NBs.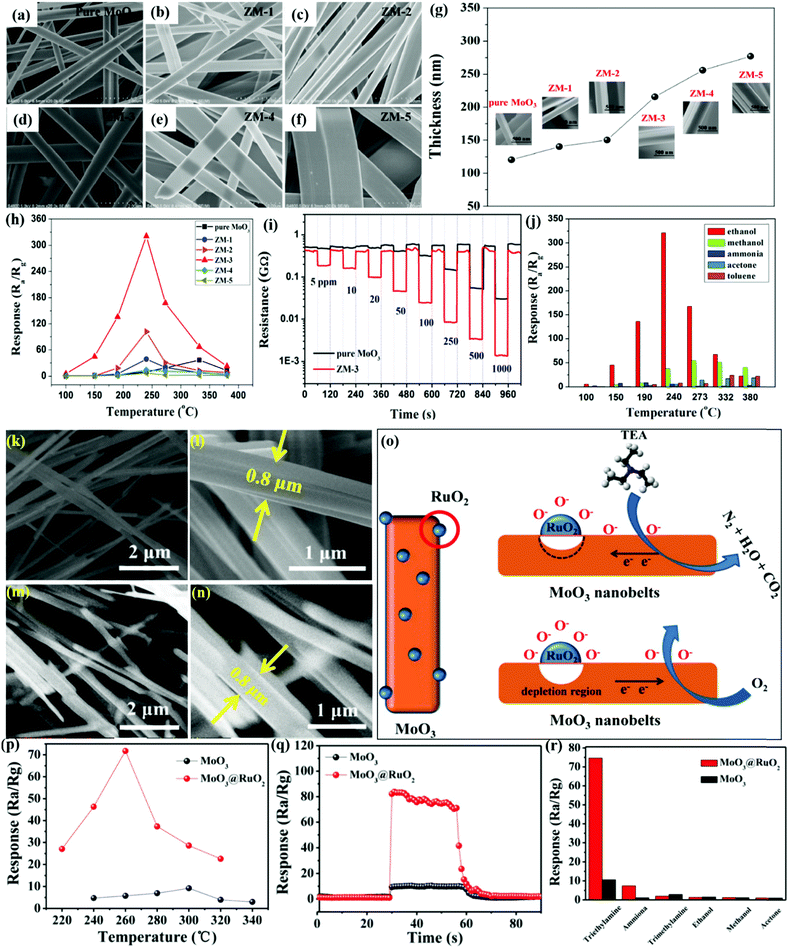 | ||
| Fig. 1 (a–f) FESEM images of pure MoO3 NBs and ZM-1–ZM-5; (g) the average thicknesses of pure MoO3 NBs and Zn-doped MoO3 NBs; (h) gas sensing responses of the sensors based on pure MoO3 NBs and Zn-doped MoO3 NBs to 1000 ppm ethanol at different OTs; (i) response and recovery curves of the sensors based on pure MoO3 NBs and ZM-3 to different concentrations of ethanol at the OT of 240 °C; (j) cross-sensitivity to various gases at different temperatures; reproduced with permission from ref. 103, copyright 2017 Elsevier. (k and l) FESEM images of pure MoO3 NBs; (m and n) FESEM images of RuO2/MoO3 NBs; (o) schematic diagram of the possible gas sensing mechanisms of RuO2/MoO3 NBs; (p) response to 10 ppm TEA gas versus OT; (q) response transient to 10 ppm TEA at 300 °C; (r) responses of pristine and RuO2/MoO3 NBs gas sensors to different gases (10 ppm) at 300 °C. Reproduced with permission from ref. 60, copyright 2019 Elsevier. | ||
Xylene is a toxic and colorless VOC, whose over exposure results in cardiovascular and kidney problems. To detect xylene, the formation of n–n heterostructures is a novel approach, following which the group of Qu et al.104 detected xylene gas by preparing an n–n type heterostructure comprising of Fe2O3 NPs and MoO3 NBs by a two-step HT method. The morphological analysis results in Fig. 2a and b shows that the MoO3 NBs are ∼200–300 nm in width while ∼2–3 mm in length; also, the nanobelt structure of MoO3 was retained even after uniformly doping Fe2O3 NPs (Fig. 2c and d). The sensor response to xylene gas at different OTs in Fig. 2e displayed that although pure MoO3 detected xylene gas at a lower temperature than the Fe2O3/MoO3 NBs, yet the former exhibited a lower maximum response than the nanocomposite. The selectivity results in Fig. 2f reveal that the response to xylene gas was the highest for Fe2O3/MoO3 NBs, and ∼250% improvement in the sensitivity was observed than that using pure MoO3 NBs. The research group attributed the superior sensing performance to the unique n-type heterojunction between MoO3 NBs and Fe2O3 nanospheres. Another example was reported by Wang and co-workers105 on very known p–n heterostructures because of their effective charge separation, long-life of the charge carrier to make them more favorable to achieve high sensor response, and selective sensing toward target analytes. They utilized a simple dipping-annealing process and developed p–n heterojunctions of CoMoO4 and MoO3. The MoO3 NBs were smooth, having 100 nm thickness, 100–300 nm width, and a few micrometers length (Fig. 2g), while the rough surface of CoMoO4/MoO3 nanocomposites in Fig. 2h illustrated the successful growth of the CoMoO4 NPs on the MoO3 NBs. The TEM results in Fig. 2i and j further confirm the uniform dispersion of CoMoO4 nanoparticles (20–50 nm diameter) on the surface of the MoO3 NBs. The sensing results toward triethylamine (TMA) gas in Fig. 2k reveal that the CoMoO4/MoO3 nanocomposites-based sensors show better sensing performance while causing a reduction of 60 °C in the optimum temperature as compared to the pristine MoO3 NBs. The sensing response as a function of TMA concentration in Fig. 2l reveals the stronger response (4-fold) of the nanocomposite to 200 ppm TMA than pure MoO3, while the dynamic responses in Fig. 2m seem to be perfectly repeatable and reproducible during 3 cycles of switch ‘on’ and ‘off’ measurement. It was concluded that the formation of a potential barrier between CoMoO4 (p-type) and MoO3 (n-type), the stronger oxygen adsorption of CoMoO4, and the formation of crystallographic defects all together resulted in superior sensing performance.
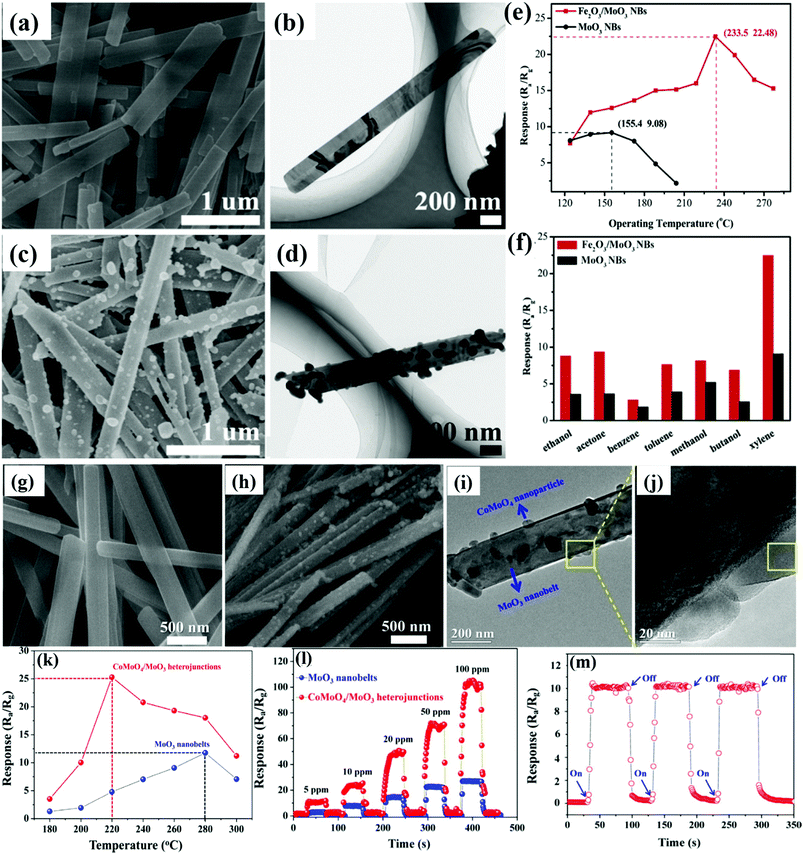 | ||
| Fig. 2 (a and b) SEM and TEM image of pure MoO3 NBs; (c and d) SEM and TEM image of Fe2O3/MoO3 NBs; (e) OT dependent response of the sensors to 100 ppm xylene; (f) response of the sensors to 100 ppm various gases at their optimum OT. Reproduced with permission from ref. 104, copyright 2019 Elsevier. (g) FESEM image of pure MoO3 NBs; (h) FESEM image of the CoMoO4/MoO3 nanocomposites; (i and j) low and high-magnification TEM images of the CoMoO4/MoO3 nanocomposites; (k) response of the sensors to 10 ppm of TMA at different OTs; (l) response and recovery curves toward different concentrations of TMA; (m) response and recovery curves of the sensor based on the CoMoO4/MoO3 nanocomposites to 5 ppm TMA after 3 cycles of gas on and off at 220 °C. Reproduced with permission from ref. 105, copyright 2018 Elsevier. | ||
Noble metal NPs such as Ag, Au, Pt, and Pd, with their outstanding catalytic effect, have been known to improve the sensing attributes of the MoO3 NBs. For instance, Zhang et al.72 prepared catalytic Au NPs doped MoO3 NBs via the hydrothermal method and displayed superior sensing performance to TMA gas. The MoO3 NBs were 100–300 nm wide and 10–20 μm in size (Fig. 3(a and b)), while the FESEM image in Fig. 3c revealed that several Au NPs were stuck on the surface of the NBs. In addition, the HRTEM image in Fig. 3d displayed the non-continuous distribution of Au NPs (diameter ∼10–20 nm) on the MoO3 NBs surface, which confirms the high crystallinity of the MoO3 NBs and Au NPs. The sensing response of the prepared materials toward TMA gas demonstrated an increase-maximum-decay (IMD) type of pattern with the increase in the OT (Fig. 3e). The OT has a considerable impact on the sensing performance of the material owing to the thermal energy of the analyte gas molecule for clearing the energy barrier of the surface reaction and later converting the adsorbed oxygen for further attracting the electrons from the semiconductor. The dynamic response-recovery curves in Fig. 3f displayed a fast response (Tres ∼ 7 s) and recovery (Trec ∼ 10 s) time for Au@MoO3 NBs toward 10 ppm TMA gas. Besides, the as-prepared materials also demonstrated the highest response to the TMA gas (Fig. 3g). Overall, the improved sensing performance was accredited to the catalytic Au NPs, which, with the help of reactive oxygen species, improves the electron exchange process between Au NPs and MoO3.
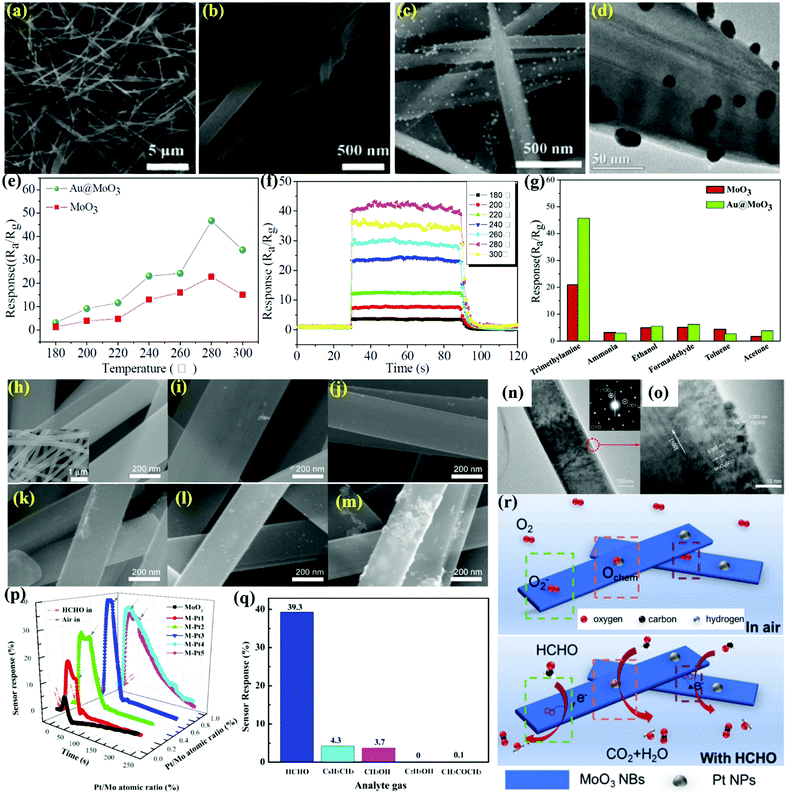 | ||
| Fig. 3 (a and b) FESEM images of pure MoO3 NBs, (c) FESEM image Au@MoO3 nanocomposites; (d) TEM images of Au@MoO3 nanocomposites; (e) response curves of the sensors to 10 ppm trimethylamine gas at different OTs; (f) response and recovery time curves of the sensors based on Au@MoO3 NBs to 10 ppm TMA at different OTs; (g) response values of the Au@MoO3 nanocomposites sensor toward 10 ppm different gases at the working temperature of 280 °C. Reproduced with permission from ref. 72, copyright 2016 Elsevier. (h) The SEM images of the pristine nanowires, the inset picture is a low-magnified SEM image; (i–m) SEM images of Pt/MoO3 NBs; (n and o) TEM images of Pt-decorated MoO3 NBs; (p) the dynamic sensor response of pristine and Pt/MoO3 NBs toward HCHO gas of 200 ppm at 27 °C; (q) sensor response to different gases with concentrations of 200 ppm; (r) the schematic diagram for the HCHO sensing behavior of Pt/MoO3 NBs in air and in HCHO-containing atmosphere. Reproduced with permission from ref. 73, copyright 2019 Elsevier. | ||
In the last couple of decades, the detection of VOCs in indoor environments has received much attention. VOCs are produced as a result of gaseous emission from commonly uses household products such as nail paints, wall paints, furniture, and cleansers, and cause both short- and long-term effects on human health. Formaldehyde (HCHO) is one of the VOCs found in many daily usage products, such as carpets, wood, and other plastic products widely used in every household. There have been several ways to enhance the selectivity of a sensor for a specific VOC and have remained a great topic of interest among researchers. For example, Gu and coworkers73 prepared MoO3 NBs using a facile HT method and surface-decorated them with Pt NPs to illustrate superior sensing response toward HCHO gas. The SEM image in Fig. 3h reveals the width of pristine MoO3 NBs to be ∼200–400 nm with very minute thickness (inset). The other SEM images (Fig. 3(i–m)) further displayed the increasing presence of Pt NPs with its loading amount on the MoO3 NBs. The TEM images in Fig. 3n and o for M-Pt3 (Pt-loading amount = 0.61%) not only confirm the presence of the highly crystalline MoO3 NBs but also reveal the occurrence of small Pt NPs on the surface of the MoO3 NBs. The response results in Fig. 3p expose the poor performance of pure MoO3 NPs, while with the appropriate Pt%-decorated MoO3 (M-Pt3) NBs cause an improved sensing response to formaldehyde gas. An outstanding selectivity to formaldehyde gas among other interferent gases is illustrated in Fig. 3q. The M-Pt3 sensor shows no response to ethanol, while a negligible response of 0.1% acetone was observed. The sensing mechanism in Fig. 3r reveals that the astounding sensing performance was due to the presence of highly catalytic Pt NPs, which reduces the adsorption activation energy of HCHO on the surface of MoO3 and also assists in forming the spillover region around the Pt NPs on the surface of the MoO3 NBs. Overall, according to the research reported by Xu et al.,117 the oxygen species tends to preferably adsorb on Mo5+, causing an increase in the intensity of chemisorbed oxygen on the surface of the NBs, thus enhancing the gas sensing response. In addition, the higher specific surface area of the NBs provides more absorption sites and contributes positively to gas sensor response.
MoO3 nanoribbons (NRbs)
Similar to nanobelts, the nanoribbons (NRbs) morphology has been quite a popular 1-D MoO3 morphology for preparing gas sensors with (especially, hydrogen sensor) great sensing performance in every aspect of response/recovery time, selectivity, stability, etc. In this quest, Yang and coworkers100 prepared α-MoO3 NRbs of various sizes by the HT method at different temperatures. The SEM images in Fig. 4a revealed the NRbs-like morphology wherein the dispersion and average length of the NRbs increase with the HT temperature. The double-layered MoO6 octahedra in α-MoO3 comprise of pentavalent ion Mo5+-induced structural defects, which exhibits high affinity to hydrogen gas (Fig. 4b). The room temperature (RT) response toward hydrogen in Fig. 4c indicated an increase in the sensitivity with the HT temperature. Besides, the response/recovery speed was also found to increase on account of initially treating the sensors in the hydrogen atmosphere (Fig. 4d). The results pointed to the fact that an increase in HT causes an increase in chemisorbed oxygen and Mo5+ concentration. On the other hand, Mo5+ in the α-MoO3 lattice becomes an obvious choice for the absorption of oxygen species; an increase in the Mo5+ concentration with increasing HT leads to the chemisorption of more oxygen species on the NRbs surface (red curve in Fig. 4e), which ultimately enhances the response to hydrogen gas.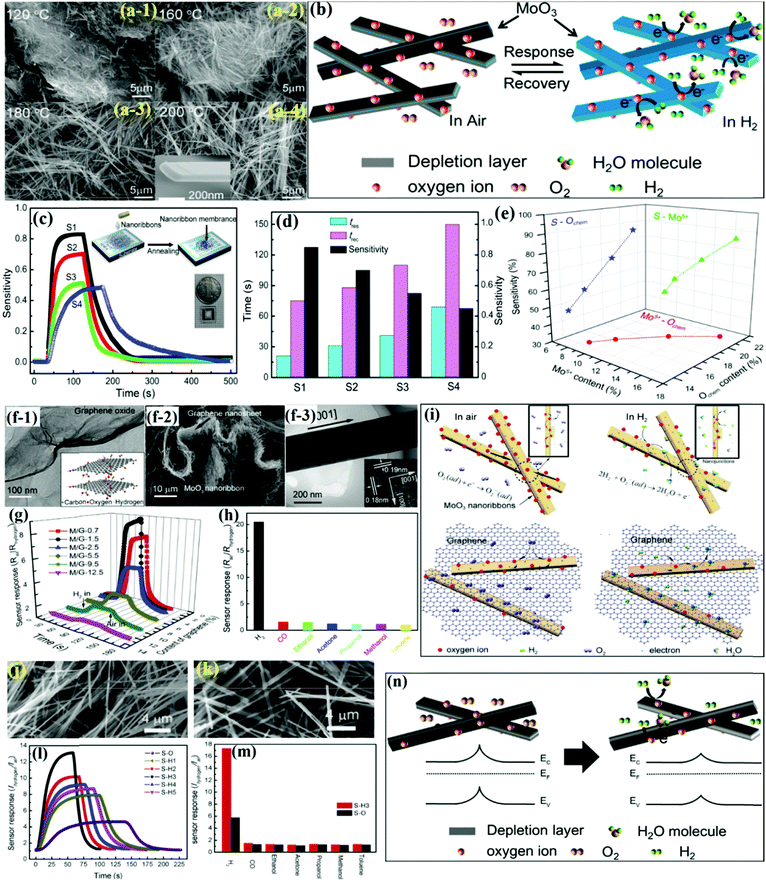 | ||
| Fig. 4 (a) SEM images of the as-prepared samples synthesized at different OT; (b) schematic diagram of the H2 sensing mechanism of MoO3 NRbs; (c) dynamic response of different MoO3 sensors toward 500 ppm of H2; (inset) schematic illustration of the fabrication process of the sensor; (d) sensitivity, response time, and recovery time of different MoO3 sensors; (e) relation among the sensitivity (S), Mo content, and Ochem content of the MoO3 NRbs. Reproduced with permission from ref. 100, copyright 2015 American Chemical Society. (f-1) TEM image and schematic diagram of graphene oxide used as the hydrothermal precursor; (f-2) SEM image of the MoO3 NRbs/graphene nanocomposite; (f-3) HRTEM images of individual MoO3 NRbs; (g) the RT response curves of the MoO3 NRbs/graphene to 500 ppm H2 in air; (h) selectivity to 1000 ppm H2 of M/G-1.5 against other gases with the same concentration; (i) schematic diagram of pure MoO3 NRbs and MoO3 NRbs/graphene under air and H2-containing atmospheres. Reproduced with permission from ref. 106, copyright 2017 Elsevier. (j) SEM images of the original MoO3; (k) SEM image of MoO3 treated at 400 °C; (l) the dynamic response curves toward 750 ppm H2 gas at 25 °C; (m) the selectivity of S-H3 to different gases with concentrations of 1000 ppm; (n) the schematic diagram of the H2 sensing mechanism of the sensor based on MoO3 NRbs both in air and in H2 atmosphere. Reproduced with permission from ref. 56, copyright 2019 Elsevier. | ||
Recently, 2-D materials have mostly been in focus for the development of gas sensors due to their outstanding electronic properties.118–121 A suitable combination of these 2-D material with oxide nanostructures offers spontaneous electron transfer and ensures that the diffusion of gas molecules results in an improvement in the sensor response along with the optimization of the response/recovery times of the gas sensor.122 Yang et al.106 demonstrated a one-step HT method for uniformly loading orthorhombic MoO3 NRbs on the exfoliated graphene oxide (GO) supporting layers (Fig. 4f–1). The SEM image in Fig. 4f–2 revealed that the as-synthesized products were composed of large amounts of NRbs (length ∼10 μm) loaded on the graphene nanosheets, while MoO3 NRbs were also clearly located on either side of the graphene nanosheet, as shown in Fig. 4f–3. The hydrogen sensing responses in Fig. 4g displayed the negligible response of pure graphene nanosheets despite the fact that a little addition of graphene in MoO3 NRbs enhances the response and reduces the Tres/Trec time considerably. The selectivity results for the GO/MoO3 NRbs in Fig. 4h further attest to the fact that the sensor responded perfectly to H2 gas. Such a high response was credited to the formation of innumerable MoO3/graphene heterojunctions (Fig. 4i) and also the high surface area of the nanocomposite as a result of adding the graphene networks, which not only loosened the structure but also enhanced the conductivity of the sensor.
Yang et al.123 also prepared Fe-doped orthorhombic MoO3 (α-MoO3) nanoribbons and demonstrated superior H2 sensing performance. The first-principles density functional theory (DFT) calculations were used to calculate the adsorption of O2 and H2 molecules on the surface of Fe/MoO3 (Scheme 3). It was observed that oxygen was adsorbed parallel to the surface of Fe/MoO3 in three modes, i.e., along the x-axis (mode O-1) with adsorption energy of −0.539 eV, y-axes (mode O-2) with adsorption energy of −0.461, or perpendicular to the plane of the Fe-doped MoO3 (mode O-3) with adsorption energy of −0.673 eV. The results in Scheme 3a reveal that oxygen preferred to adsorb on Fe-doped MoO3 in the O-3 mode. In addition, the H2 molecules adsorbed parallelly to the oxygen ions on the surface of the Fe/MoO3 while interacting with the pre-adsorbed oxygen ions. The difference in the electronic density in Scheme 3b indicated that the charges to the oxygen atoms numbered 1 was −0.09e, and those numbered 2 was −0.06e in the adsorbed oxygen molecule. This causes the transfer of −0.15e from the Fe–MoO3 to the adsorbed oxygen molecule. These theoretical results further confirmed the capturing of the electrons from the adsorbed oxygen on the surface of Fe/MoO3.
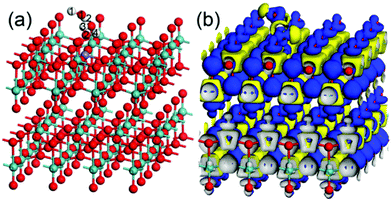 | ||
| Scheme 3 The optimized structure (a) and the electronic density difference (b) of the adsorption of two H2 on Fe-doped MoO3 with one pre-adsorbed oxygen ion. The red, blue, and white balls represent the O, Mo, and H atoms. Reproduced with permission from ref. 123, copyright 2021 Elsevier. | ||
In most cases, metal oxide-based gas sensors operate at high temperatures (100–200 °C), which hinders the monitoring of the gas composition in explosive species environment since high temperatures could trigger an explosion. In this way, RT sensors are more favorable due to low power consumption, simplified manufacturing processes, and reduced operating costs.124–128 Yang et al.56 utilized a simple HT method to prepare MoO3 NRbs and demonstrated superior hydrogen sensing performance. A ribbon-like morphology was observed in the SEM image (Fig. 4j) for pure MoO3 with an average thickness, width, and length of ∼90 nm, 270 nm, and 20 μm, respectively; however, the sample calcined in hydrogen gas atmosphere at 300 °C (Fig. 4k) demonstrated a depreciated size in all the dimensions as compared to the pristine MoO3 NRbs. The room temperature response transients to H2 gas in Fig. 4l revealed a typically n-type sensing performance and a fast response/recovery speed. Besides, the histogram results in Fig. 4m further indicated the excellent selectivity of the MoO3 NRbs sensors toward H2 gas. It was also revealed that the sample annealed in a hydrogen atmosphere was ∼2.5 more responsive to H2 gas compared to pristine MoO3. The reason was the higher concentrations of Mo5+ and chemisorbed oxygen ions in MoO3 treated at 300 °C (Fig. 4n) under hydrogen atmosphere, which triggered the redox reactions due to increased collision between H2 and O2−.
MoO3 nanorods (NRs)
Owing to the obvious advantages offered by the multi-component heterostructures, which included tunable chemical composition and synergistic properties, Yuan et al.74 prepared 1D α-MnO3 NRs using a facile HT method and used them as the backbone for growing porous NiCo2O4 nanosheets (Fig. 5a) via the chemical bath deposition (CBD) method. The FESEM results in Fig. 5b-1 and b-2 for α-MoO3 NRs reveal its clean surface with uniform length (20 μm) and width (200 nm). A cluster of porous NiCo2O4 nanosheets coated on the surface of 1D α-MoO3 NRs (Fig. 5b-3) further indicated a porous and complex surface of the NiCo2O4/α-MoO3 composite. The gas sensing results in Fig. 5c displayed the negligible response of pure 1D α-MoO3 NRs and NiCo2O4 toward ethanol, while the NiCo2O4/α-MoO3 composite indicated a p-type semiconductor behavior. Furthermore, the NiCo2O4/α-MoO3 composite showed good repeatability and excellent stability without any deviation in the response upon alternate purging of fresh air and 1 ppm ethanol vapor (Fig. 5d). The cross-responses to different gases in Fig. 5e also revealed the highest response of the NiCo2O4/α-MoO3 composite toward the gas. The research group attributed the superior response to the unique heterostructure between α-MoO3 and NiCo2O4, which, owing to their different acid–base and reductive–oxidative properties, promote the adsorption and oxidation of ethanol.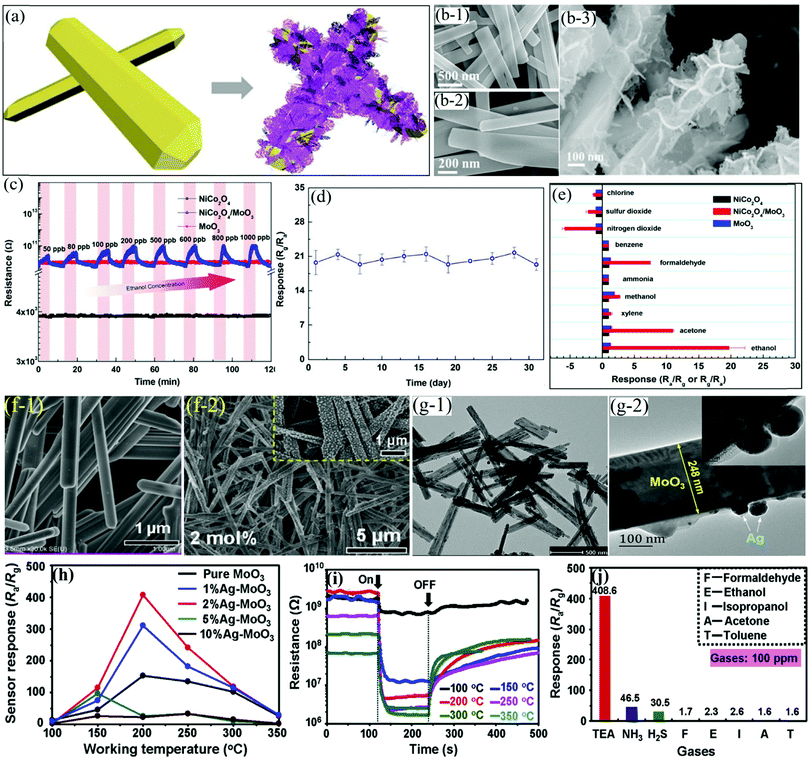 | ||
| Fig. 5 (a) Schematic illustration of the synthesis of the NiCo2O4/α-MoO3 nanocomposite; (b-1 and b-2) SEM image of pristine α-MoO3; (b-3) magnified SEM image of the NiCo2O4/α-MoO3 composites; (c) dynamic response transients to different concentrations of ethanol; (d) long-term stability of the NiCo2O4/α-MoO3 nanocomposites toward 1 ppm ethanol at 350 °C; (e) selectivity toward 1 ppm interfering gases at 350 °C. Reproduced with permission from ref. 74, copyright 2019 Elsevier. FESEM images of the pure α-MoO3 NRs (f-1) and AgNPs-decorated α-MoO3 nanorods (f-2); (g) TEM images of 2%Ag–MoO3; (h) sensing response toward 100 ppm of TEA at varied OT; (i) sensing transients of the 2%Ag–MoO3 sensor toward 100 ppm of TEA; (j) cross-response of 2%Ag–MoO3 at 200 °C. Reproduced with permission from ref. 75, copyright 2019 Elsevier. | ||
As stated earlier, the surface doping of SMOx with noble metals is also considered a brilliant approach owing to their higher catalytic activity.129–134 In particular, Ag NPs, being comparatively cheaper and having higher catalytic performance, have been extensively explored in promoting the sensing performance of oxide-based sensors. Considering this, Tian et al.75 successfully demonstrated the decoration of Ag NPs on the surfaces of α-MoO3 NRs. The morphological results in Fig. 5f-1 reveal the presence of α-MoO3 NRs with smoother surfaces having lengths and diameters of about 10 μm and 200–300 nm, respectively. Ag NPs of ∼20 nm size were clearly observed in the Ag–MoO3 sample (Fig. 5f-2), which was further confirmed in the TEM results in Fig. 5g-1 and g-2. The sensing response results in Fig. 5h unveiled the utility of Ag decoration on pure α-MoO3 for enhancing the response toward TEA gas. The effect of temperature on the dynamic transient response curves (Fig. 5i) pointed out the incomplete recovery of response to its baseline due to the slower desorption of the gases. The cross-response results in Fig. 5j confirm the excellent selectivity of the sensor toward TEA gas among a variety of other tested gases due to the interaction between the basic nature of TEA gas and the acidic MoO3 surface. Besides, the electronic and chemical sensitization of the Ag NPs was also considered as a major factor for realizing the high response of Ag/α-MoO3 NRs.
TEA is, as we know, a toxic, volatile, and explosive gas used in the fish processing industry.4,21 It is, therefore, of utmost importance to design superiorly responsive gas sensors for the real-time detection of TEA at low OT. For example, Yang and coworkers97 utilized a facile hydrothermal method for preparing α-MoO3 NRs (Fig. 6a) for detecting TEA gas at low operating temperatures. α-MoO3 NRs with clean and smooth surfaces and having length of 10 mm and diameter in the range of 200–300 nm are observed in Fig. 6b1–b3. The sensing results for TEA gas in Fig. 6c reveals that MoO3 with NRs-type morphology possesses a higher response than the particle-based MoO3 at the same OT. The histograms revealing the response-recovery time in Fig. 6d concluded that a high concentration of TEA causes the Tres to be less than 10 s with longer recovery times and vice versa. The cross-response results of the sensor for determining its discrimination ability in Fig. 6e revealed that the sensor distinguishably detects TEA gas among other tested gases under identical testing conditions. It was concluded that the high TEA response was not only a result of the attractive forces between the acidic and basic nature of MoO3 surfaces and TEA molecules, respectively, but was also due to the highly active lattice oxygen and fast adsorption/desorption kinetics from the sensor surface.
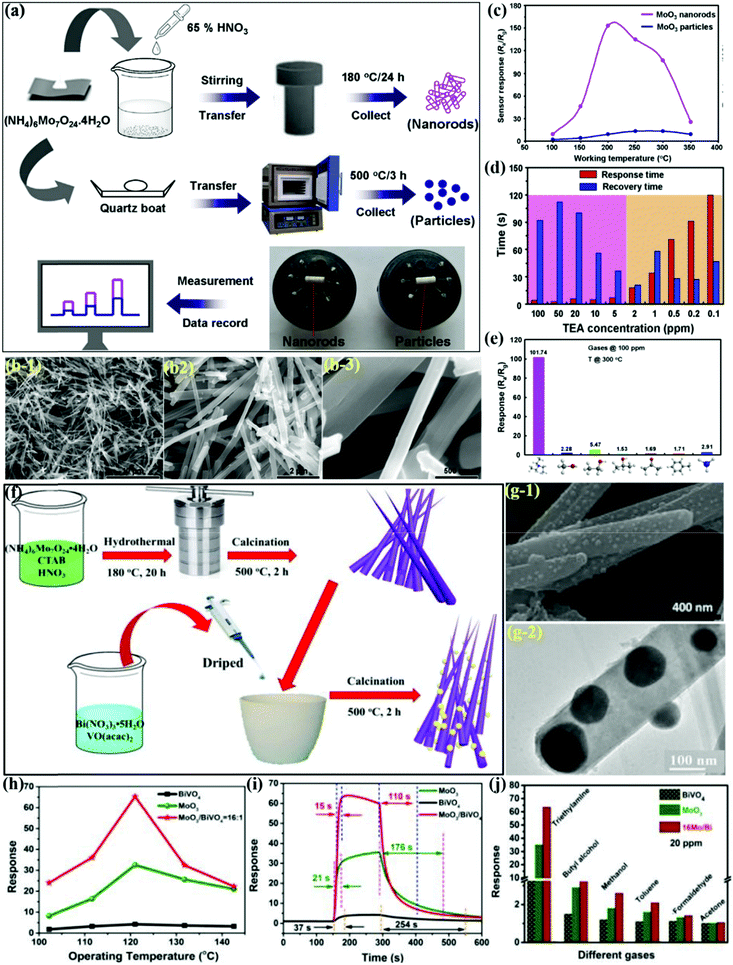 | ||
| Fig. 6 (a) Schematic illustration for the preparation of two MoO3 products and sensing measurement of the actual sensors; (b) FESEM images of the MoO3 NRs; (c) sensor responses to 100 ppm TEA vapor as a function of OT from 100 to 350 °C; (d) response and recovery times of the sensor at various concentrations of TEA gas; (e) sensor responses of the MoO3 NRs to various gases with an identical concentration (100 ppm) at 300 °C. Reproduced with permission from ref. 97, copyright 2019 Elsevier. (f) Schematic diagram of the α-MoO3/BiVO4 composite synthetic process; (g) SEM and TEM image of the 16Mo/Bi composite; (h) responses at different OT to 20 ppm TEA; (i) response-recovery time to 20 ppm TEA; (j) response to 20 ppm of different gases at 125 °C. Reproduced from ref. 108, copyright 2020 with permission from the Centre National de la Recherche Scientifique (CNRS) and The Royal Society of Chemistry. | ||
As discussed earlier, heterostructure formation plays a key role in the interface to enhance the sensing performance.21,135,136 Therefore, designing 1D-MoO3 heterostructures with appropriate counterparts is of great importance in order to achieve excellent TEA sensing performance. Thus, it was further revealed by Bai et al.108 that α-MoO3 can dissociate the C–N bond present in TEA at the desired temperature. They synthesized the n–n heterojunction of α-MoO3/BiVO4via the metal–organic decomposition method (Fig. 6f) and showed improved sensitivity toward TEA gas. The SEM and TEM results in Fig. 6g-1 and g-2 clearly show the development of the BiVO4/MoO3 composite as nanorods and also the growth of BiVO4 nanoparticles on MoO3 nanorods. The response curves in Fig. 6h showed an IMD trend for all the materials; however, the response of the BiVO4/MoO3 composite was much better than that of others. However, the longer Trec for the BiVO4/MoO3 composite was due to the strong binding of the TEA molecules on the surface of α-MoO3, which ultimately resulted in a poor desorption rate (Fig. 6i). In the end, the excellent selectivity results in Fig. 6j pointed to the fact that TEA, due to its lower C–N bond energy, gets oxidized very easily. It was finally concluded that the n–n heterostructured MoO3/BiVO4 composite was primarily responsible for the increased sensor response.
MoO3 nanofibers (NFbs)
Recently, wet chemical approaches and electrospinning methods have increasingly become popular for the preparation of SMOx NFbs as they allow the creation of nanostructures with multiple configurations and morphological features. In line with this, Guo et al.76 prepared SnO2-doped MoO3 NFbs (diameter ∼100 nm) by using a wet-chemical method for the detection of carbon monoxide (CO) gas by screen printing the NFbs on alumina substrates (Fig. 7a). The response transients in Fig. 7b reveals the good reversible behavior of SnO2/MoO3 under alternative purging of CO and N2 gases. The concentration-based sensing results in Fig. 7c displayed increasing response with the increment in the CO concentration. Besides, SnO2/MoO3 with NFbs morphology exhibited ∼2-folds response to 300 ppm CO than pristine α-MoO3 NBs. The selectivity histograms in Fig. 7d revealed that the nanocomposite sensor showed a better response to CO gas owing to its fine nanofiber diameter and high S/V ratio. The inset SEM image shows that the SnO2/MoO3 nanocomposite exhibits diversely oriented fibers with the diameter and length in the range of 20–100 nm and 2–8 μm, respectively. It was later concluded that SnO2 doping assisted in enhancing the sensing performances at low OTs, while the unique NFbs morphology of the SnO2/MoO3 nanocomposite and the acidic nature of the doped NFbs improved the sensitivity of the SnO2-doped MoO3 NFbs.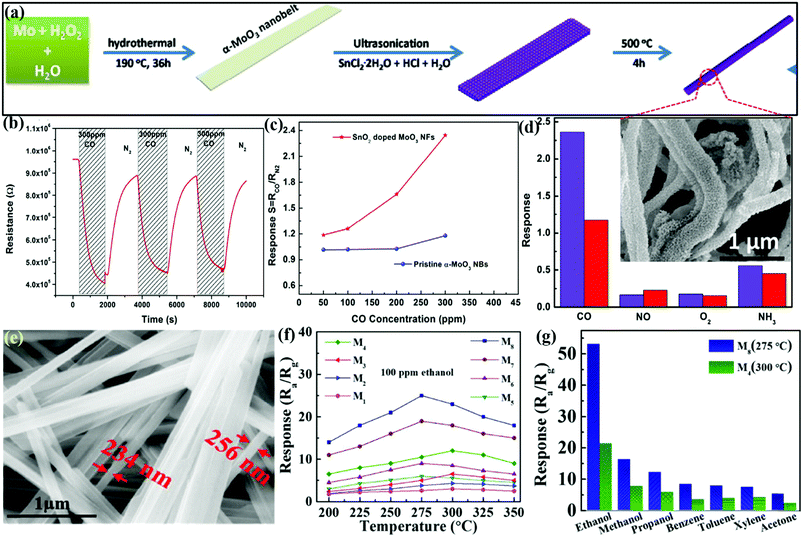 | ||
| Fig. 7 (a) Schematic illustration of the growth mechanism of SnO2-doped MoO3 NFbs; (b) response–recovery curves of SnO2-doped MoO3 NFbs at 300 °C; (c) responses as a function of the CO concentration at 300 °C; (d) selectivity of pristine α-MoO3 NBs (red) and SnO2/MoO3 NFbs (blue) toward various gases of 300 ppm at 300 °C, (inset) high-magnification SEM micrographs of SnO2/MoO3 NFbs. Reproduced with permission from ref. 76, copyright 2017 Elsevier. (e) SEM image of M4 grown at a constant temperature; (f) response of M1–M8 devices in exposure to 100 ppm ethanol at different OTs; (g) selectivity study toward 200 ppm of different VOCs. Reproduced with permission from ref. 114, copyright 2019 Elsevier. | ||
In another work, Mondal et al.114 tailored highly crystalline and ultra-long MoO3 NFbs by applying the temperature pulsing method during HT growth. The SEM image in Fig. 7e demonstrates the presence of highly crystalline ultra-long nanofibers having several tens of micrometer of length and width in the range of 200–300 nm. The sensing results in Fig. 7f confirmed that MoO3 with NFbs morphology (M5–M8) possesses better response at lower operating temperature than MoO3 with the NBs structure (M1–M4) toward ethanol gas. Owing to the high surface area and more surface defects in MoO3 NFbs, a high selectivity (Fig. 7g) to ethanol gas was observed among the other tested VOCs. At last, it was concluded that the large surface area and presence of surface defects were the prime reasons for the improved sensing performance of the MoO3 NFs.
MoO3 nanowires (NWs)
Metal oxide nanostructures as nanowires offer a great alternative for low-concentration sensing performance and their conventional processing enables integration with electronic devices for large-scale production. Luo et al.82 utilized the HT method to prepare ultra-long α-MoO3 NWs-based flexible nanowire paper (size ∼200 mm × 300 mm) on a hydrophobic substrate. The NWs (Fig. 8a) demonstrated high crystallinity, good dispersion, long length (∼1 mm), uniform diameter (∼300 nm), and good sensitivity toward H2 gas. The results in Fig. 8b reveal the increasing response of the sensor (prototype of the H2 sensor in the inset) with temperature in the range of 230–260 °C. The response/recovery transient curve in Fig. 8c accounts for fast Tres and Trec and matches well with commercial grade sensors for the detection of H2 leakage. Besides, the α-MoO3 NWs paper sensor was found to have excellent repeatability (Fig. 8d) wherein the sensitivity, Tres, and Trec are nearly unchanged even after seven repeated cycles. The sensor perfectly detected lower concentration of H2 gas (below 1.5%); however, Tres and Trec were increased at these lower concentrations (Fig. 8e). The high H2 sensing response was attributed to the high specific surface and porous structures of the NW paper, which eases the absorption of O2 molecules on the sensor surface.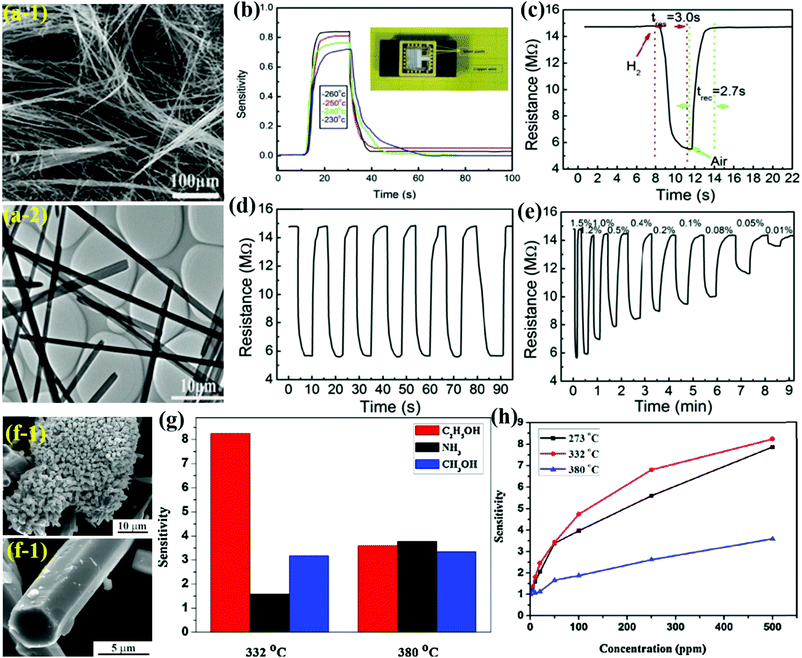 | ||
| Fig. 8 (a) SEM and TEM images of the as-synthesized α-MoO3 NWs; (b) the sensitivities of different sensors to 1.5% H2; (c) response–recovery of the sensor to 1.5% H2. (d) Repeatability toward 1.5% H2; (e) dynamic response resistances of the flexible NWs paper for different H2 concentrations (100 ppm – 1.5%). Reproduced with permission from ref. 82, copyright 2017 Elsevier. (f) Typical SEM image of h-MoO3 MRds; (g) the selectivity of the h-MoO3 MRds gas sensor to 500 ppm gases at the OT of 332 °C and 380 °C; (h) sensitivity of the sensors based on h-MoO3 MRds to the exposure of different concentrations of ethanol at different OTs. Reproduced with permission from ref. 98, copyright 2015 Elsevier. | ||
MoO3 microrods (MRds)
Similar to nanorods, the morphology of microrods (MRds) provides more surface-to-volume ratio to achieve rapid adsorption–desorption results with high sensitivity at low concentrations. Liu et al.98 utilized a facile hydrothermal route to prepare hexagonal MoO3 from peroxomolybdate solution in the presence of NH4Cl. The SEM image in Fig. 8f confirmed a rod-like morphology for h-MoO3 MRds with the length and diameter in the range of 12–25 μm and 1.0–3.5 μm, respectively. The selectivity of the h-MoO3 MRds in Fig. 8g demonstrated excellent response to ethanol gas among a variety of other tested gases. The sensing results in Fig. 8h divulge that the h-MoO3 MRds sensor possesses a detection limit of 5 ppm for ethanol and increases with the concentration of ethanol gas.Two-dimensional (2-D) MoO3 nanostructures for gas sensors
2-D materials have become increasingly popular due to their sheet-like structures, nanoscale thickness, and high S/V ratio.4,14,20,134,137–139 As a 2-D carbon nanosheet, graphene, since its discovery, has exhibited important physico-chemical properties, which make it a hotpot material in many technologically important applications, including solar photovoltaics, energy materials, and medicine, and has ignited a quest in discovering other materials that are analogous to graphene in terms of their structure and properties.5,13,14,20,140,141 The research efforts have progressed with a great pace and a variety of inorganic graphene analogues having layered structures have been developed, which include oxides (TiO2, SnO2, WO3, MoO3, etc.), chalcogenides (MoSe2, WS2, WSe2, etc.), and a few perovskite-like crystals with sensing applications.33,142,143 2-D materials are strong adsorbents of organic molecules, and at high temperatures, they tend to partially lose oxygen to become oxygen-deficient; thus, they are considered as the most suitable candidates in VOCs sensing.144 Among the various 2-D nanostructures of MoO3, nanosheet,64,80,81,145 nanoflake,146–148 nanoplate,79,149,150 nanolamella,151 nanopaper,152 thin film,153–156 microsheet157 and microplanks158 morphologies of MoO3 have recently received great research interest in gas sensing applications as they can be used in designing nanodevices with desired crystal orientation due to their anisotropic structures. An overview of gas sensors based on 2-D MoO3 nanostructures is given in Table 2.| Class | Material | Synthesis route/morphology | Gas | Conc. (ppm) | Operating temp. (°C) | Response | Resp./Reco. time (s/s) | Ref. |
|---|---|---|---|---|---|---|---|---|
| a Not given. | ||||||||
| Nanosheet | MoO3 | Grinding + sonication | Alcohol | 100 | 300 | 33 | 21/10 | 80 |
| MoO3 | Hydrothermal + calcination | Xylene | 10 | 400 | 9.1 | 7.1/6.8 | 81 | |
| MoO3 | Solvothermal + annealing | TMA | 50 | 133 | 51.47 | 12/200 | 64 | |
| Au/MoO3 | Hydrothermal + calcination + chemical reduction | Ethanol | 200 | 280 | 169 | 22/5 | 145 | |
| Nanoflake | MoO3/rGO | Hydrothermal + calcination | Ethanol | 100 | 310 | 53 | 6/54 | 146 |
| MoO3/SnO2 | Chemical synthesis | H2S | 10 | 115 | 43.5 | 22/10 | 147 | |
| Au/MoO3 | Thermal evaporation + sputtering | H2S | 15 | 400 | 260 | 60/480 | 148 | |
| Nanoplate | MoO3 | Chemical synthesis | Ethanol | 800 | 300 | 58 | 10a/40a | 149 |
| MoO3 | Polymeric solution method | NO2 | 100 | 250 | 47.9 | N.G. | 150 | |
| Nano lamella | Ni/MoO3 | Solvothermal | Formaldehyde | 100 | 255 | 41 | 4/12 | 151 |
| Thin film | MoO3/V2O5 | Chemical spray pyrolysis | NO2 | 100 | 200 | 80(%) | 118/1182 | 154 |
| MoO3 | Hydrothermal | Ethanol | 100 | 260 | 23(%) | 111/66 | 155 | |
| Microsheet | MoO3 | Hydrothermal + thermal oxidation | TEA | 100 | 275 | 27.1 | 3/50 | 157 |
| Micro plank | MoO3 | Chemical synthesis | CO | 100 | 150 | 74.87 | 80/110 | 158 |
MoO3 nanosheets (NSs)
2-D layered MoO3 with a sheet-like structure has emerged as a model oxide material due to its excellent sensing properties toward a range of VOCs. Liu et al.80 exfoliated bulk α-MoO3 into single and few-layer NSs using grinding and sonication methods (Fig. 9a-1) and they observed an enhanced sensing feature for 2D-MoO3 NSs as compared to its bulk powder counterpart. The sensor structure and the equivalent circuit model for sensor testing are demonstrated in Fig. 9a-2. The dimensions of the MoO3 NSs in the range of 10–100 nm were deduced from the TEM images (Fig. 9b-1), whereas the HRTEM image in Fig. 9b-2 shows the multi-layer edges near the periphery of these NSs, unveiling their 2-D structure. The operating temperature response (Fig. 9c) of bulk MoO3 and MoO3 NSs obtained from different sonication solvents toward 100 ppm alcohol vapor reveal the higher response of MoO3 with NSs morphology. Similar results were also observed in Fig. 9d, wherein the MoO3 NSs exhibited faster response and recovery speed than bulk MoO3. The histogram representing the cross-sensitivity of the MoO3 NSs in Fig. 9e clearly shows that the sensor possesses better response to alcohol among other VOCs. This increased sensing performance of the MoO3 NSs is attributed to its layered structure, offering enhanced surface area and more reactive sites. Contrary to using the exfoliation strategy from single-crystal MoO3, Wang and coworkers81 used a facile hydrothermal technique to prepare MoS2 NSs and calcine them at different temperatures to obtain MoO3 NSs with varied thickness. The SEM micrograph in Fig. 9f reveals the formation of NSs with uniform and smooth surfaces. The sensing results in Fig. 9g present that the MoO3 NSs detect xylene gas at higher OT than the MoS2 NSs, while the MoO3 calcined at 400 °C (MoO3 NSs-4) shows maximum response among the various MoO3 NSs structures calcined at different OTs. The response/recovery performance of MoO3 NSs-4 studied in Fig. 9h toward 10 ppm xylene showed quicker Tres and Trec for the sensor. Further, the cross-sensitivity results of the sensor in Fig. 9i demonstrated its excellent selectivity toward xylene gas among a variety of other interfering gases. It was finally concluded that the excellent sensitivity was mainly due to the larger SSA, causing increased adsorption of oxygen and the intrinsic porous structure, which results in abundant surface defects.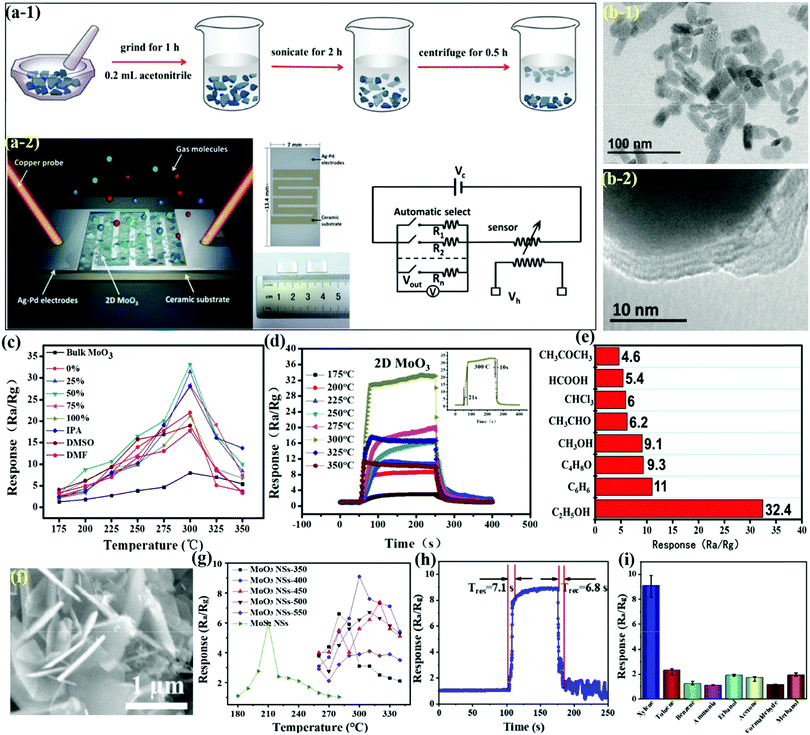 | ||
| Fig. 9 (a-1) Three-step liquid exfoliation process; (a-2) schematic illustration of the fabricated sensor and the image of the operation principle; (b) TEM image showing the layered nature of the MoO3 NSs; (c) the results of sensor response using bulk MoO3 and MoO3 NSs toward 100 ppm alcohol vapor at different OTs; (d) transient sensor response toward 100 ppm alcohol vapor at different temperatures, (inset) response and recovery curves at its optimum OT; (e) responses of sensors made of MoO3 NSs toward 100 ppm VOCs. Reproduced with permission from ref. 80, copyright 2016 Royal Society of Chemistry. (f) SEM images of the MoO3 NSs-400 samples; (g) sensor responses at varied OTs toward 10 ppm xylene; (h) response/recovery curve of the MoO3 NSs sensor toward 10 ppm xylene at 300 °C; (i) responses of the MoO3 NSs sensor to 10 ppm of different gases at 300 °C. Reproduced with permission from ref. 81, copyright 2020 Elsevier. | ||
Another poisonous and colorless VOC, i.e., TMA, has drawn significant attention because initially, the smell seems pungent but it can rapidly paralyze the olfactory system and cause unawareness and headache. Shen and coworkers64 detected TMA by developing porous α-MoO3 ultrathin NSs using a one-step solvothermal (ST) route, followed by calcination. The main process of the synthetic procedure and the NSs (size between 500 and 800 nm) obtained at different calcination temperatures are presented in Fig. 10a. The OT-based response of α-MoO3 NSs to 50 ppm TMA in Fig. 10b depicts an IMD trend for all the materials, yet the NSs obtained at 400 °C calcination temperature shows the highest response among others. The cross-sensitivity results (Fig. 10c) of α-MoO3-400 to different gases revealed that the response to TMA gas was way higher than to the other test gases. In addition, the sensor displayed minute fluctuation to TMA gas (Fig. 10d) over the course of 3 months, indicating its great stability and reproducibility. This high response was accredited to the porous and ultrathin configuration of α-MoO3-400, which provides numerous active sites for the adsorption of TMA molecules faster on the sensor surface. The adsorption energies for TMA and O2 on α-MoO3 NSs were estimated to be −2.16 and −0.5 eV, respectively, by DFT calculations. The results in Scheme 4a1 and b1 display that the energetically favorable adsorption positions of TMA on α-MoO3 and the α-MoO3 containing O-vacancy (Ov-α-MoO3) are Mo atom and O-vacancy, respectively. Due to the steric hindrance, TMA is primarily physically adsorbed on two oxygen atoms and forms a bridge-like structure (O-TMA-O) in TMA-Ov-α-MoO3. The adsorption energies of TMA on α-MoO3 and Ov-α-MoO3 are −2.16 and −0.25 eV, respectively. The density of states (DOS) results in Scheme 4b1 and b2 exhibit that on introducing the oxygen vacancy, the Fermi level enters the conduction band, thus causing a lowering of the band gap of TMA-Ov-α-MoO3 than that of TMA-α-MoO3. Since the smaller band gap is more favorable for electron transfer, the TMA states appear in the conduction band near the Fermi level, indicating that the interaction between TMA and Ov-α-MoO3 is enhanced.
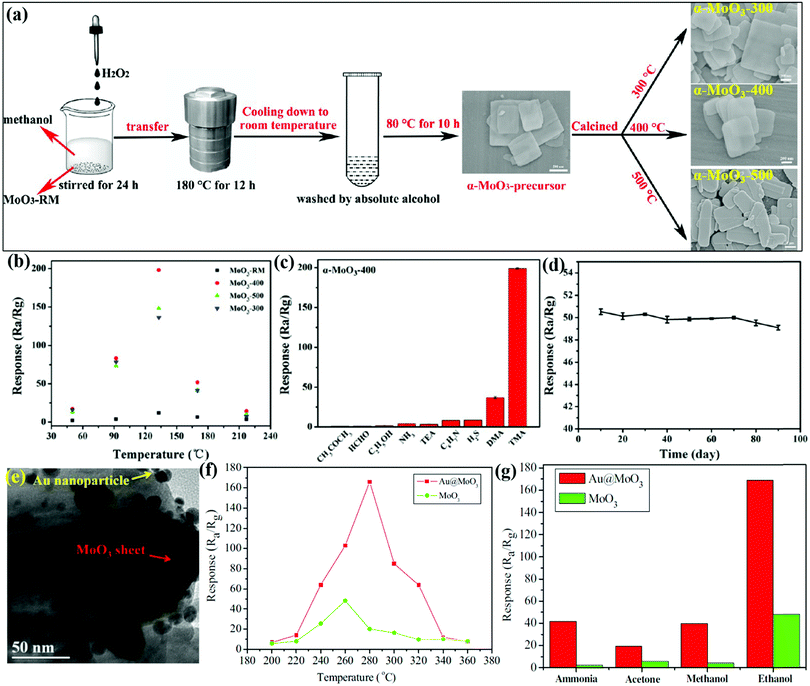 | ||
| Fig. 10 (a) Schematic diagram for the preparation of α-MoO3 along with the SEM images of different materials; (b) responses versus the OT to 50 ppm TMA gas; (c) responses versus 50 ppm of various gases at 133 °C; (d) responses of the α-MoO3-400 sensor to 10 ppm TMA at 133 °C for 90 days. Reproduced with permission from ref. 64, copyright 2019 American Chemical Society. (e) TEM images of Au@MoO3 nanocomposite samples; (f) response to 200 ppm ethanol at different OTs; (g) gas responses to 200 ppm of the test gases at 280 °C. Reproduced with permission from ref. 145, copyright 2016 Elsevier. | ||
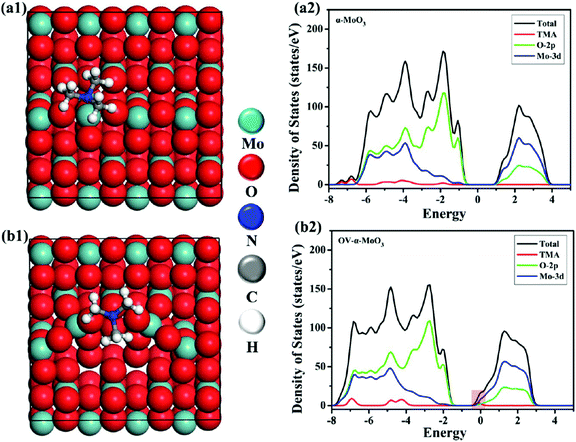 | ||
| Scheme 4 Structures (top view) of TMA-α-MoO3 (a1) and TMA-Ov-α-MoO3 (b1). The density of states of TMA-MoO3 (a2) and TMA-Ov-MoO3 (b2). Reproduced with permission from ref. 64, copyright 2019 American Chemical Society. | ||
Surface modification with noble metals is a known practice in the sensing field. Essentially, noble metal NPs can facilitate the adsorption of oxygen molecules and accelerate the transfer of electrons to metal oxide surfaces.34 For instance, the Yan et al.145 used a chemical reduction method for depositing Au NPs onto the MoO3 surface to prepare Au-loaded MoO3 NSs. The TEM image in Fig. 10e displays the average distribution of Au NPs of size 10–15 nm on the surface of MoO3 NSs. The temperature-dependent response curves for ethanol in Fig. 10f exhibit an ‘increase-maximum-decrease’ tendency, whereas the Au@MoO3 NSs possess ∼12 times better response than that of pristine MoO3. The same behavior is illustrated in Fig. 10g, wherein the Au@MoO3 NSs show the highest response toward ethanol gas, among others. This high sensing response is accredited to the presence of highly catalytic Au NPs, which assist in enhancing gas diffusion on the sensor surface.
MoO3 nanoflakes (NFks)
Compared to 1D architectures, 2D nanoflakes can provide more efficient electron transport and better mechanical stability due to fewer grain boundaries. In addition, nano-flakes allow surface reactivity and selectivity to be tuned through crystal facet engineering. Tang et al.146 developed MoO3 NFks-coupled reduced graphene oxide (MoO3-rGO) composites for detecting ethanol gas. The preparation process in Fig. 11a reveals that ultrathin MoS2–GO were prepared first via the HT method, which upon calcination under optimum temperature leads to the formation of MoO3-rGO NFks. The SEM micrograph of MoO3-rGO in Fig. 11b-1 presents NFks kind of morphology having a diameter in the range from nanometer to micrometer, while the TEM image in Fig. 11b-2 confirms the even distribution of NFks having a diameter 190 nm. These unique 2D NFks of MoO3-rGO assist in high sensing response toward ethanol gas. The OT dependent response in Fig. 11c indicates the high sensitivity of the MoO3-rGO sensor against pure MoO3 due to the slightly large SSA of MoO3-rGO than that of MoO3. Besides, the cross-sensitivity results in Fig. 11d present the excellent sensitivity and selectivity of the MoO3-rGO sensor to ethanol gas, which is attributed to the high volume of Mo5+ in the nanocomposite as compared to pristine MoO3. In addition, the presence of GO substrates in MoO3-rGO offers large surface accessibility and fast carrier transport, which facilitates gas analyte adsorption/diffusion and transport across the sensor surface, while the defects or edge areas in GO also majorly contribute to the adsorption of the gas molecules.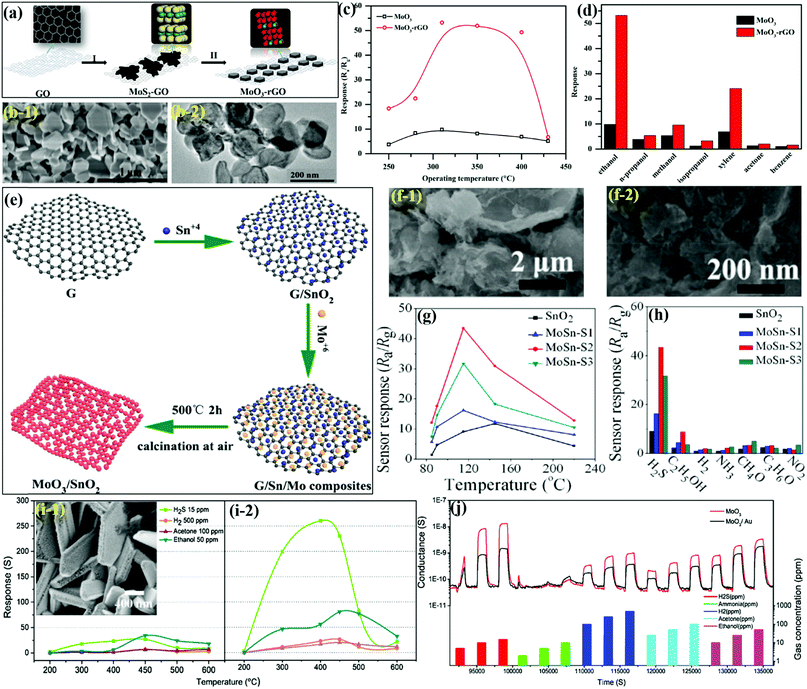 | ||
| Fig. 11 (a) Schematic diagram of the preparation of MoO3-rGO; (b) SEM and TEM images of MoO3-rGO; (c) response to 100 ppm of ethanol under different OTs; (d) response of the sensors toward different VOCs. Reproduced with permission from ref. 146, copyright 2019 Elsevier. (e) Illustration for the preparation process of MoO3/SnO2 NFs; (f) SEM images of MoSn-S2; (g) sensor responses to 10 ppm H2S concentration; (h) response to 10 ppm of various test gases. Reproduced with permission from ref. 147, copyright 2019 American Chemical Society. (i) Response toward various gases at different OTs. (Left) Pure MoO3 NF and (Right) Au–MoO3 NFks, (inset) SEM image of Au–MoO3 NFks; (j) dynamic response of Au–MoO3 toward H2 (100, 250, 500 ppm), acetone (25, 50, 100 ppm), and ethanol (10, 25, 50 ppm) at 450 °C. RH = 40% at 20 °C, with an applied voltage equal to 1 V. Reproduced with permission from ref. 148, copyright 2018 Elsevier. | ||
Considering the potential of the heterostructured nanocomposites consisting of two or more types of metal oxides due to their individual synergetic effect in enhancing the sensing response,31,159,160 Gao and coworkers147 prepared porous MoO3/SnO2 NFks using graphene sheets (G) as sacrificial templates (Fig. 11e) and revealed the excellent sensing performance toward H2S, which is a poisonous, corrosive, and flammable gas. The SEM micrographs of MoO3/SnO2 NFks in Fig. 11f demonstrated the presence of an agglomerated structure with porous SnO2 NFks (diameter ∼8–12 nm). The results in Fig. 11g present that the MoO3/SnO2 NFks demonstrate better sensing properties (∼5 times response) than that of pure SnO2, that too at lower working temperature. The cross-sensitivity results in Fig. 11h further attests to the superior sensing response of the MoO3/SnO2 NFks to H2S gas as compared to the pure SnO2-based sensor. The superior sensing response of the MoO3/SnO2 NFs was credited to the presence of a large surface area and n–n heterojunctions, which favor faster gas diffusion, thus resulting in improved H2S sensing performance. In another work, the group of Comini et al.148 utilized an evaporation-condensation method to prepare Au-loaded MoO3 NFks for the detection of H2S gas. Owing to the smaller dimension and better separation, a large number of H2S molecules became absorbed on the surface of Au–MoO3 NFks, ultimately resulting in enhanced sensing performance. The TEM micrographs in the inset of Fig. 11i reveal the clear presence of homogenized Au NPs (diameter ∼10–12 nm) on the surface of the MoO3 NFks. The OT dependent response of pure MoO3 NFks (Fig. 11i-1) and Au–MoO3 NFks (Fig. 11i-2) indicated the increased response of the MoO3 NFks with Au functionalization. The results further revealed 10 times better response for the Au–MoO3 sensor than pure MoO3 NF, while the optimum OT was reduced from 450 °C to 400 °C. The dynamic response/recovery transients in Fig. 11j depict the excellent reversible response, which, when exposed to reducing gas, increased and restored the initial values on account of exposure to natural air. From the results, it was concluded that the Au–MoO3 NFks, owing to their enhanced surface area and formation of Schottky barriers at the interface between Au and MoO3, promote gaseous oxygen dissociation, which ultimately resulted in enhanced sensor response toward H2S gas.
MoO3 nanoplates (NPts)
Nanoplates have been actively used as sensing elements in sensing devices and are mainly synthesized via wet chemical approaches such as hydrothermal or solvothermal due to their simple operation, low cost, and controlled morphology. Chen and coworkers149 developed α-MoO3 NPts using molybdate-based inorganic–organic hybrids and demonstrated their superior sensing performance toward ethanol gas. The TEM image in Fig. 12a displays several overlapping quadrilateral plates (average length ∼1–2 mm). The sensitivity of the α-MoO3 NPts as a function of the concentrations in Fig. 12b presents the highest response of the sensor to ethanol vapors among other tested reagent vapors. The response of the α-MoO3 NPts sensors to ethanol versus the OT in Fig. 12c shows that the OT causes no apparent influence on the response in the low concentration range, whereas, in the higher concentration region, the α-MoO3 NPts show better sensitivity at lower temperatures.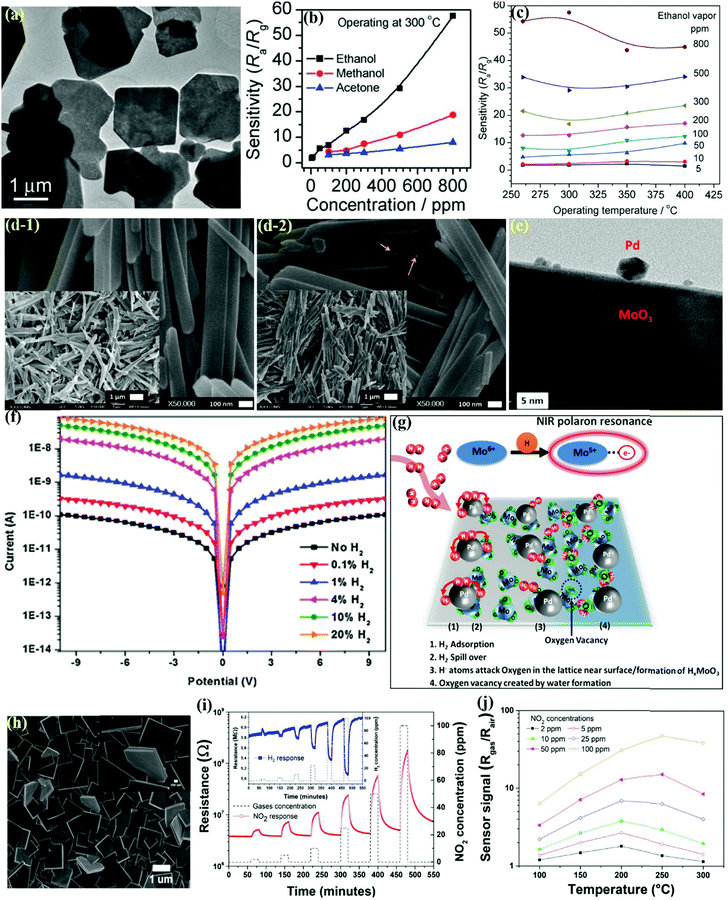 | ||
| Fig. 12 (a) TEM image of α-MoO3 NPts; (b) the sensitivities of the α-MoO3 NPts sensors as a function of the concentrations of different reagent vapors; (c) the sensitivity changes of the α-MoO3 NPts sensors at various OTs under ethanol vapor in the concentration range of 5–800 ppm. Reproduced with permission from ref. 149, copyright 2011 Royal Society of Chemistry. (d-1) SEM images of MoO3; (d-2) SEM image of the MoO3-Pd nanocomposite. The insets show the corresponding low-resolution images; (e) HRTEM image of the MoO3–Pd nanocomposite; (f) current–voltage characteristics of the MoO3–Pd nanocomposite in the presence of different concentrations of H2 gas at RT; (g) proposed mechanism of the interaction of H2 gas with the MoO3–Pd nanocomposite. Reproduced with permission from ref. 79, copyright 2017 Elsevier. (h) SEM image of the as-grown MoO3 nanostructures prepared on silicon substrates at 400 °C for 1 h with 3-layer depositions; (i) transient gas sensing response as a function of the NO2 concentration at 250 °C for the layered α-MoO3 nanoplates, (inset) transient H2 sensing response as a function of the concentration at 250 °C; (j) sensor signal as a function of the OT at different NO2 concentrations. Reproduced with permission from ref. 150, copyright 2020 Royal Society of Chemistry. | ||
In addition, UV light illumination is one of the alternative ways to improve the recovery speed. On illuminating the sensor with UV light, the adsorbed oxygen ions on the surface are removed, thus providing a clean surface with more fresh interaction sites that are readily available for interaction with the target gas. Using this method, Kalanur et al.79 prepared an H2 sensor by depositing Pd NPs on hydrothermally synthesized MoO3 NPts. The SEM images in Fig. 12d-1 for pure MoO3 NPts revealed their length, width, and thicknesses to be in the range of 1–4 μm, 100–150 nm, and 10–20 nm, respectively. Also, the NPts-type morphology of MoO3 was found to remain unchanged after Pd deposition and UV exposure (Fig. 12d-2). The TEM image (Fig. 12e) further supported the SEM results wherein the Pd NPs (diameter ∼5–20 nm) were clearly deposited on the smooth surface of MoO3. The RT I–V characteristics of the sensor in open air (Fig. 12f) displayed that the current level increased with H2 concentration. The studied mechanism in Fig. 12g indicated the chemochromic effect as a result of the structural changes from H2 gas. This indicated the co-occurrence of oxygen vacancies and water molecules in the MoO3 crystal. Due to the spillover effect, the Pd NPs dissociate the absorbed H2 molecules into H2 atoms, which are transferred onto MoO3 NPts and assisted in generating oxygen vacancies.
Air quality issues caused by exhaust gases from rapid industrialization have become a serious problem worldwide in recent years.161 In particular, nitrogen dioxide (NO2), which causes photochemical smog and acid rain, is one of the toxic gases emitted during combustion in industries. The high risk of respiratory and lung diseases will increase when exposed to this gas. Therefore, a reliable NO2 sensor for air quality monitoring is needed; in this regard, Felix and coworkers150 utilized a facile polymeric solution method to prepare rectangular α-MoO3 NPts and demonstrated good NO2 sensing performance. The SEM image in Fig. 12h illustrated well-faceted rectangular NPts morphology of the α-MoO3 samples prepared at 400 °C for 1 h as a function of the number of layers deposition. The transient response curves in Fig. 12i reveal that the resistance for NO2 increased, while an opposite behavior was observed for H2 gas. Also, the sensor was able to exhibit a highly reversible response down to sub-ppm values for both gases. The response results as a function of the OT and NO2 concentration in Fig. 12j revealed an increase-maximum-decrease kind of pattern for all the tested concentration ranges. The results indicate that the unique synthetic method assisted in the growth of 2-D MoO3 NPts on crystalline substrates, thus eliminating the requirement of any transfer process and leading to the development of a high-performance gas sensor.
MoO3 nanolamella (NLm)
Various VOCs are extremely volatile and harmful to people even at low concentrations, and formaldehyde (HCHO) is one of them, which has recently become a major indoor pollutant. Overexposure to this VOC can cause throat irritation, eye irritation, and even cytotoxic effects. Shen and coworkers151 utilized an ST method to developed Ni-doped α-MoO3 NLm and demonstrated a promising formaldehyde gas sensor. The SEM image in Fig. 13a indicates the lamellar-shaped morphology of the nanocomposite, whereas the OT dependent sensing results in Fig. 13b revealed that the response followed an IMD pattern. Besides, the optimized Ni/α-MoO3 NLm indicated a ∼4 fold response as compared to pristine MoO3 under identical testing conditions, thus revealing the benefits of doping Ni NPs in MoO3. The dynamic response characteristics of the sensors for increasing the formaldehyde concentration. Fig. 13c represents a fast response/recovery of the Ni/α-MoO3 NLm at all concentration values (detection limit ∼3 ppm). The selectivity results in Fig. 13d further attest to the high response of Ni/α-MoO3 NLm toward formaldehyde, among other tested gases. The improved formaldehyde sensing performance of Ni/α-MoO3 NLm was the result of formation of the p–n junction and the increase in the concentration of oxygen vacancies.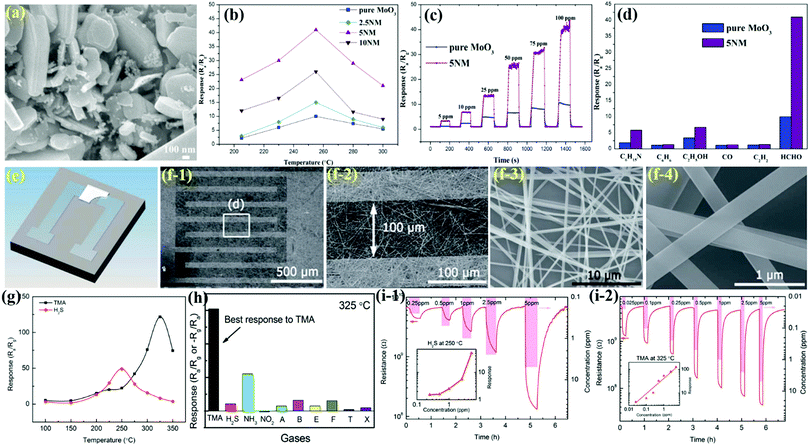 | ||
| Fig. 13 (a) SEM images of 5 mol% Ni-doped α-MoO3; (b) response vs. optimum OT of the sensors to formaldehyde gas at a concentration of 100 ppm; (c) gas-sensing transients to 5–100 ppm formaldehyde operated at optimal OT; (d) comparison of the response of the sensor to 100 ppm of different test gases at 255 °C. Reproduced with permission from ref. 151, copyright 2017 Elsevier. (e) Schematic figure of the MoO3-NPr gas sensor; (f) SEM images of the MoO3-NPr gas sensor; (g) responses of the MoO3-NPr sensor to 5 ppm TMA and H2S with respect to the OT; (h) selectivity of the MoO3-NPr sensor at 325 °C; (i) response–recovery curves of the MoO3-nanopaper sensor to different H2S concentrations at 250 °C and 325 °C, (insets) the response of the sensor to various gas concentrations. Reproduced with permission from ref. 152, copyright 2017 Royal Society of Chemistry. | ||
MoO3 nanopaper (NPr)
Working in the direction of ‘one stone two birds’, Lee and coworkers152 designed a free-standing, flexible, semitransparent ultrathin MoO3 NPr sensor (Fig. 13e) from MoO3 NBs for the detection of TMA and H2S gas. Due to the presence of Lewis-acid sites, MoO3 exhibited high sensitivity toward both TMA and H2S. The SEM images in Fig. 13f1 to f4 confirmed the formation of uniform MoO3 NPr, which consists of highly interconnected MoO3 NBs coated on the electrodes. MoO3 NBs with a width of 200–400 nm and length of 100–200 μm could bridge two electrodes over the gap (100 μm). The OT-dependent MoO3-NPr sensor in Fig. 13g depicted maximum responses to TMA and H2S at 325 and 250 °C, respectively. The selectivity of the MoO3-NPr sensor at 325 °C in Fig. 13h revealed a good selectivity toward TMA, whereas the dynamic sensing curves of the MoO3-NPr sensor in Fig. 13i revealed that the sensor could detect both H2S (25 ppb) and TMA (4.26 ppb) gases at a very low concentration, which is much better than the detection results of human nose. It was concluded that the high chemical affinity of MoO3 to H2S analytes was the reason for its sensitive, selective, and reversible detection at 250 °C, whereas the acid–base interaction between acidic MoO3 and basic TMA was responsible for its detection at 325 °C.MoO3 thin films (TFm)
The thin-film (TFm) morphology is one of the extensively explored 2-D structures of oxide materials for gas sensing applications. For MoO3, numerous techniques, including spray pyrolysis, sol–gel, sputtering, pulsed laser deposition, chemical vapor deposition, thermal evaporation, and electrochemical deposition, have been taken into practice for the deposition of MoO3 films.65,67,68,71 The research group of Pandeeswari et al.153 have utilized the spray pyrolysis technique to develop α-MoO3 film for the detection of TMA vapors in a mixed environment at low OT. The FESEM image in Fig. 14a clearly presents a film surface morphology for α-MoO3 TFm consisting of rectangular crystallites with an average width of 62 nm and length of 450 nm. The response of the film for different TMA concentrations in Fig. 14b indicate an increase in the response up to 50 ppm, over which the response became saturated (curve a), which could be due to the limited number of oxygen-adsorption sites. With the increase in the TMA concentration, more electrons were freed-up, which decreased the electrical resistance (curve b). The transient response/recovery curves in Fig. 14c reveal an instantaneous change in the resistance, while for a given concentration of TMA, the Trec was greater than Tres. The selectivity results of the α-MoO3 TFm sensor in a mixed-vapor environment (Fig. 14d) revealed very little variation in the resistance to TMA gas, thus revealing a good selectivity toward TMA.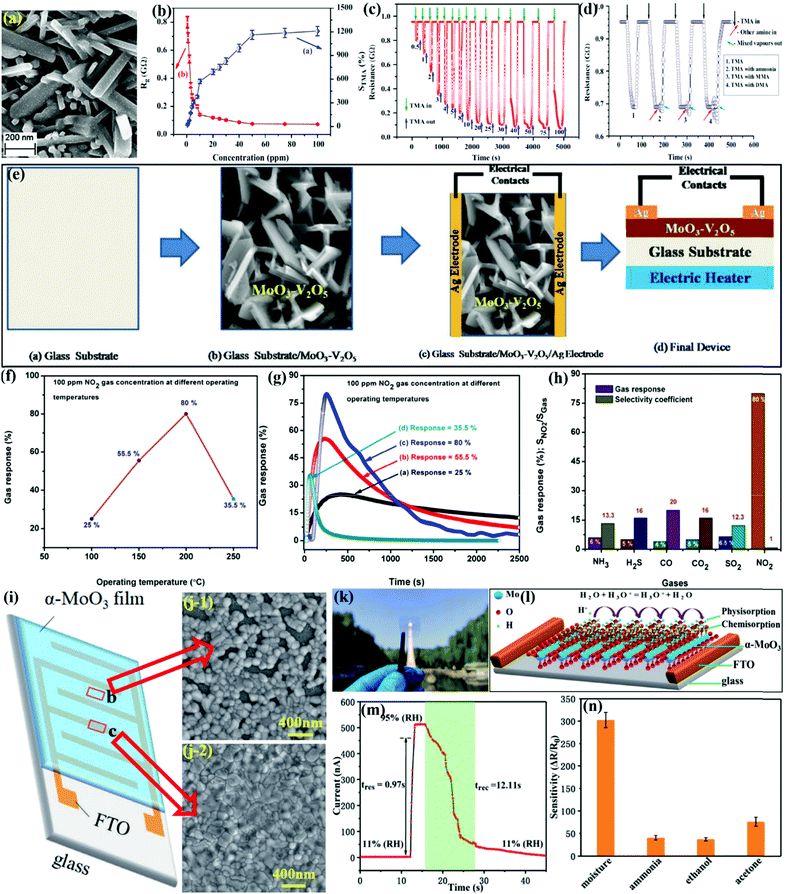 | ||
| Fig. 14 (a) SEM micrograph of spray-deposited α-MoO3 TFm with a thickness of 520 nm; (b) response of α-MoO3 film for different TMA concentrations with error bars; (c) transient response of α-MoO3 film for different TMA concentrations; (d) transient TMA sensing response of α-MoO3 film in mixed amine environment. Reproduced with permission from ref. 153, copyright 2014 Elsevier. (e) The technological flow for the MoO3–V2O5 gas sensor device fabrication; (f) the variation in response of (MoO3)0.4(V2O5)0.6 TFm at different OTs; (g) the transient response curves of typical (MoO3)0.4(V2O5)0.6 TFm; (h) the gas response and selectivity coefficient study of typical (MoO3)0.4(V2O5)0.6 TFm operating at an OT of 200 °C for 100 ppm concentration of various gases. Reproduced with permission from ref. 154, copyright 2018 Elsevier. (i) Schematic device structure of the transparent humidity sensor; (j) SEM images of the α-MoO3 TFm on the surface of channel and FTO electrode; (k) photograph of the transparent device; (l) schematic diagram of the humidity sensing mechanism for the α-MoO3 TFm; (m) dynamic response/recovery curve for one cycle; (n) sensitivity of the device to different analytes. Reproduced with permission from ref. 156, copyright 2020 Royal Society of Chemistry. | ||
In order to further enhance the sensor response compared to the above-mentioned gas sensors, it is essential to adjust the morphology, modify the surface, or combine other oxide and 2-D materials. The group of Mane et al.154 prepared MoO3/V2O5 TFm using the chemical spray pyrolysis (CSP) deposition method (Fig. 14e) for the detection of NO2 gas. The variation in response of MoO3/V2O5 TFm toward NO2 at different OT in Fig. 14f presents an IMD pattern, while the maximum response was observed at 200 °C. The dynamic response curves of MoO3/V2O5 in Fig. 14g revealed that both Tres and Trec decrease with an increase in the OT, whereas the larger Trec at lower OT was ascribed to more prominently adsorbed O2− species on the sensor surface. The gas response results in Fig. 14h show that the response of gases for MoO3/V2O5 TFm varied in the pattern of CO < CO2 = H2S < NH3 < SO2 < NO2. The higher gas response of 80% for NO2 gas could be due to the unpaired e− in nitrogen, which forms the bond with the oxygen present on the surface and subsequently promotes chemisorption.
Flexible and wearable gas sensors using flexible substrates have been an active area of research to overcome the problem of the operating temperature. In addition, most of the sensors fabricated so far have been based on the deposition of sensing layers on mechanically rigid substrates such as alumina, glass, quartz, or silicon. In addition, the precise detection of humidity in the indoor climate has also emerged as a research hotpot in recent times;136,140,162–164 thus, Ma and coworkers156 prepared α-MoO3 TFm by a simple solution method and prepared a transparent humidity sensor, which consisted of laser-etched fluorine-doped tin oxide (FTO) electrode, onto which the annealed α-MoO3 thin film was coated (Fig. 14i). The SEM image in Fig. 14j revealed that the FTO substrate has an important influence on the film formation process as the morphologies of the film on the channels and FTO electrodes are not exactly the same. Fig. 14k represented the excellent transmittance of the prepared sensing device derived from the thin α-MoO3 film and transparent FTO substrate, which are particularly helpful in achieving superior response to humidity under ambient conditions (Fig. 14l). The dynamic current–time curve in Fig. 14m revealed the superfast Tres and Trec of the humidity sensor. In addition, the sensor possesses good anti-interference ability as its selectivity for moisture was much high than toward other test gases (Fig. 14n) under similar testing conditions.
MoO3 microsheets (MSh)
The high degree of anisotropy and chemical functionality of the 2D microsheets have attracted researchers to develop reliable and robust gas sensors. Jiang et al.157 developed MoO3 MSh by thermally oxidizing the MoO2 nanospheres, which were prepared by the HT method. The FESEM micrographs of MoO3 MSh in Fig. 15a depict the formation of homogeneous MSh with the length and thickness of a single MSh of 2–3 μm and 150 nm, respectively. The OT-dependent response of the MoO3 MSh in Fig. 15b indicated an IMD pattern with a maximum at 275 °C. In addition, the cross-sensitivity of the prepared sensor to TEA among a variety of interfering gases in Fig. 15c reveals that the MoO3 MSh response to TEA was highest when compared to the precursor MoO2 and commercial MoO3 material. The stability results of the MoO3 MSh sensor during 5 month exposure to TEA gas (Fig. 15d) indicated negligible deviation of the baseline resistance (in the air), thus demonstrating an excellent repeatability of the sensor. Besides, the sensor response and recovery time measured during this period remained highly stable. The high content of O2− vacancy on the MoO3 surface and its chemical reaction with TEA gas molecules were identified as the prime reasons for the excellent sensing performance of the sensor.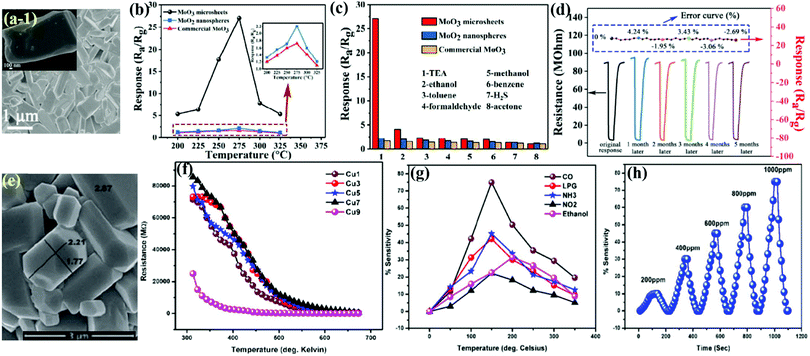 | ||
| Fig. 15 (a) Typical FESEM image of the MoO3 MSh; (b) responses of the sensors to 100 ppm TEA in the OT range of 200–325 °C; (c) responses of the sensors to different gases at 275 °C; (d) dynamic response of MoO3 MSh-based sensors at 275 °C during 5 months exposure to 100 ppm TEA. Reproduced with permission from ref. 157, copyright 2018 Royal Society of Chemistry. (e) SEM micrographs of Cu9; (f) variation of resistance versus temperature for different samples; (g) sensitivity versus temperature for different gases at varied OT; (h) sensitivity versus time for various CO gas concentrations in ppm. Reproduced with permission from ref. 158, copyright 2019 IOP Publishing. | ||
MoO3 micro-planks (MPks)
Lamellar structures such as micro-planks have recently received a lot of attention due to their large domain structures made up of abundantly assembled nanosheets. MoO3 has a tendency to form a lamellar structure in order to achieve high sensing properties. Halwar et al.158 put forth a screen printing method for the production of MoO3 MPk and CuO-doped MoO3 MPk for CO detection. The FESEM image in Fig. 15e illustrated the wooden plank-like structure of the agglomerated MoO3 particles having thickness, width, and length in the range of 1–1.8 μm, ∼7.32 μm, and 31.13 μm, respectively. Besides, the surface of MPk was uniform with very clear boundaries and a few gaps. The results in Fig. 15f indicate that the resistance decreases with an increase in the OT, thus revealing its n-type behavior. The CO sensing results in Fig. 15g presents that the prepared materials have good sensitivity toward CO gas and the response was the highest among other test gases, while the transient curves in Fig. 15h demonstrate an increase in the sensor response with increasing CO concentration and the sensor also demonstrated quick Tres and Trec to CO gas. Later it was concluded that the superior sensing performance was due to the collective effects of the thermal energy, excess oxygen species, and catalytic property of the copper dopants.Three-dimensional (3-D) MoO3 nanostructures for gas sensors
Among various morphological structures, 3-D hierarchical nanostructures (HNS) are assembled from 0-D (nanoparticles), 1-D (nanowires, nanorods, nanotubes, etc.), and 2-D (nanosheets) materials have become increasingly popular among researchers for various applications.165–168 In particular, these 3-D HNS owing to their large SSA and minimized interparticle agglomerations, provides easier gas molecule diffusion and faster charge propagation on the material's surface, thus resulting in high sensitivity and a faster response sensing speed.10,169 To date, a variety of 3-D MoO3 nanostructures, including nano/micro-flower,83,84,166–168,170 hierarchical,53,73,130–135 nanoarrays,177–179 hollows spheres,180,181 core–shell,182–184 microcage,185 nanopompon,186 and microbox187 have been designed and used in gas sensing applications (Table 3).| Class | Material | Synthesis route/morphology | Gas | Conc. (ppm) | Operating temp. (°C) | Response | Resp./Reco. time (s/s) | Ref. |
|---|---|---|---|---|---|---|---|---|
| a Not given. | ||||||||
| Nano/Micro flower | MoO3 | Solvothermal + calcination | TEA | 100 | 250 | 416 | 3/1283 | 83 |
| MoO3 | Hydrothermal | Ethanol | 400 | 300 | 40 | 7/12 | 84 | |
| MoO3 | Hydrothermal | Ethanol | 100 | 350 | 22a | 20/25 (300 ppm) | 166 | |
| MoO3 | Hydrothermal | Ethanol | 300 | 300 | 37.1 | N.G. | 167 | |
| MoO3/WO3 | Hydrothermal | Ethanol | 100 | 320 | 28.5 | 13/10 | 168 | |
| Zn/MoO3 | Hydrothermal | CO | 50 | 240 | 31.23 | 10/14 | 170 | |
| Hierarchical nanostructures | MoO3 | Hydrothermal | Ethanol | 200 | 340 | 34a | N.G. | 171 |
| MoO3 | Solvothermal | TEA | 10 | 170 | 931.2 | N.G. | 172 | |
| MoO3 | Hydrothermal | Ethanol | 100 | 250 | 19.8 | 15/15 | 173 | |
| MoO3 | Hydrothermal | Ethanol | 400 | 300 | 32 | 3.2/2.4 | 77 | |
| SnO2/MoO3 | Chemical synthesis | Ethanol | 100 | 260 | 814 | 1/8 | 174 | |
| Fe2O3/MoO3 | Sacrificial template | TMA | 100 | 240 | 18.6 | 12/106 | 175 | |
| MoO3 | Hydrothermal + calcination | Ethanol | 200 | 260 | 80 | 16/10 | 57 | |
| MoO3/In2O3 | Hydrothermal | Ethanol | 100 | 185 | 7 | 11/94 | 176 | |
| Nanoarrays | Y/MoO3 | Solid state chemical reaction | Xylene | 100 | 370 | 28.3 | 1/15 | 177 |
| MoO3 | Solid state chemical reaction | Xylene | 100 | 370 | 19.2 | 1/15 | 178 | |
| Fe/MoO3 | Solid state chemical reaction | Xylene | 100 | 340 | 28.5 | 2/21 | 179 | |
| Hollow spheres | Au/MoO3 | Solvothermal | Xylene | 100 | 250 | 22.1 | 118/289 | 180 |
| MoO3/Bi2Mo3O12 | Solvothermal | TMA | 50 | 170 | 25.8 | 7.1/N.G. (100 ppm) | 181 | |
| Core–shell | MoO3/ZnO | Hydrothermal + atomic layer deposition | Ethanol | 200 | 350 | 7.6 | 44.8/119/8 | 182 |
| MoO3/NiO | Hydrothermal + sintering | Acetone | 100 | 350 | 20.3 | 17/131 | 183 | |
| MoO3/Fe2(MoO4)3 | Hydrothermal + calcination | H2S | 1 | 70 | 1.7 | 20/70 | 184 | |
| Microcage | MoO3 | Hydrothermal | Ethanol | 200 | 350 | 43 | N.G. | 185 |
| Nano pompon | Ni/MoO3 | Solvothermal | Xylene | 100 | 250 | 62.6 | 1/50 | 186 |
| Microbox | MoO3 | Hydrothermal | Ethanol | 100 | 260 | 78 | 15/5 | 187 |
MoO3 nanoflower (NFLs)
As discussed above, 3-D hierarchical nanostructures such as nanoflowers are generally constructed by low-dimensional construction units, which is an effective way to enhance the sensing properties. The group of Sui et al.83 utilized a surfactant-free ST route to prepare 3-D α-MoO3 NFLs (diameters ∼3–5 μm) consisting of microrods with diameters in the range of 150–200 nm and grown radially from the center of the NFLs. The SEM images (Fig. 16a-1) illustrate the flower-like coral morphology (average diameters ∼150–200 nm and lengths ∼2–3 μm) that seemingly grow from the MoO2 flower center. The same results were further confirmed by the TEM image in Fig. 16a-2. The sensing results in Fig. 16b indicate that depreciation in α-MoO3 NFLs sensor response with increasing OT from 250 to 370 °C was observed for TEA gas. In addition, superior response and high selectivity were further confirmed from the cross-sensitivity results, as shown in Fig. 16c. The transient response results for the sensor in Fig. 16d illustrate a fast response and recovery of the sensor toward TEA gas. The exciting sensing performance is the result of the high electronic conduction of the n-type MoO3 and less agglomerated 3-D hierarchically assembled structures of MoO3 NFLs, which provide more active sites for the adsorption of TEA molecules.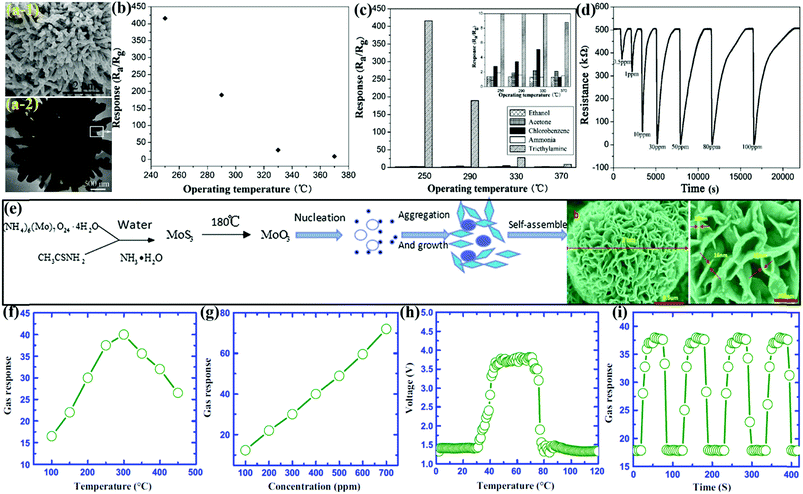 | ||
| Fig. 16 (a) Typical SEM and TEM images of α-MoO3 flower-like HNS; (b) the responses of the α-MoO3 thick-film sensor versus the OT to 100 ppm TEA gas; (c) the responses of the α-MoO3 thick-film sensor to 100 ppm gases at different OTs; (d) the transient response-recovery characteristics of the α-MoO3 sensor with different concentrations of TEA gas at the OT of 250 °C. Reproduced with permission from ref. 83, copyright 2015 Elsevier. (e) Schematic illustration of the possible formation process for the MoO3 NFL architectures and the SEM image of the aggregated state of NFLs; (f) gas response to ethanol (400 ppm) at a series of OT; (g) gas response to varied ethanol concentrations at OT of 300 °C; (h) gas response and recovery curves of the sensors; (i) repeat response–recovery characteristics of the sensors. Reproduced with permission from ref. 84, copyright 2016 Springer. | ||
In addition, the availability of different precursors also allows different nanostructures to be synthesized using a single-step or double-step HT procedure. For example, the flower-like morphology exhibits numerous edge sites, which interact strongly with gas analytes due to their high catalytic reactivity, thus providing a high sensing response.188 Liu et al.84 utilized sodium citrate and PEG-assisted HT method to prepare hierarchical MoO3 NFLs (Fig. 16e) for ethanol gas sensing. The SEM image in Fig. 16e displays the hierarchical and rose-like NFls architectures composed of densely packed thin porous NSs (thickness ∼15–18 nm) arranged in a multilayered stacked structure. The OT-dependent response of MoO3 NFLs to ethanol in Fig. 16f presents an IMD response pattern with the maximum at 300 °C. Besides, the response depicts no sign of saturation with the gas concentration increasing from 100 to 700 ppm, as shown in Fig. 16g. The voltage of the sensor under different OT revealed the highest voltage from 40 to 80 °C (Fig. 16h), whereas the voltage sharply increases when ethanol gas is purged in the chamber while it returns to its original state when the ethanol gas is out of the measurement chamber. The repetitive response results in Fig. 16i demonstrated no significant change in the sensor response while delivering a fast Tres and Trec for the sensor. The excellent response to ethanol was accredited to the high SSA and high S/V ratio of MoO3 NFLs, which assisted in improving the reaction sites for gas analytes.
Wang et al.170 experimentally carried out and theoretically verified (with DFT) the detection of CO using Zn-doped MoO3 hierarchical microflowers using density of states (Scheme 5). As can be seen, a significant amount of deformation of the Zn–MoO3 surface was observed on account of the adsorption of CO, and a charge transfer value of 0.451e was obtained, thus indicating strong chemisorption. Electron transfer during the adsorption process was verified from the distinct continuous region in Scheme 5b, which is related to the formation of new chemical bonds. A shifting to the lower energy after adsorption was observed in the DOS curves, which indicate the chemical action in this system. Finally, the introduction of Zn atom promoted the adsorption ability of MoO3(010), which supports the experimental results showing the superior gas-sensing performance of Zn–MoO3 samples to CO.
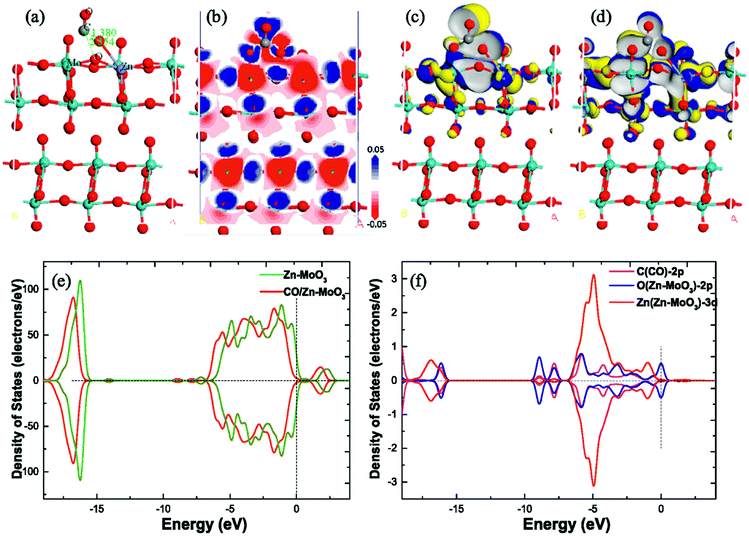 | ||
| Scheme 5 (a) The structure, (b) deformation charge density, (c) HOMO, (d) LUMO, (e) DOS, and (f) PDOS of CO-adsorbed MoO3 (010) adsorption system. Reproduced with permission from ref. 170, copyright 2020 Elsevier. | ||
MoO3 hierarchical nanostructures (HNS)
Hierarchical nanostructures are perceived as one of the most promising materials and have been widely used in gas sensors due to nanoporous structures with less agglomerated architectures. Li et al.171 presented the hexadecyl trimethyl ammonium bromide (CTAB)-assisted HT synthesis of α-MoO3 HNS NBs, which self-assembled into bundles and aggregate into bird's nest-like shape HNS and demonstrated superior ethanol sensing performance. The SEM and TEM images in Fig. 17a-1 and a-2 respectively display the presence of a bird's nest-like HNS with perfectly aligned nano- or micro-porous structures. The width of the single NB is about 250–500 nm, which is wider than that of the monodispersed NBs; this could be due to the side-sharing assembly of the two NBs with the help of CATB. The OT-dependent response of the MoO3 NBs and MoO3 HNS in Fig. 17b reveals the ∼2.3 folds higher response of MoO3 HNS than its counterpart at 340 °C, while its response is always higher than that of MoO3 NBs at all the temperature values. The transient response curves in Fig. 17c demonstrate the good repeatability of sensor response at its ground state, although the response/recovery kinetic property of the MoO3 HNS was much better than that of the MoO3 NBs. The superior sensing performance was accredited to the nanoporous geometry, which, owing to its minimized stacking configuration, provides abundant sites for chemical reaction as well as effective diffusion channels for gases.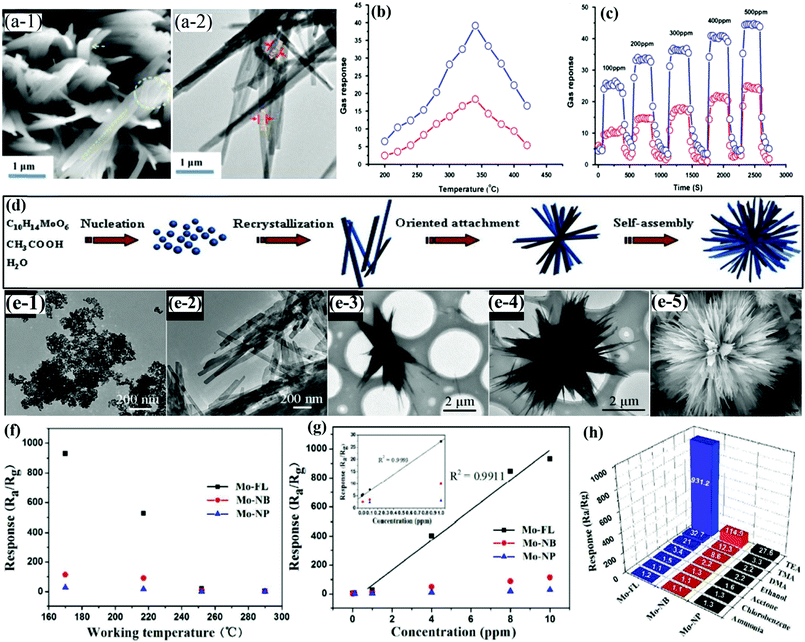 | ||
| Fig. 17 (a) SEM and TEM images of nest-like MoO3; (b) response vs. temperature toward 200 ppm ethanol; (c) ethanol concentration vs. response property at 340 °C, blue line symbol for nest-like MoO3 and red for monodispersed MoO3 NBs. Reproduced with permission from ref. 171, copyright 2015 Elsevier. (d) Schematic of the formation process of the α-MoO3 NFLs; (e-1 to e-4) TEM micrographs of the intermediate products collected at different reaction stages; (e-5) SEM images of the α-MoO3 product prepared for 8 h; (f) the response vs. OT to 10 ppm TEA gas; (g) the response vs. varied TEA concentration; (h) the response to 10 ppm of various gases, reproduced with permission from ref. 172, copyright 2015 Royal Society of Chemistry. | ||
In another work, Sui and coworkers172 prepared a 3-D flower-like α-MoO3 HNS from 1-D single-crystalline NBs via a one-step template-free ST method and achieved the fast detection of TEA at 170 °C. The growth process of α-MoO3 HNS, as depicted in Fig. 17d, revealed the formation of flower-like nanostructures from precursor nanoparticles and nanobelts. The mechanism of formation was further supported by the TEM images in Fig. 17e1 to e4. The SEM image in Fig. 17e5 displays the presence of numerous NBs (thickness ∼20–30 nm) with interconnected sharp tips and rough rims, which are radially assembled into flower-like shapes. The temperature-dependent response in Fig. 17f indicated a decrease in the responses of the sensors toward TEA gas with an increase in the OT 170 to 290 °C. The response of the sensor as a function of TEA concentrations in Fig. 17g presented that the MoO3 HNS possesses the highest response among other MoO3 nanostructures. The cross-sensitivity results in Fig. 17h reveal that an excellent response was observed toward TEA gas. The research group ascribed the superior sensing performance to the following reasons: (1) the fast oxidation of TEA gas, (2) superior electronic conduction of MoO3, (3) 3-D hierarchically assembled structures, and (4) large SSA and pore volume of the α-MoO3 HNS.
As one of the important VOCs, ethanol still requires a reliable and robust sensor for applications in breath analysis, food industries, and the biomedical field. Several approaches have been used to improve the sensing performance of metal oxide-based ethanol sensors. Xia et al.173 utilized the facile HT method to prepare 3-D porous α-MoO3 sponges with 1-D NRs as the building blocks. The schematic in Fig. 18a illustrates the formation of porous sponges, wherein some NRs randomly grown on the lateral surface of other NRs evolve into a branch, which is well criss-crossed to form porous sponges. The SEM image in Fig. 18b indicates the monodispersed NRs (length of 100–200 nm) assembled into porous, spongy-like hierarchical structure with abundant interconnected hollow spaces. The gas-sensing performance in Fig. 18c reveals that the 3-D porous α-MoO3 sponges possess ∼2 times greater response than monodispersed MoO3 nanorods in all the concentration ranges. Fig. 18d further indicates that both the sensors possess similar response–recovery dynamics. It was later concluded that the improved sensing performance was not only due to the interconnected porous structures but also due to the significant fraction of the atoms participating in ethanol gas-sensing reaction.
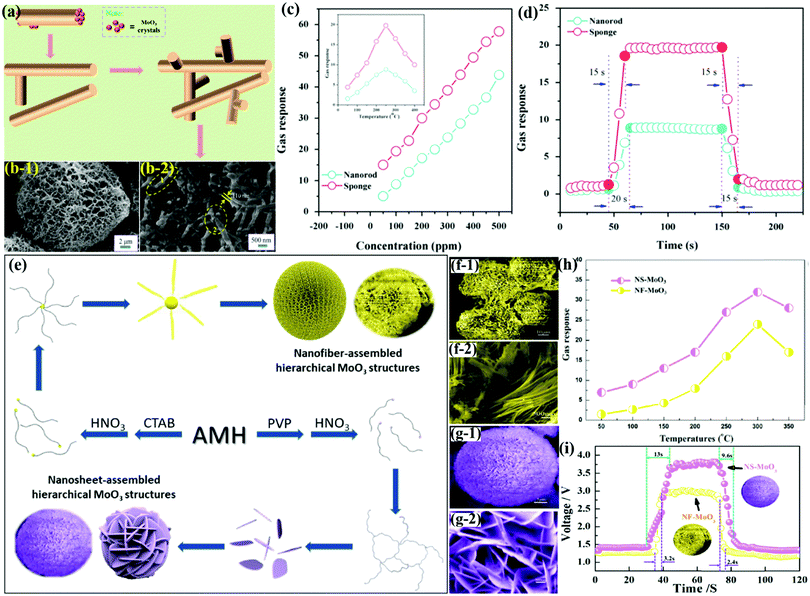 | ||
| Fig. 18 (a) Schematic illustration of the evolution process of porous α-MoO3 sponges; (b) SEM images of porous α-MoO3 sponges; (c) responses to ethanol with different concentration at 250 °C, (inset) response versus the operating temperature of the two sensors exposed to 100 ppm methanol; (d) dynamic ethanol sensing transient toward 100 ppm ethanol at 250 °C. Reproduced with permission from ref. 173, copyright 2016 Elsevier. (e) Schematic diagram of the possible formation mechanism for the NFbs-assembled and the NSs-assembled hierarchical MoO3 structures; (f) SEM images of the NFbs-assembled hierarchical MoO3 structures; (g) SEM images of the NSs-assembled hierarchical MoO3 structures; (h) the gas response to 400 ppm ethanol at different OTs; (i) response–recovery characteristics of the sensors at 300 °C to 400 ppm ethanol. Reproduced with permission from ref. 77, copyright 2019 Elsevier. | ||
Similarly, Li and coworkers77 used CTAB and polyvinyl pyrrolidone (PVP) to respectively prepare NFbs and NSs assembled MoO3 HNS under HT conditions (Fig. 18e). The SEM images of the NFs-assembled MoO3 HNS in Fig. 18f-1 and f-2 clearly demonstrate the presence of a large number of NFs having size in the range of 20–25 μm and assembled around an invisible center. For the NSs-assembled MoO3 HNS in Fig. 18g-1 and g-2, smooth NSs (thickness ∼20–30 nm) were arbitrarily arranged on the surface of the sphere, while numerous NSs were found to cut across each other. The OT-dependent response in Fig. 18h reveals the better ethanol sensing performance of NS-MoO3 HNS than that of NF-MoO3 HNS. This case was the same as that in the case with the response/recovery results, given in Fig. 18i. It was later concluded at the high response of NS-MoO3 HNS was due to its higher SSA and the scattered intersection of various NSs on the spherical surface, which causes the formation of semi-closed spaces on the surface of NS-MoO3 HNS.
MoO3 nanoarrays (NARs)
From the perspective of human health, most VOCs are toxic and hazardous. Xylene is a carcinogenic gas from the BTX (benzene, toluene, and xylene) group.14,137 To detect xylene gas, Qin et al.177 utilized a two-step solid-state chemical reaction route to prepare Y-doped α-MoO3 NARs composed of nanorods (NRs). The SEM image in Fig. 19a displays the presence of orderly self-assembly NARs having a diameter of about 30 nm. The cross-sensitivity results in Fig. 19b reveal that the Y/α-MoO3 NARs have better selective response than that of the pristine α-MoO3 to all the gases; however, the highest response was observed for xylene gas. The transient response curves in Fig. 19c revealed a very fast response time of the sensors, whereas the long-term stability of the sensors for 30 days in Fig. 19d displayed that the response value decreases with time. It was concluded that the defects induced in α-MoO3 NARs after Y-doping allow larger contact area between α-MoO3 and xylene molecules. Besides, the Y dopants, along with increasing electron donor defects and oxygen vacancies, assisted in accelerating the mobility of oxygen ions, thus resulting in better response toward xylene gas.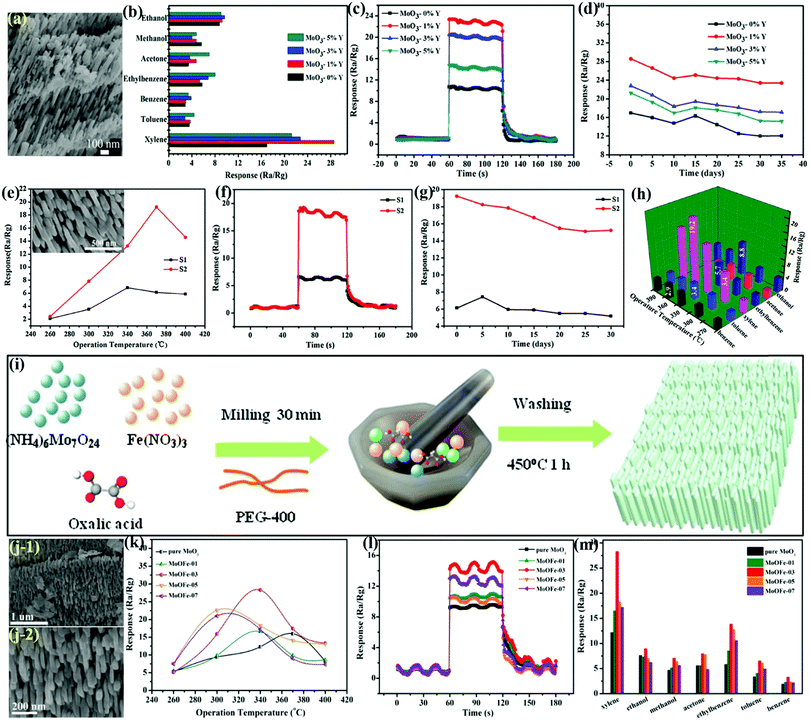 | ||
| Fig. 19 (a) The SEM image of 1% Y-doped sample; (b) the response curve of the samples to 100 ppm of different gases at the OT of 370 °C; (c) the response/recovery curve of the samples for 100 ppm xylene at 370 °C; (d) the stability of the samples for 100 ppm xylene at 370 °C. Reproduced with permission from ref. 177, copyright 2017 Elsevier. (e) The response to 100 ppm gas at different OTs, (inset) the SEM images of samples S2; (f) the dynamic response curves to 100 ppm xylene at 370 °C; (g) the stability of the samples to 100 ppm xylene at 370 °C; (h) the response of sample S2 to 100 ppm gas at the different OTs. Reproduced with permission from ref. 178, copyright 2017 Elsevier. (i) A schematic representation for the synthesis of Fe-doped MoO3 NARs; (j) SEM images of MoOFe-03; (k) the response curves of the samples to 100 ppm xylene at different OTs; (l) the response and recovery curves for 100 ppm xylene at 340 °C; (m) the response of the samples to 100 ppm of different gases at 340 °C. Reproduced with permission from ref. 179, copyright 2020 Elsevier. | ||
Similarly, Qin and coworkers178 utilized a solid-state chemical reaction route to prepare α-MoO3 2-D nanoplates (thicknesses ∼50 nm) and developed self-assembled orderly NARs (inset of Fig. 19e). The OT-dependent response to xylene in Fig. 19e indicated that the sensor based on S2 (NARs) exhibited better sensing performance than the sensor based on S1 (NPts) but a higher OT due to the close array structure of S2. The transient response in Fig. 19f indicated a fast response/recovery time for both the sensors, wherein the response time was close to 1 s toward xylene gas. The stability results in Fig. 19g reveal that the response was the highest on the 5th day, which observed a sharp drop on the 10th day and stabilized on the 20th day. Besides, the cross-sensitivity results in Fig. 19h demonstrate the highest response toward xylene gas. This excellent sensing performance was attributed to the relatively larger SSA and preferential exposure of the active crystal face.
To further enhance the sensor performance compared to pristine α-MoO3, Qin and his group179 used a facile solid-state chemical reaction method to develop Fe-doped α-MoO3 (Fig. 19i). The orderly array structure self-assembled by the NPTs is observed in the SEM images in Fig. 19j. The OT-dependent response to xylene gas in Fig. 19k displayed an IMD pattern, whereas the Fe-loaded samples showed better response at a relatively lower temperature than that of pristine MoO3. The response–recovery transients in Fig. 19l demonstrated a fast response time for all the Fe doped α-MoO3 materials because the presence of Fe ions generates more oxygen vacancies on the surface of the sensor, which is not the case with pure MoO3. The cross-sensitivity results in Fig. 19m revealed that the Fe-doped α-MoO3 NARs displayed the highest response to xylene gas due to the presence of the benzene ring-like structure, which provides a greater number of electrons for reacting with the oxygen species absorbed on the surface of the sensor. It was concluded that the excellent sensing features of Fe-doped MoO3 NARs arise from their larger SSA, which generates more reactive sites, thus resulting in enhanced sensing response to xylene gas.
MoO3 hollow spheres (HSp)
3-D nanostructures, such as hollow spheres and mesoporous structures, have frequently been used for gas sensing applications. There are a plethora of synthetic routes used to design these nanostructures but the solvothermal approach has been paid much more attention due to the easy and cost-effective approach for a controlled morphology. Sui et al.180 utilized a combination of template-free ST method and the calcination process to synthesize monodisperse, hierarchical α-MoO3 HSp of average diameters ∼400–600 nm (Fig. 20a). The OT-dependent sensing performance toward xylene in Fig. 20b displayed an IMD pattern with the maximum response at 250 °C, which was 40 °C less as compared to that of pure α-MoO3 (290 °C). The cross-sensitivity results in Fig. 20c indicate poor selectivity for pure α-MoO3, whereas the optimized Au/α-MoO3 HSp demonstrated maximum sensitivity to xylene gas, among others. Besides, the sensor displayed poor sensing performance to gases including ethanol, hydrogen, ammonia, acetone, formaldehyde, and chlorobenzene (Fig. 20d). The reason for the improved sensing performance could be due to the Au NPs, which on coordinating with the aromatic rings of xylene, dissociate them faster as compared to the other test gases. Using a similar ST strategy, Zhang and coworkers181 reported for the first time MoO3/Bi2Mo3O12 hollow microspheres for detecting TMA gas. The SEM and TEM images in Fig. 20e display the presence of a hollow microsphere (diameter ∼1.2 μm) whose surface was found to be smooth with some pores observed on it. The temperature-dependent response toward TMA in Fig. 20f reveals a depreciation in the sensor response as the OT increases from 170 to 330 °C. The real-time gas response results to TMA at 170 °C in Fig. 20g presents an increase in the response with the increase in the TMA concentration, and an excellent linear relationship with TMA was also observed. The cross-sensitivity results in Fig. 20h unveil the excellent response toward TMA gas, which could be ascribed to the unique HSp morphology that provides an excellent surface for the diffusion and reaction of TMA molecules, and the synergistic effect from the heterojunction between MoO3 and Bi2Mo3O12.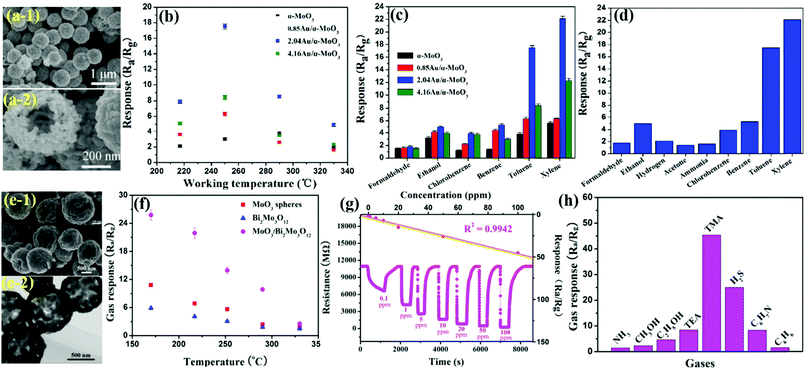 | ||
| Fig. 20 (a) The SEM images of a single sphere obtained by calcination; (b) the responses vs. the OT to 100 ppm toluene gas; (c) the responses vs. 100 ppm various gases at their relative optimized OTs; (d) the responses of 2.04Au/α-MoO3 sensor versus 100 ppm gases. Reproduced with permission from ref. 180, copyright 2017 American Chemical Society. (e) SEM and TEM images of the calcined MoO3/Bi2Mo3O12 spheres; (f) responses of the sensors toward 50 ppm of TMA at different OTs; (g) the gas response–recovery characteristics of the MoO3/Bi2Mo3O12 sensor to varied concentrations of TMA measured at 170 °C; (h) the responses of the MoO3/Bi2Mo3O12 sensor toward 100 ppm of various gases. Reproduced with permission from ref. 181, copyright 2019 American Chemical Society. | ||
MoO3 core–shell (CSh)
In recent times, researchers have proposed highly effective and advanced sensors based on porous core–shell (CSh) structures with higher selectivity and stability. Lee et al.182 utilized the HT method to prepare the MoO3 core and the atomic layer deposition (ALD) method to deposit ZnO shell and then prepared MoO3–ZnO CSh nanorod sensors (Fig. 21a). The SEM image in Fig. 21b-1 depicts a typical rod-like morphology with diameter and length of ∼100 nm and ∼1000 nm, respectively, whereas the TEM image in Fig. 21b-2 reveals that the NR consists of a central core (diameter ∼120 nm) surrounded by a shell (thickness ∼30 nm). The OT-dependent sensing performance in Fig. 21c indicates that the MoO3-ZnO CSh sensor shows better response than pristine MoO3 at all temperature ranges. The cross-sensitivity results in Fig. 21d revealed that the MoO3–ZnO CSh sensor showed good selectivity toward ethanol, among others. The long-term stability results in Fig. 21e showed that the MoO3–ZnO CSh sensor response is highly stable and repeatable.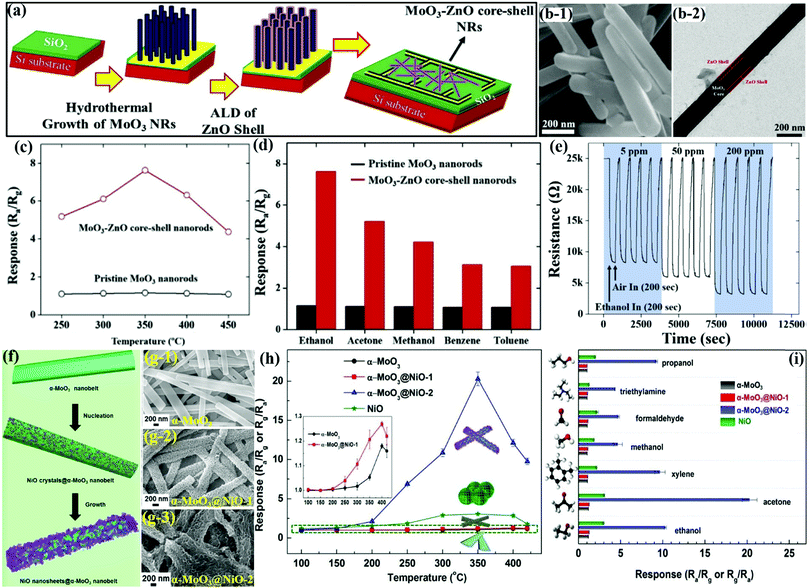 | ||
| Fig. 21 (a) Schematic representation of the synthesis of MoO3-ZnO CSh; (b) SEM and TEM images of MoO3-ZnO CSh NRs; (c) response of the prepared materials to 200 ppm ethanol at different OTs; (d) selectivity of the pristine MoO3 and MoO3-ZnO CSh NR sensor at 350 °C; (e) long-term stability of the MoO3–ZnO CSh NR sensor at 350 °C. Reproduced with permission from ref. 182, copyright 2018 Elsevier. (f) Schematic illustration of the synthesis of α-MoO3@NiO composites; (g) SEM images of the as-prepared materials; (h) response vs. OT for 100 ppm acetone gas; (i) selectivity toward 100 ppm various gases at their optimal OTs. Reproduced with permission from ref. 183, copyright 2019 Royal Society of Chemistry. | ||
Similarly, in another work, Xu and coworkers183 anchored NiO porous NSs on α-MoO3 NBs using a simple method and developed the α-MoO3@NiO CSh P–N heterostructured nanocomposite (Fig. 21f). The SEM images in Fig. 21g revealed the structure of α-MoO3, which is composed of 1D NBs with a uniform size distribution. This structure of NBs was well-maintained in α-MoO3@NiO CSh; however, the surface becomes coarser than that of pristine α-MoO3 NBs, which could be due to the successful growth of NiO NSs on its surface in the process of forming the CSh structure. The sensing results in Fig. 21h exhibit an IMD kind of volcano-shaped pattern toward acetone gas, wherein the optimized α-MoO3@NiO CSh nanocomposite sensor demonstrated the highest response at its optimal OT due to the highest amount of heterogeneous interfacial bonds. Besides, the response to acetone gas was also the highest (Fig. 21i) among other interfering test gases. The high sensing performance of α-MoO3@NiO CSh was attributed to its larger SSA, which was readily available for surface reactions and also the formation of p–n heterojunction among NiO and α-MoO3.
MoO3 microcage (MCg)
One of the metal oxide nanostructures, such as the microcage, is known for its peculiar high-surface architectures conducive for adequate oxygen adsorption and ability to interact with target gas species on the surface. Zhu et al.185 utilized a facile template-free HT method to prepare hollow MoO3 microcage as a result of the inside-out Ostwald-ripening and the acidic etching processes (Fig. 22a). The SEM image in Fig. 22b-1 display the solid MoO3 polyhedrons with a diameter in the range of 1.5–4 μm, while the SEM image of MoO3 MCg in Fig. 22b-2 presents a well-shaped hollow cage structure having a smooth surface and a diameter of about 1–1.5 μm. Open holes were also observed on the cage surface, which exposes the hollow interior space. The OT-dependent sensing performance to ethanol in Fig. 22c displays an IMD pattern, wherein the hollow cage-based sensor demonstrated better response than the solid polyhedron toward ethanol gas. The response transients of both MoO3-based sensors to ethanol in Fig. 22d indicated good repeatability as no change in the responses after four reversible cycles was observed for both the sensors. It was concluded that gas adsorption and diffusion were highly facilitated in the hollow MoO3 cages, which provided a larger number of surface-active sites for enhancing the ethanol response.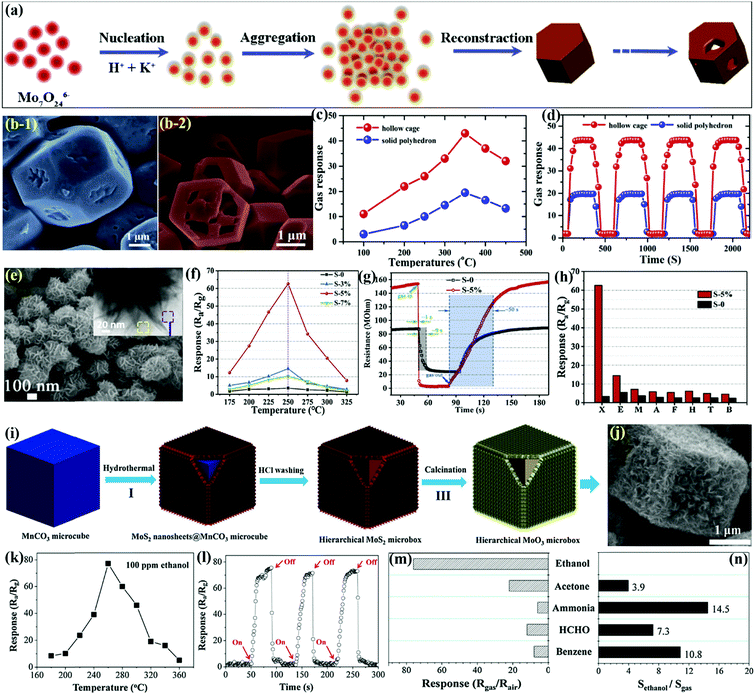 | ||
| Fig. 22 (a) Growth mechanism of hollow MoO3 cage; (b-1) SEM images of solid MoO3 polyhedrons; (b-2) SEM images of hollow MoO3 MCg; (c) the gas response vs. OT for 200 ppm ethanol gas; (d) the gas response of the two sensors toward different gas concentrations at 350 °C. Reproduced with permission from ref. 185, copyright 2019 Elsevier. (e) FESEM images of S-5% NPMn, (inset) TEM image of S-5%; (f) responses vs. OTs to 100 ppm xylene gas; (g) response and recovery curves of S-0 and S-5% sensors; (h) responses to 100 ppm different test gases (X: xylene, E: ethanol, M: methanol, A: acetone, F: formaldehyde, H: hydrogen sulfide, T: toluene, B: benzene) at 250 °C, reproduced with permission from ref. 186, copyright 2019 Elsevier. (i) Schematic illustration of the formation process of hierarchical MoO3 MBx; (j) FESEM image of hierarchical MoO3 MBx; (k) response of the sensor based on hierarchical MoO3 MBx to 100 ppm of ethanol at different OTs; (l) response/recovery curves of sensors to 100 ppm ethanol at 260 °C; (m) gas response of hierarchical MoO3 MBx to 100 ppm test gases at 260 °C; (n) selectivity to ethanol (Sethanol and Sgas, gas responses to ethanol and other gases, respectively). Reproduced with permission from ref. 187, copyright 2017 Elsevier. | ||
MoO3 nano-pompon (NPMn)
Xylene is one of the major VOCs commonly used in the paint industry, and its overexposure may cause skin irritation, hearing and memory loss, and may pose a risk of neurasthenia syndrome. The accurate detection of this toxic analyte is, therefore, essential to ensure a healthy and clean working environment. Jiang et al.186 used a facile ST method to develop Ni-doped MoO3 NPMn and demonstrated superior xylene sensing properties. The SEM image in Fig. 22e unveils the presence of rough pompons having a diameter of 200–300 nm, while the inset (TEM image) unveils the presence of 2-D NSs assembling into the pompons. The OT-dependent sensing response in Fig. 22f indicates an IMD pattern, wherein peak performance was observed at 250 °C. Besides, Ni/MoO3 NPMn displayed a better sensing response than pristine MoO3 at every temperature range. The transient response curves in Fig. 22g reveal a very fast Tres for the optimized Ni/MoO3 NPMn toward xylene gas due to an increase in the number of reactive sites by Ni doping. The cross-sensitivity results in Fig. 22h reveal that Ni/MoO3 NPMn demonstrated better response to every gas (highest for xylene) than pristine MoO3 under similar testing conditions. It was concluded that the high SSA obtained and finely-tuned crystallite size after Ni-doping induced changes in the oxygen composition and were responsible for the improved xylene sensing performance.MoO3 microboxes (MBx)
Other metal oxide nanostructures, such as microboxes, are known for their hierarchical and hollow structures to enhance the sensitivity due to their accessible surface to adsorbed oxygen species and more active sites. Furthermore, their high surface-to-volume ratio mass transfer accessibility could help to achieve rapid response/recovery to the target gas. Zhang et al.187 used the HT method to prepare hierarchical MoO3 MBx from MnCO3 microcubes (MCBs) as the templates. Fig. 22i revealed the formation of MoO3 MBx, wherein, firstly, the nanocomposite of uniform MnCO3 MCBs and MoS2 NSs was prepared by an NT method to form MoS2@MnCO3 CSh MCBs, following which the MnCO3 MCBs templates were removed by HCl washing to obtain the hierarchical MoS2 MCBs, which were calcined at high temperatures to prepare hierarchical MoO3 MBx. The SEM image in Fig. 22j revealed the presence of regular MCBs of size about 2–3 μm along with some small openings on its surface, which indicated the hierarchical and hollow MCB structure of the MoO3 samples. The OT-dependent sensing response in Fig. 22k indicated an IMD pattern with the maximum response to ethanol gas at 260 °C. The reproducibility of the sensor toward ethanol gas tested in 3 cycles (Fig. 22l) represented no change in the sensing performance along with a fast Trec of the sensor. The cross-sensitivity results in Fig. 22m and selectivity coefficients in Fig. 22n indicate that under identical testing conditions, the sensor responded excellently to ethanol, which was a result of the hierarchical and hollow structure of MoO3 MBx.Conclusion and future scope
This review follows the recent progress and developments made in the thematic domain of gas sensing for various MoO3 nanostructures. Herein, we have summarized the different morphologies and structures of MoO3, each with a peculiar sensing performance toward a particular target gas. Various top-down and bottom-up approaches to fabricate MoO3 nanostructures with different sizes and shapes have been discussed in detail. This comprehensive review concluded the very fact that the morphologies of MoO3 that possess a high surface-to-volume ratio, e.g., nanotubes, nanoflowers, hierarchical nanostructures, core–shell, and microspheres, have been able to attract great attention of the researchers as these morphologies allow for the easy penetration of gas molecules in their porous structure, thus resulting in high sensor response. The sensing performance of these nanostructures has been reviewed to detect various hazardous and flammable gases and organic vapors such as ammonia, nitrogen dioxide, hydrogen sulfide, chlorine, carbon monoxide, ethanol, formaldehyde, acetone, and methanol. Generally, MoO3-based gas sensors show high sensitivity and lower detection limit; however, their selectivity and operation temperature are major concerns. Some strategies are used to overcome the problem, such as surface modification using noble metal NPs or doping/modification with other material and light illumination but they do not entirely fulfill the requirement for the usage of MoO3 in commercial applications. Following are the key conclusions of MoO3-based gas sensors to improve their sensing performance.(a) The response could be enhanced using porous and hollow structures as they can provide fast adsorption–desorption, diffusion, and transmission of gas molecules to achieve high sensor response at low concentrations.
(b) Surface modification using noble metals or doping of metal ions could increase the number of reaction sites on the surface, which results in more oxygen vacancies to interact with the target gas and enhance the selectivity.
(c) The formation of heterostructures or composites with other oxides or 2-D materials can form abundant oxygen vacancies and create more active sites for the interaction. This can control the Fermi level and transfer the electrons from a higher energy level to a lower energy level, leading to increased response value and fast response.
(d) Light illumination/irradiation could help to achieve high sensor response and fast Tres/Trec at RT by generating photo-induced electron–hole pairs on the MoO3 surface via the chemisorption process.
Although there has been extraordinary progress in designing gas sensors using novel nanostructures, there are still many challenges and problems toward achieving high sensing performance, reproducible synthesis process, high selectivity, miniaturization of the sensor, and power consumption/operation temperature. This is very important because the mass-scale production of sensor devices requires a reliable and reproducible process. One of the key challenges is the durability of the sensor at RT since humidity is the main interference in a room temperature sensor. Thus, from a practical point of view, it is important to investigate the sensing performance under different humid conditions to establish the relationship between the sensing properties and the environmental conditions. Another key challenge is the selectivity or the interference of gases, which can often hinder the sensing performance. There have been few reports on gas sensors for detecting specific gases but not all gases, and sometimes, the detection of a specific gas out of a mixture of gases is a major concern. In the case of resistance-based sensors, it is difficult to discriminate the gases that can give similar resistive change/response. To enhance the selectivity and remove undesirable confounders, a diffusion filter layer can be made with microporous materials (e.g., zeolite and metal–organic frameworks, active carbon, and polymers (e.g., Nafion65)).189 In this case, only the filtered molecule can reach the surface of the sensing material. Güntner et al.190 demonstrated superior selective sensing toward formaldehyde using zeolite membranes. With a zeolite Mobile-Five (MFI)/Al2O3 membrane, the Pd-doped SnO2 sensor displayed astounding selectivity (>100) for formaldehyde (down to 30 ppb) at 90% relative humidity.
Lastly, the important aspect to consider is OT in the case of MoO3-based gas sensors. Undoubtedly, temperature plays a vital role in SMOx-based gas sensors to achieve fast response/recovery speed and high sensitivity. At low temperatures, the reaction rate on the metal oxide surface is sluggish, resulting in poor sensor response. By increasing the temperature, the thermal energy given is high enough to overcome the activation energy barrier for the surface reaction; thus, the reaction rate increases and the sensor displays increasing response to the target gas. However, in order to achieve high sensor response, we need to compromise the power consumption. To solve this issue, the idea of a low-powered or self-powered microheater has been proposed with advanced MEMS technology so as to achieve the best possible sensing performance with less power consumption. In addition, an in-depth study of the gas sensing mechanism of MoO3 nanostructures and metal oxides is still needed. Several models and hypotheses on the metal oxide-based gas sensing system are described by researchers but there is no such model that works for an wide range of gas molecules. Additional analysis may be needed by some advanced tools such as DFT or first principles study.
In conclusion, the key motive of this review was not only to summarize the state-of-the-art but also to inspire readers and excite curiosity, driving them to further investigate MoO3-based gas sensors. Future directions for understanding more about MoO3-based nanostructures, their sensing mechanism, and future applications have been discussed.
Conflicts of interest
There are no conflicts to declare.Acknowledgements
This work was carried out with financial assistance from the Brazilian funding agencies: São Paulo Research Foundation-FAPESP (2014/23546-1).References
- T. Hong, J. Kim and M. Lee, Appl. Energy, 2018, 228, 1707–1713 Search PubMed.
- L. Pang, J. Zhang, X. Cao, X. Wang, J. Liang, L. Zhang and L. Guo, Indoor Air, 2020, ina.12746 Search PubMed.
- K. Santhanam and N. Ahamed, ChemEng., 2018, 2, 38 Search PubMed.
- R. Malik, V. K. Tomer and N. Joshi, ACS Appl. Mater. Interfaces, 2018, 10, 34087–34097 Search PubMed.
- R. Malik, V. K. Tomer and V. Chaudhary, Functionalized Graphene Nanocomposites and their Derivatives, Elsevier, 2019, pp. 323–338 Search PubMed.
- H. Chojer, P. T. B. S. Branco, F. G. Martins, M. C. M. Alvim-Ferraz and S. I. V. Sousa, Sci. Total Environ., 2020, 727, 138385 Search PubMed.
- R. S. Andre, R. C. Sanfelice, A. Pavinatto, L. H. C. Mattoso and D. S. Correa, Mater. Des., 2018, 156, 154–166 Search PubMed.
- E. G. Snyder, T. H. Watkins, P. A. Solomon, E. D. Thoma, R. W. Williams, G. S. W. Hagler, D. Shelow, D. A. Hindin, V. J. Kilaru and P. W. Preuss, Environ. Sci. Technol., 2013, 47, 11369–11377 Search PubMed.
- V. K. Tomer and S. Duhan, Sens. Actuators, B, 2016, 223, 750–760 Search PubMed.
- R. Malik, V. K. Tomer, V. Chaudhary, M. S. Dahiya, P. S. Rana, S. P. Nehra and S. Duhan, ChemistrySelect, 2016, 1, 3247–3258 Search PubMed.
- J. He, L. Xu, P. Wang and Q. Wang, Integr. VLSI J., 2017, 58, 286–294 Search PubMed.
- S. Feng, F. Farha, Q. Li, Y. Wan, Y. Xu, T. Zhang and H. Ning, Sensors, 2019, 19, 3760 Search PubMed.
- R. Malik, V. K. Tomer, N. Joshi, V. Chaudhary and L. Lin, in Nanosensors for Smart Cities, ed. P. K. S. B. Han, V. K. Tomer, T. A. Nguyen and A. Farmani, Elsevier, 2020, pp. 251–266 Search PubMed.
- R. Malik, V. K. Tomer, V. Chaudhary, M. S. Dahiya, S. P. Nehra, S. Duhan and K. Kailasam, Sens. Actuators, B, 2018, 255, 3564–3575 Search PubMed.
- R. Malik, V. K. Tomer, V. Chaudhary, M. S. Dahiya, S. P. Nehra, P. S. Rana and S. Duhan, Sens. Actuators, B, 2017, 239, 364–373 Search PubMed.
- S. De Vito, G. Di Francia, E. Esposito, S. Ferlito, F. Formisano and E. Massera, Pattern Recognit. Lett., 2020, 136, 264–271 Search PubMed.
- F. Wu, T. Wu and M. Yuce, Sensors, 2018, 19, 21 Search PubMed.
- A. Mirzaei, S. G. Leonardi and G. Neri, Ceram. Int., 2016, 42, 15119–15141 Search PubMed.
- R. Kumar, Eur. J. Mol. Clin. Med., 2020, 7, 3438–3441 Search PubMed.
- P. K. Mishra, R. Malik, V. K. Tomer and N. Joshi, Functional Nanomaterials: Advances in gas sensing technologies, Springer, Singapore, 2020, pp. 285–302 Search PubMed.
- V. K. Tomer, S. Devi, R. Malik, S. P. Nehra and S. Duhan, Sens. Actuators, B, 2016, 229, 321–330 Search PubMed.
- R. Malik, V. K. Tomer, V. Chaudhary, N. Joshi and S. Duhan, Metal Oxide Nanocomposites, Wiley, 2020, pp. 265–301 Search PubMed.
- M. S. Kamal, S. A. Razzak and M. M. Hossain, Atmos. Environ., 2016, 140, 117–134 Search PubMed.
- C. Wang, L. Yin, L. Zhang, D. Xiang and R. Gao, Sensors, 2010, 10, 2088–2106 Search PubMed.
- Y. Jian, W. Hu, Z. Zhao, P. Cheng, H. Haick, M. Yao and W. Wu, Nano-Micro Lett., 2020, 12, 1–43 Search PubMed.
- N. Joshi, V. K. Tomer, R. Malik and J. Nie, Functional Nanomaterials: Advances in gas sensing technologies, Springer, Singapore, 2020, pp. 143–159 Search PubMed.
- Y.-F. Sun, S.-B. Liu, F.-L. Meng, J.-Y. Liu, Z. Jin, L.-T. Kong and J.-H. Liu, Sensors, 2012, 12, 2610–2631 Search PubMed.
- V. Kumar, K. H. Kim, P. Kumar, B. H. Jeon and J. C. Kim, Coord. Chem. Rev., 2017, 342, 80–105 Search PubMed.
- D. J. Wales, J. Grand, V. P. Ting, R. D. Burke, K. J. Edler, C. R. Bowen, S. Mintova and A. D. Burrows, Chem. Soc. Rev., 2015, 44, 4290–4321 Search PubMed.
- E. Llobet, Sens. Actuators, B, 2013, 179, 32–45 Search PubMed.
- V. K. Tomer and S. Duhan, Appl. Phys. Lett., 2015, 106, 063105 Search PubMed.
- S. M. Majhi, A. Mirzaei, H. W. Kim, S. S. Kim and T. W. Kim, Nano Energy, 2021, 79, 105369 Search PubMed.
- R. Malik, V. K. Tomer, Y. K. Mishra and L. Lin, Appl. Phys. Rev., 2020, 7, 021301 Search PubMed.
- V. K. Tomer, R. Malik, V. Chaudhary, A. Baruah and L. Kienle, Noble Metal-Metal Oxide Hybrid Nanoparticles, Elsevier, 2019, pp. 283–302 Search PubMed.
- Y. Wu, N. Joshi, S. Zhao, H. Long, L. Zhou, G. Ma, B. Peng, O. N. Oliveira, A. Zettl and L. Lin, Appl. Surf. Sci., 2020, 529, 147110 Search PubMed.
- I. A. de Castro, R. S. Datta, J. Z. Ou, A. Castellanos-Gomez, S. Sriram, T. Daeneke and K. Kalantar-zadeh, Adv. Mater., 2017, 29, 1701619 Search PubMed.
- Z. Wei and S. Zhuiykov, Nanoscale, 2019, 11, 15709–15738 Search PubMed.
- H. J. Lunk and H. Hartl, ChemTexts, 2017, 3, 1–23 Search PubMed.
- Z. Lei, X. Yang, J. Dong and X. Yi, Chem. Mater., 2009, 21, 5681–5690 Search PubMed.
- H. Ren, S. Sun, J. Cui and X. Li, Cryst. Growth Des., 2018, 18, 6326–6369 Search PubMed.
- P. Song, Q. Wang, J. Li and Z. Yang, Sens. Actuators, B, 2013, 181, 620–628 Search PubMed.
- S. Alizadeh and S. A. Hassanzadeh-Tabrizi, Ceram. Int., 2015, 41, 10839–10843 Search PubMed.
- H. Peelaers, M. L. Chabinyc and C. G. Van De Walle, Chem. Mater., 2017, 29, 2563–2567 Search PubMed.
- L. Cheng, M. Shao, X. Wang and H. Hu, Chem. – Eur. J., 2009, 15, 2310–2316 Search PubMed.
- Y. Zhao, J. Liu, Y. Zhou, Z. Zhang, Y. Xu, H. Naramoto and S. Yamamoto, J. Phys.: Condens. Matter, 2003, 15, L547 Search PubMed.
- M. B. Sreedhara, H. S. S. R. Matte, A. Govindaraj and C. N. R. Rao, Chem. – Asian J., 2013, 8, 2430–2435 Search PubMed.
- J. H. Kim, J. K. Dash, J. Kwon, C. Hyun, H. Kim, E. Ji and G. H. Lee, 2D Mater., 2019, 6, 015016 Search PubMed.
- Y. Gong, Y. Dong, B. Zhao, R. Yu, S. Hu and Z. Tan, J. Mater. Chem. A, 2020, 8, 978–1009 Search PubMed.
- K. Inzani, T. Grande, F. Vullum-Bruer and S. M. Selbach, J. Phys. Chem. C, 2016, 120, 8959–8968 Search PubMed.
- A. Chithambararaj, N. S. Sanjini, S. Velmathi and A. Chandra Bose, Phys. Chem. Chem. Phys., 2013, 15, 14761–14769 Search PubMed.
- S. Balendhran, S. Walia, H. Nili, J. Z. Ou, S. Zhuiykov, R. B. Kaner, S. Sriram, M. Bhaskaran and K. Kalantar-zadeh, Adv. Funct. Mater., 2013, 23, 3952–3970 Search PubMed.
- Y. Zhu, Y. Yao, Z. Luo, C. Pan, J. Yang, Y. Fang, H. Deng, C. Liu, Q. Tan, F. Liu and Y. Guo, Molecules, 2019, 25, 18 Search PubMed.
- J. Wang, Q. Zhou, S. Peng, L. Xu and W. Zeng, Front. Chem, 2020, 8, 339 Search PubMed.
- M. Morales-Luna, S. A. Tomás, M. A. Arvizu, M. Pérez-González and E. Campos-Gonzalez, J. Alloys Compd., 2017, 722, 938–945 Search PubMed.
- A. A. Mane and A. V. Moholkar, Appl. Surf. Sci., 2017, 405, 427–440 Search PubMed.
- S. Yang, G. Lei, Z. Lan, W. Xie, B. Yang, H. Xu, Z. Wang and H. Gu, Int. J. Hydrogen Energy, 2019, 44, 7725–7733 Search PubMed.
- H. Yan, P. Song, S. Zhang, Z. Yang and Q. Wang, RSC Adv., 2015, 5, 72728–72735 Search PubMed.
- E. Comini, L. Yubao, Y. Brando and G. Sberveglieri, Chem. Phys. Lett., 2005, 407, 368–371 Search PubMed.
- D. Kwak, M. Wang, K. J. Koski, L. Zhang, H. Sokol, R. Maric and Y. Lei, ACS Appl. Mater. Interfaces, 2019, 11, 10697–10706 Search PubMed.
- Q. Wei, P. Song, Z. Li, Z. Yang and Q. Wang, Vacuum, 2019, 162, 85–91 Search PubMed.
- A. Dey, Mater. Sci. Eng., B, 2018, 229, 206–217 Search PubMed.
- A. Bag and N. E. Lee, J. Mater. Chem. C, 2019, 7, 13367–13383 Search PubMed.
- S. Ud-Din, M. Z. Ahmad, K. Qureshi, I. A. Bhatti, M. Zahid, J. Nisar, M. Iqbal and M. Abbas, Mater. Res. Bull., 2018, 100, 120–130 Search PubMed.
- S. Shen, X. Zhang, X. Cheng, Y. Xu, S. Gao, H. Zhao, X. Zhou and L. Huo, ACS Appl. Nano Mater., 2019, 2, 8016–8026 Search PubMed.
- Q. Fu, J. Chen, C. Shi and D. Ma, ACS Appl. Mater. Interfaces, 2013, 5, 6024–6029 Search PubMed.
- L. P. Babu Reddy, H. G. Rajprakash and Y. T. Ravikiran, AIP Conference Proceedings, American Institute of Physics Inc., 2019, vol. 2142, p. 070022 Search PubMed.
- J. Song, X. Ni, L. Gao and H. Zheng, Mater. Chem. Phys., 2007, 102, 245–248 Search PubMed.
- A. Ashok, S. N. Vijayaraghavan, S. V. Nair and M. Shanmugam, RSC Adv., 2017, 7, 48853–48860 Search PubMed.
- K. E. Lee, L. Liu and T. L. Kelly, J. Phys. Chem. C, 2014, 118, 27735–27741 Search PubMed.
- H. U. Kim, J. Son, A. Kulkarni, C. Ahn, K. S. Kim, D. Shin, G. Y. Yeom and T. Kim, Nanotechnology, 2017, 28, 175601 Search PubMed.
- S. A. Khalate, R. S. Kate, H. M. Pathan and R. J. Deokate, J. Solid State Electrochem., 2017, 21, 2737–2746 Search PubMed.
- J. Zhang, P. Song, Z. Li, S. Zhang, Z. Yang and Q. Wang, J. Alloys Compd., 2016, 685, 1024–1033 Search PubMed.
- X. Fu, P. Yang, X. Xiao, D. Zhou, R. Huang, X. Zhang, F. Cao, J. Xiong, Y. Hu, Y. Tu, Y. Zou, Z. Wang and H. Gu, J. Alloys Compd., 2019, 797, 666–675 Search PubMed.
- K. Xu, W. Wei, Y. Sun, W. Lu, T. Yu, Y. Yang and C. Yuan, Powder Technol., 2019, 345, 633–642 Search PubMed.
- K. He, S. He, W. Yang and Q. Tian, J. Alloys Compd., 2019, 808, 151704 Search PubMed.
- R. Nadimicherla, H. Y. Li, K. Tian and X. Guo, Solid State Ionics, 2017, 300, 128–134 Search PubMed.
- H. Ji, W. Zeng and Y. Li, Phys. E, 2019, 114, 113646 Search PubMed.
- D. Chen, M. Liu, L. Yin, T. Li, Z. Yang, X. Li, B. Fan, H. Wang, R. Zhang, Z. Li, H. Xu, H. Lu, D. Yang, J. Sun and L. Gao, J. Mater. Chem., 2011, 21, 9332–9342 Search PubMed.
- S. S. Kalanur, I. H. Yoo and H. Seo, Sens. Actuators, B, 2017, 247, 357–365 Search PubMed.
- F. Ji, X. Ren, X. Zheng, Y. Liu, L. Pang, J. Jiang and S. Liu, Nanoscale, 2016, 8, 8696–8703 Search PubMed.
- D. Wang, Y. Cheng, K. Wan, J. Yang, J. Xu and X. Wang, Vacuum, 2020, 179, 109487 Search PubMed.
- X. Luo, K. You, Y. Hu, S. Yang, X. Pan, Z. Wang, W. Chen and H. Gu, Int. J. Hydrogen Energy, 2017, 42, 8399–8405 Search PubMed.
- L. L. Sui, Y. M. Xu, X. F. Zhang, X. L. Cheng, S. Gao, H. Zhao, Z. Cai and L. H. Huo, Sens. Actuators, B, 2015, 208, 406–414 Search PubMed.
- Y. Liu and W. Zeng, J. Mater. Sci.: Mater. Electron., 2016, 27, 12996–13001 Search PubMed.
- N. Joshi, L. F. da Silva, F. M. Shimizu, V. R. Mastelaro, J. C. M’Peko, L. Lin and O. N. Oliveira, Microchim. Acta, 2018, 185(4), 213, DOI:10.1007/s00604-019-3532-4.
- N. Joshi, L. F. Da Silva, H. Jadhav, J. C. M’Peko, B. B. Millan Torres, K. Aguir, V. R. Mastelaro and O. N. Oliveira, RSC Adv., 2016, 6, 92655–92662 Search PubMed.
- N. Joshi, L. F. da Silva, H. S. Jadhav, F. M. Shimizu, P. H. Suman, J. C. M’Peko, M. O. Orlandi, J. G. Seo, V. R. Mastelaro and O. N. Oliveira, Sens. Actuators, B, 2018, 257, 906–915 Search PubMed.
- N. Joshi, V. Saxena, A. Singh, S. P. Koiry, A. K. Debnath, M. M. Chehimi, D. K. Aswal and S. K. Gupta, Sens. Actuators, B, 2014, 200, 227–234 Search PubMed.
- N. Joshi, M. L. Braunger, F. M. Shimizu, A. Riul and O. N. Oliveira, Two-Dimensional Transition Metal Dichalcogenides for Gas Sensing Applications, Springer, Cham, 2020, pp. 131–155 Search PubMed.
- K. Wetchakun, T. Samerjai, N. Tamaekong, C. Liewhiran, C. Siriwong, V. Kruefu, A. Wisitsoraat, A. Tuantranont and S. Phanichphant, Sens. Actuators, B, 2011, 160, 580–591 Search PubMed.
- N. Joshi, T. Hayasaka, Y. Liu, H. Liu, O. N. Oliveira and L. Lin, Microchim. Acta, 2018, 185, 1–16 Search PubMed.
- T. Wagner, S. Haffer, C. Weinberger, D. Klaus and M. Tiemann, Chem. Soc. Rev., 2013, 42, 4036–4053 Search PubMed.
- M. M. Xavier, P. R. Nair and S. Mathew, Analyst, 2019, 144, 1475–1491 Search PubMed.
- C. Dong, R. Zhao, L. Yao, Y. Ran, X. Zhang and Y. Wang, J. Alloys Compd., 2020, 820, 153194 Search PubMed.
- S. Yang, C. Jiang and S. Huai Wei, Appl. Phys. Rev., 2017, 4, 021304 Search PubMed.
- S. Yang, Y. Liu, W. Chen, W. Jin, J. Zhou, H. Zhang and G. S. Zakharova, Sens. Actuators, B, 2016, 226, 478–485 Search PubMed.
- S. He, W. Li, L. Feng and W. Yang, J. Alloys Compd., 2019, 783, 574–582 Search PubMed.
- Y. Liu, S. Yang, Y. Lu, N. V. Podval’naya, W. Chen and G. S. Zakharova, Appl. Surf. Sci., 2015, 359, 114–119 Search PubMed.
- S. Bai, C. Chen, D. Zhang, R. Luo, D. Li, A. Chen and C. C. Liu, Sens. Actuators, B, 2014, 204, 754–762 Search PubMed.
- S. Yang, Z. Wang, Y. Hu, X. Luo, J. Lei, D. Zhou, L. Fei, Y. Wang and H. Gu, ACS Appl. Mater. Interfaces, 2015, 7, 9247–9253 Search PubMed.
- Z. Li, W. Wang, Z. Zhao, X. Liu and P. Song, Mater. Sci. Semicond. Process., 2017, 66, 33–38 Search PubMed.
- A. A. Mane and A. V. Moholkar, Solid-State Electron., 2018, 139, 21–30 Search PubMed.
- S. Yang, Y. Liu, T. Chen, W. Jin, T. Yang, M. Cao, S. Liu, J. Zhou, G. S. Zakharova and W. Chen, Appl. Surf. Sci., 2017, 393, 377–384 Search PubMed.
- F. Qu, X. Zhou, B. Zhang, S. Zhang, C. Jiang, S. Ruan and M. Yang, J. Alloys Compd., 2019, 782, 672–678 Search PubMed.
- Z. Li, P. Song, Z. Yang and Q. Wang, Ceram. Int., 2018, 44, 3364–3370 Search PubMed.
- S. Yang, Z. Wang, Y. Zou, X. Luo, X. Pan, X. Zhang, Y. Hu, K. Chen, Z. Huang, S. Wang, K. Zhang and H. Gu, Sens. Actuators, B, 2017, 248, 160–168 Search PubMed.
- P. Yang, X. Li, H. Huang, S. Yang, X. Zhang, Y. Hu, Z. Wang and H. Gu, Int. J. Hydrogen Energy, 2020, 45, 23841–23850 Search PubMed.
- S. Bai, J. Han, X. Fan, J. Guo, R. Luo, D. Li and A. Chen, New J. Chem., 2020, 44, 2402–2407 Search PubMed.
- M. M. Mohamed, T. M. Salama, M. Morsy, R. M. A. Shahba and S. H. Mohamed, Sens. Actuators, B, 2019, 299, 126960 Search PubMed.
- B. Geeta Rani, R. Saisri, S. Kailasa, M. Sai Bhargava Reddy, H. Maseed and K. Venkateswara Rao, J. Mater. Sci., 2020, 55, 8109–8122 Search PubMed.
- S. Kumar, A. Singh, R. Singh, S. Singh, P. Kumar and R. Kumar, Sens. Actuators, B, 2020, 325, 128974 Search PubMed.
- T. Thomas, Y. Kumar, J. A. Ramos Ramón, V. Agarwal, S. Sepúlveda Guzmán, R. Reshmi, S. Pushpan, S. L. Loredo and K. C. Sanal, Vacuum, 2021, 184, 109983 Search PubMed.
- S. Bai, C. Chen, M. Cui, R. Luo, A. Chen and D. Li, RSC Adv., 2015, 5, 50783–50789 Search PubMed.
- B. Mandal, Aaryashree, M. Das, M. Than Htay and S. Mukherjee, Mater. Res. Bull., 2019, 109, 281–290 Search PubMed.
- X. Chu, S. Liang, W. Sun, W. Zhang, T. Chen and Q. Zhang, Sens. Actuators, B, 2010, 148, 399–403 Search PubMed.
- G. T. Santos, A. A. Felix and M. O. Orlandi, Surfaces, 2020, 4, 9–16 Search PubMed.
- R. Xu, N. Zhang, L. Sun, C. Chen, Y. Chen, C. Li and S. Ruan, RSC Adv., 2016, 6, 106364–106369 Search PubMed.
- R. Malik and V. K. Tomer, Renewable Sustainable Energy Rev., 2021, 135, 110235 Search PubMed.
- Y. Wu, Q. Huang, J. Nie, J. Liang, N. Joshi, T. Hayasaka, S. Zhao, M. Zhang, X. Wang and L. Lin, J. Nanosci. Nanotechnol., 2019, 19, 5310–5316 Search PubMed.
- H. Liu, Y. Liu, Y. Chu, T. Hayasaka, N. Joshi, Y. Cui, X. Wang, Z. You and L. Lin, Sens. Actuators, B, 2018, 263, 94–102 Search PubMed.
- V. K. Tomer, R. Malik and N. Joshi, J. Nanosci. Nanotechnol., 2019, 19, 5052–5053 Search PubMed.
- Y. Han, D. Huang, Y. Ma, G. He, J. Hu, J. Zhang, N. Hu, Y. Su, Z. Zhou, Y. Zhang and Z. Yang, ACS Appl. Mater. Interfaces, 2018, 10, 22640–22649 Search PubMed.
- S. Yang, G. Lei, L. Tan, H. Xu, J. Xiong, Z. Wang and H. Gu, J. Alloys Compd., 2021, 877, 160200 Search PubMed.
- A. Gusain, N. J. Joshi, P. V. Varde and D. K. Aswal, Sens. Actuators, B, 2017, 239, 734–745 Search PubMed.
- A. Mekki, N. Joshi, A. Singh, Z. Salmi, P. Jha, P. Decorse, S. Lau-Truong, R. Mahmoud, M. M. Chehimi, D. K. Aswal and S. K. Gupta, Org. Electron., 2014, 15, 71–81 Search PubMed.
- A. Singh, A. Kumar, A. Kumar, S. Samanta, N. Joshi, V. Balouria, A. K. Debnath, R. Prasad, Z. Salmi, M. M. Chehimi, D. K. Aswal and S. K. Gupta, Appl. Phys. Lett., 2013, 102, 132107 Search PubMed.
- A. Singh, Z. Salmi, N. Joshi, P. Jha, A. Kumar, H. Lecoq, S. Lau, M. M. Chehimi, D. K. Aswal and S. K. Gupta, RSC Adv., 2013, 3, 5506–5523 Search PubMed.
- S. Thomas, N. Joshi and V. K. Tomer, Functional Nanomaterials: Advances in Gas Sensing Technologies, Springer Singapore, Singapore, 2020 Search PubMed.
- V. K. Tomer, N. Thangaraj, S. Gahlot and K. Kailasam, Nanoscale, 2016, 8, 19794–19803 Search PubMed.
- V. K. Tomer, P. V. Adhyapak, S. Duhan and I. S. Mulla, Microporous Mesoporous Mater., 2014, 197, 140–147 Search PubMed.
- R. Malik, P. S. Rana, V. K. Tomer, V. Chaudhary, S. P. Nehra and S. Duhan, Microporous Mesoporous Mater., 2016, 225, 245–254 Search PubMed.
- V. K. Tomer, R. Malik and K. Kailasam, ACS Omega, 2017, 2, 3658–3668 Search PubMed.
- R. Malik, V. Chaudhary, V. K. Tomer, P. S. Rana, S. P. Nehra and S. Duhan, Ceram. Int., 2016, 42, 10892–10901 Search PubMed.
- R. Malik and V. K. Tomer, J. Mater. Chem. A, 2018, 6, 10718–10730 Search PubMed.
- V. K. Tomer, K. Singh, H. Kaur, M. Shorie and P. Sabherwal, Sens. Actuators, B, 2017, 253, 703–713 Search PubMed.
- V. K. Tomer and S. Duhan, Sens. Actuators, B, 2015, 220, 192–200 Search PubMed.
- V. K. Tomer, R. Malik and V. Chaudhary, Appl. Mater. Today, 2019, 16, 193–203 Search PubMed.
- R. Malik, V. K. Tomer, V. Chaudhary, M. S. Dahiya, A. Sharma, S. P. Nehra, S. Duhan and K. Kailasam, J. Mater. Chem. A, 2017, 5, 14134–14143 Search PubMed.
- C. Anichini, W. Czepa, D. Pakulski, A. Aliprandi, A. Ciesielski and P. Samorì, Chem. Soc. Rev., 2018, 47, 4860–4908 Search PubMed.
- E. Poonia, P. K. Mishra, V. Kiran, J. Sangwan, R. Kumar, P. K. Rai, R. Malik, V. K. Tomer, R. Ahuja and Y. K. Mishra, J. Mater. Chem. C, 2019, 7, 5477–5487 Search PubMed.
- J. Nie, Y. Wu, Q. Huang, N. Joshi, N. Li, X. Meng, S. Zheng, M. Zhang, B. Mi and L. Lin, ACS Appl. Mater. Interfaces, 2019, 11, 1699–1705 Search PubMed.
- Y. Wang, R. Zhang, Z. Zhang, J. Cao and T. Ma, Adv. Mater. Interfaces, 2019, 6, 1901429 Search PubMed.
- R. K. Jha and N. Bhat, Adv. Mater. Interfaces, 2020, 7, 1901992 Search PubMed.
- F. Rahman, A. Zavabeti, M. A. Rahman, A. Arash, A. Mazumder, S. Walia, S. Sriram, M. Bhaskaran and S. Balendhran, ACS Appl. Mater. Interfaces, 2019, 11, 40189–40195 Search PubMed.
- H. Yan, P. Song, S. Zhang, J. Zhang, Z. Yang and Q. Wang, Sens. Actuators, B, 2016, 236, 201–207 Search PubMed.
- Z. Tang, X. Deng, Y. Zhang, X. Guo, J. Yang, C. Zhu, J. fan, Y. Shi, B. Qing and F. Fan, Sens. Actuators, B, 2019, 297, 126730 Search PubMed.
- X. Gao, Q. Ouyang, C. Zhu, X. Zhang and Y. Chen, ACS Appl. Nano Mater., 2019, 2, 2418–2425 Search PubMed.
- H. M. M. Munasinghe Arachchige, D. Zappa, N. Poli, N. Gunawardhana and E. Comini, Sens. Actuators, B, 2018, 269, 331–339 Search PubMed.
- D. Chen, M. Liu, L. Yin, T. Li, Z. Yang, X. Li, B. Fan, H. Wang, R. Zhang, Z. Li, H. Xu, H. Lu, D. Yang, J. Sun and L. Gao, J. Mater. Chem., 2011, 21, 9332–9342 Search PubMed.
- A. A. Felix, R. A. Silva and M. O. Orlandi, CrystEngComm, 2020, 22, 4640–4649 Search PubMed.
- J. Shen, S. Guo, C. Chen, L. Sun, S. Wen, Y. Chen and S. Ruan, Sens. Actuators, B, 2017, 252, 757–763 Search PubMed.
- H. Y. Li, L. Huang, X. X. Wang, C. S. Lee, J. W. Yoon, J. Zhou, X. Guo and J. H. Lee, RSC Adv., 2017, 7, 3680–3685 Search PubMed.
- R. Pandeeswari and B. G. Jeyaprakash, Biosens. Bioelectron., 2014, 53, 182–186 Search PubMed.
- A. A. Mane, S. A. Nikam and A. V. Moholkar, Mater. Chem. Phys., 2018, 216, 294–304 Search PubMed.
- S. Farzi-kahkesh, M. B. Rahmani and A. Fattah, Mater. Sci. Semicond. Process., 2020, 120, 105263 Search PubMed.
- H. Ma, H. Fang, W. Wu, C. Zheng, L. Wu and H. Wang, RSC Adv., 2020, 10, 25467–25474 Search PubMed.
- W. Jiang, D. Wei, S. Zhang, X. Chuai, P. Sun, F. Liu, Y. Xu, Y. Gao, X. Liang and G. Lu, New J. Chem., 2018, 42, 15111–15120 Search PubMed.
- D. K. Halwar, V. V. Deshmane and A. V. Patil, Mater. Res. Express, 2019, 6, 105913 Search PubMed.
- V. K. Tomer, S. Duhan, A. K. Sharma, R. Malik, S. P. Nehra and S. Devi, Colloids Surf., A, 2015, 483, 121–128 Search PubMed.
- A. Kumar, N. Joshi, S. Samanta, A. Singh, A. K. Debnath, A. K. Chauhan, M. Roy, R. Prasad, K. Roy, M. M. Chehimi, D. K. Aswal and S. K. Gupta, Sens. Actuators, B, 2015, 206, 653–662 Search PubMed.
- S. Duhan and V. K. Tomer, in Advanced Sensor and Detection Materials, ed. A. Tiwari and M. M. Demir, John Wiley and Sons Ltd, 2014, pp. 149–192 Search PubMed.
- V. K. Tomer, S. Devi, R. Malik, S. P. Nehra and S. Duhan, Microporous Mesoporous Mater., 2016, 219, 240–248 Search PubMed.
- V. K. Tomer, S. Duhan, P. V. Adhyapak and I. S. Mulla, J. Am. Ceram. Soc., 2015, 98, 741–747 Search PubMed.
- V. K. Tomer and S. Duhan, Sens. Actuators, B, 2015, 212, 517–525 Search PubMed.
- P. V. Adhyapak, S. P. Meshram, V. Tomar, D. P. Amalnerkar and I. S. Mulla, Ceram. Int., 2013, 39, 7367–7378 Search PubMed.
- Y. Li, Phys. E, 2017, 94, 22–24 Search PubMed.
- H. Ji, W. Zeng and Y. Li, Mater. Res. Bull., 2019, 118, 110476 Search PubMed.
- Y. Sun, L. Chen, Y. Wang, Z. Zhao, P. Li, W. Zhang, Y. Leprince-Wang and J. Hu, J. Mater. Sci., 2017, 52, 1561–1572 Search PubMed.
- V. K. Tomer and S. Duhan, J. Mater. Chem. A, 2016, 4, 1033–1043 Search PubMed.
- J. Wang, Q. Zhou, Z. Wei, L. Xu and W. Zeng, Ceram. Int., 2020, 46, 29222–29232 Search PubMed.
- T. Li, W. Zeng, Y. Zhang and S. Hussain, Mater. Lett., 2015, 160, 476–479 Search PubMed.
- L. Sui, X. Song, X. Cheng, X. Zhang, Y. Xu, S. Gao, P. Wang, H. Zhao and L. Huo, CrystEngComm, 2015, 17, 6493–6503 Search PubMed.
- Y. Xia, C. Wu, N. Zhao and H. Zhang, Mater. Lett., 2016, 171, 117–120 Search PubMed.
- H. Li, D. Zhu, Z. Yang, W. Lu and Y. Pu, Appl. Surf. Sci., 2019, 489, 384–391 Search PubMed.
- Y. Xu, J. Yang, J. Liu, B. Li and L. Han, Dalton Trans., 2020, 49, 8114–8121 Search PubMed.
- J. Hu, M. Zhang, X. Wang, Y. Sun, P. Li, W. Zhang, K. Lian, L. Chen and Y. Chen, RSC Adv., 2017, 7, 23478–23485 Search PubMed.
- H. Qin, J. Xie, H. Xu, Y. Li and Y. Cao, Mater. Res. Bull., 2017, 93, 256–263 Search PubMed.
- H. Qin, Y. Cao, J. Xie, H. Xu and D. Jia, Sens. Actuators, B, 2017, 242, 769–776 Search PubMed.
- S. Wang, J. Xie, J. Hu, H. Qin and Y. Cao, Appl. Surf. Sci., 2020, 512, 145722 Search PubMed.
- L. Sui, X. Zhang, X. Cheng, P. Wang, Y. Xu, S. Gao, H. Zhao and L. Huo, ACS Appl. Mater. Interfaces, 2017, 9, 1661–1670 Search PubMed.
- F. Zhang, X. Dong, X. Cheng, Y. Xu, X. Zhang and L. Huo, ACS Appl. Mater. Interfaces, 2019, 11, 11755–11762 Search PubMed.
- W. I. Lee, M. Bonyani, J. K. Lee, C. Lee and S. B. Choi, Curr. Appl. Phys., 2018, 18, S60–S67 Search PubMed.
- K. Xu, S. Duan, Q. Tang, Q. Zhu, W. Zhao, X. Yu, Y. Yang, T. Yu and C. Yuan, CrystEngComm, 2019, 21, 5834–5844 Search PubMed.
- X. Gao, C. Li, Z. Yin and Y. Chen, RSC Adv., 2015, 5, 37703–37709 Search PubMed.
- L. Zhu, W. Zeng, Y. Li and J. Yang, Phys. E, 2019, 106, 170–175 Search PubMed.
- W. Jiang, L. Meng, S. Zhang, X. Chuai, Z. Zhou, C. Hu, P. Sun, F. Liu, X. Yan and G. Lu, Sens. Actuators, B, 2019, 299, 126888 Search PubMed.
- J. Zhang, P. Song, J. Li, Z. Yang and Q. Wang, Sens. Actuators, B, 2017, 249, 458–466 Search PubMed.
- R. Kumar, W. Zheng, X. Liu, J. Zhang and M. Kumar, Adv. Mater. Technol., 2020, 5, 1901062 Search PubMed.
- H. Singh, V. K. Tomer, N. Jena, I. Bala, N. Sharma, D. Nepak, A. De Sarkar, K. Kailasam and S. K. Pal, J. Mater. Chem. A, 2017, 5, 21820–21827 Search PubMed.
- A. T. Güntner, S. Abegg, K. Wegner and S. E. Pratsinis, Sens. Actuators, B, 2018, 257, 916–923 Search PubMed.
- J. Li, L. Wang, H. Liu, J. Zhao, X. Li, H. Wei and Y. Han, J. Alloys Compd., 2017, 694, 939–945 Search PubMed.
- J. Li, H. Liu, H. Fu, L. Xu, H. Jin, X. Zhang, L. Wang and K. Yu, J. Alloys Compd., 2019, 788, 248–256 Search PubMed.
- Y. Mo, Z. Tan, L. Sun, Y. Lu and X. Liu, J. Alloys Compd., 2020, 812, 152166 Search PubMed.
- X. Li, D. Jiang, Y. Fan, N. Zhang, C. Liu, S. Adimi, J. Zhou, S. Wen and S. Ruan, Inorg. Chem. Front., 2020, 7, 1704–1712 Search PubMed.
- D. Jiang, W. Wei, F. Li, Y. Li, C. Liu, D. Sun, C. Feng and S. Ruan, RSC Adv., 2015, 5, 39442–39448 Search PubMed.
- Z. Li, W. Wang, Z. Zhao, X. Liu and P. Song, RSC Adv., 2017, 7, 28366–28372 Search PubMed.
- H. Fu, Z. Wu, X. Yang, P. He, X. An, S. Xiong and D. Han, Appl. Surf. Sci., 2021, 542, 148721 Search PubMed.
- S. Zhang, P. Song, J. Zhang, Z. Li, Z. Yang and Q. Wang, RSC Adv., 2016, 6, 50423–50430 Search PubMed.
| This journal is © The Royal Society of Chemistry 2021 |

