 Open Access Article
A dual colorimetric probe for rapid environmental monitoring of Hg2+ and As3+ using gold nanoparticles functionalized with D-penicillamine
Su-Jin Yoon†
ac,
Yun-Sik Nam†b,
Yeonhee Lee b,
In Hwan Oha and
Kang-Bong Lee
 *ac
*ac
aNational Agenda Research Division, Korea Institute of Science & Technology, Hwarang-ro 14-gil 5, Seongbuk-gu, Seoul 02792, Republic of Korea. E-mail: leekb@kist.re.kr; Fax: +82 2 958 5810; Tel: +82 2 958 5957
bAdvanced Analysis Center, Korea Institute of Science & Technology, Hwarang-ro 14-gil 5, Seongbuk-gu, Seoul 02792, Republic of Korea
cUniversity of Science and Technology, Gajeong-ro 217, Yuseong-gu, Daejeon 34113, Republic of Korea
First published on 29th January 2021
Abstract
A highly sensitive and selective colorimetric assay for the dual detection of Hg2+ and As3+ using gold nanoparticles (AuNPs) conjugated with D-penicillamine (DPL) was developed. When Hg2+ and As3+ ions coordinate with AuNP-bound DPLs, the interparticle distance decreases, inducing aggregation; this results in a significant color change from wine red to dark midnight blue. The Hg4f and As3d signals in the X-ray photoelectron spectra of Hg2+ (As3+)-DPL-AuNPs presented binding energies indicative of Hg2+–N(O) and As3+–N(O) bonds, and the molecular fragment observed in time-of-flight secondary ion mass spectra confirmed that Hg2+ and As3+ coordinated with two oxygen and two nitrogen atoms in DPL. The detection of Hg2+ and As3+ can be accomplished by observing the color change with the naked eye or by photometric methods, and this was optimized to provide optimal probe sensitivity. The assay method can be applied for environmental monitoring by first selectively quantifying Hg2+ in water samples at pH 6, then estimating the As3+ concentration at pH 4.5. The efficiency of the DPL-AuNP probe was evaluated for the sequential quantification of Hg2+ and As3+ in tap, pond, waste, and river water samples, and absorbance ratios (A730/A525) were correlated with Hg2+ and As3+ concentrations in the linear range of 0–1.4 μM. The limits of detection in water samples were found to be 0.5 and 0.7 nM for Hg2+ and As3+, respectively. This novel probe can be utilized for the dual determination of Hg2+ and As3+, even in the presence of interfering substances in environmental samples.
1 Introduction
Mercury ions are ubiquitous in the environment as both inorganic and organic compounds, since reagents containing mercury are widely used in industry, agriculture, and medicine.1,2 Hg2+ ions are nonessential and toxic to humans. They accumulate mainly in the kidneys, and give rise to vomiting and diarrhea followed by hypovolemic shock, oliguric renal failure, and possibly death.3,4 Thus, the US Environmental Protection Agency and the World Health Organization (WHO) have established maximum permissible levels of Hg in drinking water of 10 and 30 nM, respectively.5,6Arsenic is a toxic substance with acute and chronic effects; long-term exposure to arsenic can cause various cancers and other serious diseases.7 The concentration of arsenic in the environment can be elevated by various anthropogenic activities and natural processes.8 Arsenic contamination in drinking water has been prevalent worldwide, and as many as 140 million people may have been exposed to drinking water with arsenic levels higher than the WHO guideline of 0.13 μM.8
Several analytical techniques including atomic absorption spectroscopy,9 atomic fluorescence spectroscopy,10 inductively coupled plasma-atomic emission spectrometry,11 and inductively coupled plasma-mass spectrometry12,13 have been utilized for the consecutive determination of Hg2+ and As3+ ions. However, these methods generally require complicated sample pretreatment processes, skillful technicians, and sophisticated instrument facilities. Therefore, the development of a low-cost and easy-to-use analytical method for the selective detection of these two toxic ions would be highly desirable for analytical chemists.
Nanoparticle (NP)-based colorimetric assays for the selective detection of Hg2+ ions using silver nanoparticles (AgNPs),14,15 silver nanoprisms,16 gold nanoparticles (AuNPs),17–19 gold nanostars,20 SiO2 core–shell NPs,21 and carbon nanoparticles (CNPs)22 have recently been reported, and assays for the sensing of As3+ ions using AgNPs,23,24 AuNPs,25,26 and copper nanoparticles (CuNPs)27 were documented.
Although a method for the simultaneous sensing of Hg2+ and As3+ ions has been previously reported, it crudely involved two AuNP probes functionalized with different ligands.28 Herein, we report the development of a single sensing probe for monitoring both Hg2+ and As3+ ions using AuNPs functionalized with D-penicillamine (DPL) as a dual-response sensor. This AuNP probe is especially promising for the consecutive analysis of Hg2+ and As3+ ions using the naked eye or UV-Vis spectroscopy due to the high extinction coefficients of the species involved and their interparticle-distance-dependent optical properties.
DPL is a medication primarily used for the treatment of Wilson's disease. It is also used for patients with kidney stones who have high urine cystine levels or rheumatoid arthritis and in the treatment of poisoning with various heavy metals. Its amine and carboxyl groups provide active sites that can form strong interactions with chelated species, and the oxygen (or nitrogen) atoms of DPL could be expected to specifically coordinate with mercury and arsenic cations as a function of pH.
The present study demonstrates that DPL-AuNPs aggregate in the presence of mercury and/or arsenic ions as a function of pH, selectively inducing a definite color change in the AuNPs in the presence of other ions. Dispersed AuNPs and those aggregated upon the addition of Hg2+ or As3+ ions were characterized using UV-Vis spectroscopy, high-resolution transmission electron microscopy (HR-TEM), and dynamic light scattering (DLS). The Hg2+ ion binding sites on the surface of the DPL-AuNPs were elucidated using Fourier-transform infrared spectroscopy (FTIR), X-ray photoelectron spectroscopy (XPS) and time-of-flight secondary ion mass spectrometry (TOF-SIMS). The interference effects of other metal ions and anions were tested. Furthermore, the developed DPL-AuNP assay for the consecutive detection of Hg2+ and As3+ ions was optimized in terms of pH, temperature, and salt concentration. The present assay method is straightforward and cost efficient and allows for the on-site dual detection of Hg2+ and As3+ ions in real time; the limits of detection (LOD) in water samples were 0.5 and 0.7 nM, respectively. Therefore, this technique could be utilized for the sequential determination of Hg2+ and As3+ concentration in a wide range of practical situations.
Although colorimetric AuNP sensors are extremely useful and simple, they are ordinarily employed only in single-target assays. Advances in material sciences and analytical techniques have enabled the development of novel multicolor AuNP sensors capable of detecting multiple-target from a single sample. This study demonstrated that a probe capable of sequentially detecting both Hg2+ and As3+ ions in various environmental matrices is more efficient and profitable than single-target nanoparticle probes. Although challenges still exist in the development of efficient and practical colorimetric AuNP probes, the scope for further advancements and practical applications of colorimetric strategies in environmental monitoring is undeniable.
2 Materials and methods
2.1 Materials
Hydrogen tetrachloroaurate(III) trihydrate (HAuCl4·3H2O), trisodium citrate (TSC), DPL, mercury(II) chloride, and arsenic trichloride were sourced from Sigma-Aldrich (St. Louis, MO, USA). The salts of the metal ions (Li+, Na+, K+, Ag+, Ba2+, Ca2+, Cd2+, Co2+, Cu2+, Mn2+, Mg2+, Ni2+, Pb2+, Sn2+, Zn2+, Al3+, Ga3+, Fe3+, Ti3+, Ge4+, and Cr6+) and anions (NO2−, NO3−, PO43−, SO42−, F−, Cl−, Br−, and I−) were purchased from Accu Standard (New Haven, CT, USA). NaCl, HCl, and NaOH were purchased from Samchun Chemical (Gyeong gi-Do, Republic of Korea). Distilled water was obtained using a Milli-Q water purification system (Millipore, Bedford, MA, USA). Reagents were used as received without further purification. To test the utility of the method, tap and pond water samples were collected from the Korea Institute of Science and Technology (KIST) campus.2.2 Preparation of AuNPs and DPL-AuNPs
The AuNPs were prepared by simple reduction of HAuCl4 with TSC as reported elsewhere.29,30 A specific size of AuNPs (∼20 nm) was prepared using a 3.0 mM TSC concentration. DPL-AuNPs were then prepared via a ligand-exchange reaction between DPL and citrate-stabilized AuNPs. A 0.3 mM solution of HAuCl4 in water (100 mL) was prepared in a round-bottom flask. The solution was heated under continuous stirring in a reflux condenser. Upon boiling, a 38.8 mM TSC solution was slowly injected. The color of the solution changed from pale yellow to wine red. The solution was heated at reflux for 30 min. Subsequently, the solution was cooled to room temperature and stored in a refrigerator at 4 °C. The self-aggregation of the DPL-AuNPs was tested; no color change was observed in the DPL-AuNP solution formed by the addition of 4 mM DPL, which indicated that the DPL-AuNP did not self-aggregate. The free DPL molecules in solution were removed by centrifugation at 6000 rpm for 10 min, yielding the DPL-AuNPs.2.3 Sample preparation for dual determination of Hg2+ and As3+ using DPL-AuNPs
Real water samples were collected from the laboratory tap and a pond at KIST. The tap water samples were used without further purification and spiked with known concentrations of Hg2+ and As3+ ions. The pond and waste water samples were filtered through 0.45 and 0.2 μm membranes and then spiked with standard solutions of Hg2+ and As3+ ions. To determine the Hg2+ and As3+ concentrations using the DPL-AuNPs, a range of Hg2+ and As3+ concentrations were prepared (0.0–2.0 μM). Each Hg2+ and As3+ solution was added to 1.8 mL of the DPL-AuNP solution, and the resulting mixtures were allowed to react for 2.0 min. Subsequently, the changes in their absorbance were monitored using UV-Vis. All experiments were carried out at 25 °C. Determination of Hg2+ (or As3+) was accomplished by plotting the ratio A730/A525 vs. the concentration of Hg2+ (or As3+).2.4 Instrumentation
UV-Vis absorption spectra were measured in the 300–800 nm range using polystyrene cells with a 1 mm path length and an S-3100 spectrophotometer S-3100 (Sinco, Seoul, Republic of Korea). Solution pH was measured using an HI 2210 pH meter (Hanna instruments, Woonsocket, RI, USA). FTIR spectra were obtained using an FTIR spectrometer (Thermo Mattson, Infinity Gold FTIR, Waltham, MA, USA) equipped with a mercury cadmium telluride detector and zinc selenide crystal ATR.31 DLS and zeta potential measurements were conducted using a Zetasizer instrument (Malvern Instruments Ltd, Worcestershire, UK). Images of the AuNPs, DPL-AuNPs, aggregated Hg2+-DPL-AuNPs, and aggregated As3+-DPL-AuNPs were obtained via transmission electron microscopy (TEM, Titan, FEI™, Oregon, USA) and used to determine their diameters. XPS was performed using a PHI 5000 VersaProbe (Ulvac-PHI, Kanagawa, Japan) with a background pressure of 2.0 × 10⁻⁷ Pa, monochromated Al Kα source (1486.6 eV) and anode (24.5 W, 15 kV). Mass spectra were measured using time of flight-secondary ion mass spectrometry (TOF-SIMS, IONTOF, Münster, Germany).3 Results and discussion
3.1 Characterization of AuNPs, DPL-AuNPs, and their complexes with Hg2+ and As3+
AuNPs with a specific size of ∼20 nm were prepared via the simple reduction of HAuCl4 with 3.0 mM TSC. The strong localized surface plasmon resonance peak of these AuNPs appears at ∼525 nm in their UV-Vis spectra, resulting in the wine-red color of the corresponding solutions, and the size of AuNPs has affected its surface plasmon absorption maxima. We obtained the IR spectra of DPL, DPL-AuNPs, Hg2+-DPL-AuNPs, and As3+-DPL-AuNPs. As expected, the IR spectrum of DPL shows a characteristic S–H stretching band at 2523 cm−1, which disappears in the IR spectrum of the DPL-AuNPs (Fig. 1A and B).32 This indicates that the DPL must be conjugated with the AuNPs through its sulfur atom. The free DPL molecules in solution were removed by centrifugation at 6000 rpm for 10 min to yield the DPL-AuNPs. Additionally, the COO− asymmetric stretching band observed at 1586 cm−1 in the DPL and DPL-AuNP spectra shifted to become an C![[double bond, length as m-dash]](https://www.rsc.org/images/entities/char_e001.gif) O stretching band at 1710 cm−1 after conjugation of DPL-AuNP with Hg2+ (or As3+), which indicates that Hg2+ (or As3+) must be coordinated with an oxygen atom of the COO− group in DPL (Fig. 1).33
O stretching band at 1710 cm−1 after conjugation of DPL-AuNP with Hg2+ (or As3+), which indicates that Hg2+ (or As3+) must be coordinated with an oxygen atom of the COO− group in DPL (Fig. 1).33
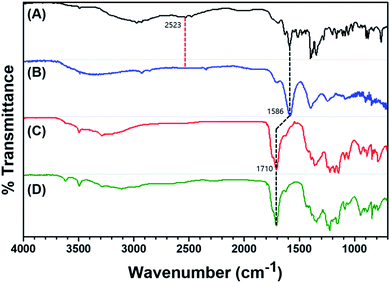 | ||
| Fig. 1 FTIR spectra of (A) DPL, (B) DPL-AuNPs, (C) Hg2+-DPL-AuNPs, and (D) As3+-DPL-AuNPs at pH 4.5, NaCl 250 mM, and 30 °C. | ||
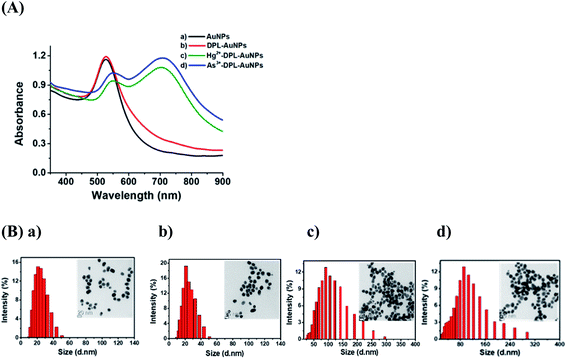
The UV-Vis absorption spectra of the AuNPs, DPL-AuNPs, Hg2+-DPL-AuNPs, and As3+-DPL-AuNPs solutions are shown in Fig. 2A. UV-Vis spectroscopic analysis of the DPL-AuNPs was performed daily over one month to evaluate the stability of the colloidal suspensions at room temperature. The spectra remained unchanged over this period (not shown). Thus, AuNPs functionalized with DPL were stable for a month in terms of dispersion state, morphology, size, and surface chemistry.
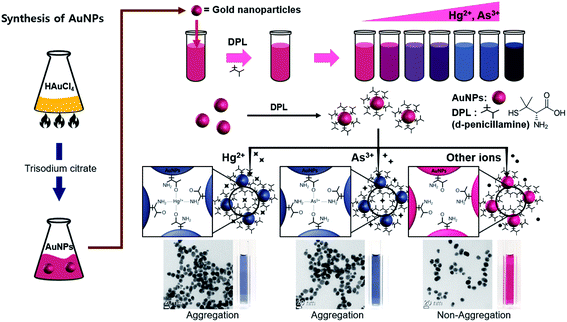
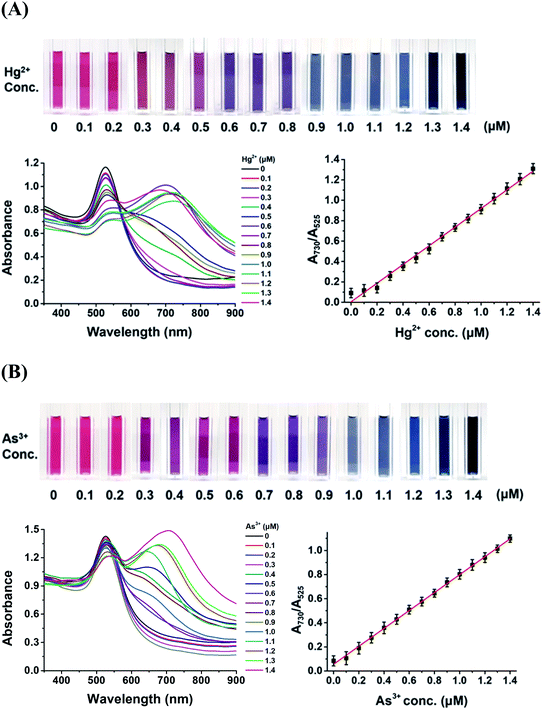
Functionalized AuNPs can serve as localized surface plasmon resonance (LSPR) probes owing to their sensitive spectral response to local changes in the environment surrounding the nanoparticle surface. The absorbance spectra of DPL-AuNPs changed dramatically with respect to both peak position and intensity as a result of aggregation induced by the addition of Hg2+ or As3+. Upon the addition of Hg2+ (or As3+) ions, the intense absorption band of the DPL-AuNPs at 525 nm gradually shifted to 730 nm, and this LSPR shift resulted in the appearance and increase in intensity of a new absorbance band (Fig. 2A). In aggregated DPL-AuNPs, the conduction electrons near the surfaces become delocalized and are shared amongst neighboring particles. As a result, the surface plasmon resonance shifts to a lower energy, causing a change in absorption to longer wavelengths. In the current study, the sizes of the DPL-AuNPs and Hg2+-DPL-AuNPs (or As3+-DPL-AuNPs) were distributed around ∼20 and ∼90 nm, respectively, according to Zetasizer measurements and TEM images (Fig. 2B). The color of the DPL-AuNPs is similar to those of previously reported label-free AuNPs, but a distinct color change from wine red to dark midnight blue occurred upon the addition of Hg2+ or As3+ ions. When Hg2+ and As3+ ions coordinate with AuNP-bound DPL, the interparticle distance decreases, inducing aggregation; this is accompanied by a significant color change of the probe/analyte mixture. In addition, this selective aggregation of DPL-AuNPs could be harnessed to remove toxic Hg2+ and As3+ ions from drinking water.34–36
3.2 Binding sites of Hg2+ (or As3+) ions to DPL-AuNP
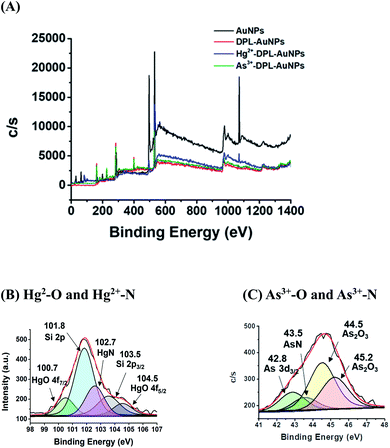
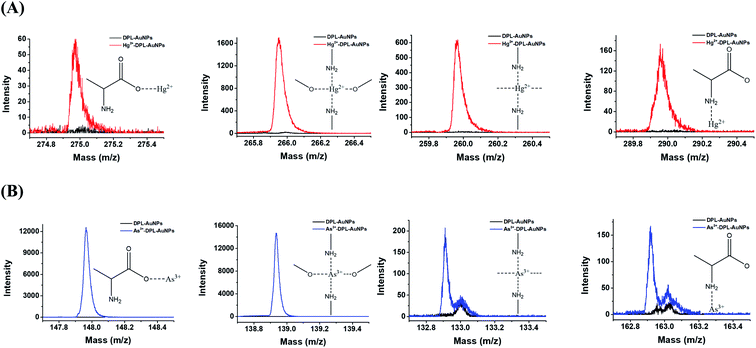
XPS spectra of the AuNPs, DPL-AuNPs, Hg2+-DPL-AuNPs, and As3+-DPL-AuNPs were measured to investigate the sites the binding of the Hg2+ (or As3+) ions to the DPL-AuNPs (Fig. 3). The high-resolution Hg4f signals of the Hg2+-DPL-AuNPs at 100.7 eV and 104.5 eV were attributed to Hg2+–O bonds, and the Hg4f signal at 102.7 eV was attributed to the binding energy of an Hg2+–N bond. The high-resolution As3d signal of the As3+-DPL-AuNPs at 44.5 eV was attributed to As3+–O bonds, while the As3d signal at 43.5 eV was ascribed to the binding energy of an As3+–N bond.37–39The TOF-SIMS spectra of the DPL-AuNPs, Hg2+-DPL-AuNPs, and As3+-DPL-AuNPs provide additional information regarding the sites of the binding of Hg2+ and As3+ to the DPL-AuNPs (Fig. 4). These mass spectra reveal signals corresponding to the molecular fragments NH2CHCO2Hg2+ (m/z: 274.97), (NH2O)2Hg2+ (m/z: 265.97), (CHNH2)2Hg2+ (m/z: 259.97), and CH3NH2CHCO2Hg2+(m/z: 274.97) for the Hg2+-DPL-AuNPs. Additionally, NH2CHCO2As3+ (m/z: 147.92), (NH2O)2As3+ (m/z: 138.92) (CHNH2)2As3+ (m/z: 132.92), CH3NH2CHCO2As3+ (m/z:162.92) fragments were observed in the mass spectrum of the As3+-DPL-AuNPs. These molecular fragments do not appear for the DPL-AuNPs, confirming that Hg2+ and As3+ must be coordinated with the two oxygen atoms of the carboxyl group and two nitrogen atoms of the amine group in DPL.40
3.3 Selectivity of DPL-AuNPs for Hg2+ and As3+ ions and related interference effects
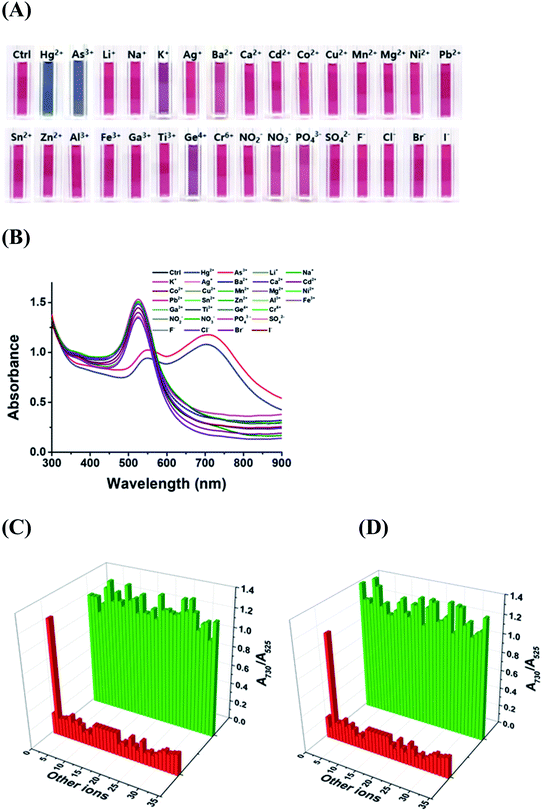
The selectivity of the DPL-AuNP probe was tested by comparing the A730/A525 ratio of the Hg2+ and As3+ ions with those of various metal cations (Li+, Na+, K+, Ag+, Ba2+, Ca2+, Cd2+, Co2+, Cu2+, Mn2+, Mg2+, Ni2+, Pb2+, Sn2+, Zn2+, Al3+, Fe3+, Ga3+, Ti3+, Ge4+, and Cr6+) and anions (NO2−, NO3−, PO43−, SO42−, F−, Cl−, Br−, and I−) under the same conditions. The AuNPs conjugated with DPL responded selectively to Hg2+ or As3+ ions, as indicated by the profound color change, UV-Vis spectral change, and dramatic increase in A730/A525 (Fig. 5A and B). Thus, we successfully achieved the aggregation of DPL-AuNPs using Hg2+ or As3+ ions. The decrease in the A525 value, and the development of a new absorbance band at 730 nm were attributed to the coupled plasmon absorbance of the AuNPs due to closer contact with other AuNPs as a result of aggregation. The A730/A525 values induced by Hg2+ or As3+ ions were at least six times greater than those observed in the presence of other metal cations and anions, indicating a distinct interaction between the DPL-AuNPs and Hg2+ (or As3+) ions. In other words, Hg2+ (or As3+) ions must exhibited highly preferential affinity for the oxygen and nitrogen atoms of DPL compared to that of all the metal ions tested, and the proposed geometrical shape of the resulting complex is displayed in Scheme 1.To test for interference of the other ions in the selectivity of the probe toward Hg2+ or As3+, the changes in the spectra of the sensors with 1 μM Hg2+ or 1 μM As3+ were evaluated in the presence of 0.1 mM of the other ions. The other ions did not interfere with the determination of Hg2+ or As3+, even when the concentrations were much higher than that of Hg2+ or As3+ (Fig. 5C). Therefore, the proposed method could be utilized for the selective determination of Hg2+ or As3+, even in the presence of high concentrations of possible interfering substances.
3.4 Optimum conditions for the DPL-AuNP probe
To optimize the sensitivity of the DPL-AuNP probe for Hg2+ and As3+, different pH values, temperatures, salt concentrations, and reaction time were tested. The excellent selectivity of the DPL-AuNPs for both Hg2+ and As3+ ions was effective only within a specific pH range. That is, the Hg2+ and As3+ ions did not cause any color change at pH values higher than 8 and 5, respectively (Fig. 6). The absorbance ratios (A730/A525) changed as a function of the pH, and were highest at pH 6 and pH 4.5 for Hg2+ and As3+, respectively (Fig. 6). Therefore, the Hg2+ ions can be determined selectively and optimally at pH 6, after which the concentration of the As3+ ions can be measured by subtracting the Hg2+ ion concentration observed at pH 6 from the total concentration of Hg2+ and As3+ ions measured at pH 4.5. The optimum pH values of the DPL-AuNP probe for Hg2+ and As3+ sensing seemed to be related to the pKa values of its functional groups (pKa of carboxyl group: ∼1.8; pKa of amino group: ∼7.8) and the conformation of DPL.41 Thus, Hg2+ and As3+ are optimally coordinated to the oxygen atoms of the carboxyl group and the nitrogen atoms of the amino group in DPL at pH 6 and 4.5, respectively, which provides the highest probe sensitivity.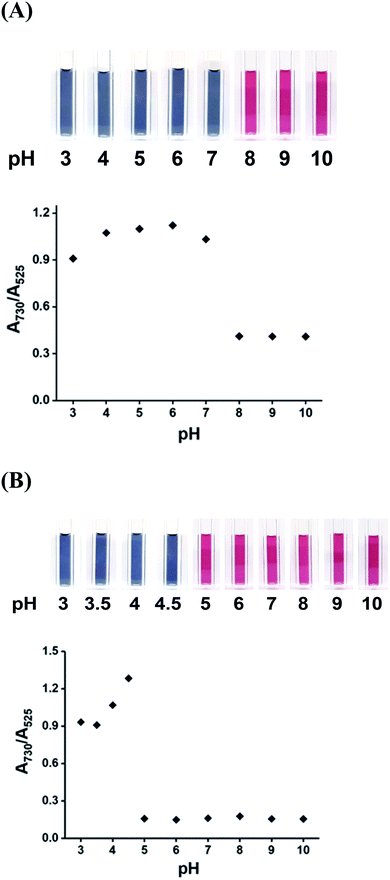 | ||
| Fig. 6 Photographic images and absorption ratios (A730/A525) of DPL-AuNP in the presence of (A) 5.0 μM Hg2+ ions, and (B) 5.0 μM As3+ ions as a function of pH. | ||
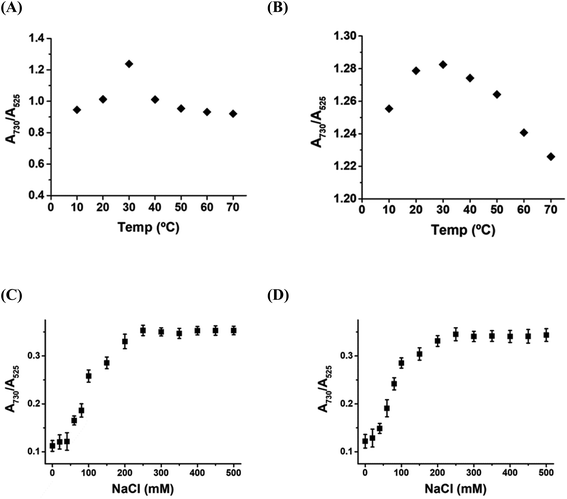
The sensitivity of the DPL-AuNP probe towards Hg2+ and As3+ ions was examined as a function of temperature in the range 10–70 °C, and its sensitivity was found to be optimum at 30 °C (Fig. 7A). Furthermore, the sensitivity of the DPL-AuNP probe was monitored as a function of the NaCl concentration, and found to be greatest at a NaCl concentration of 250 mM (Fig. 7B).
The optimum concentration of DPL to be conjugated with the AuNPs was investigated using a 1.0 μM Hg2+ (or As3+) solution, and the absorbance ratios (A730/A525) in the resulting UV-Vis spectra revealed that optimal concentration of DPL was ∼33 μM (data not shown).
3.5 Quantitation of Hg2+ and As3+ using the DPL-AuNP assay method
The changes in the color, UV-Vis spectra, and TEM images of the DPL-AuNP probe upon the addition of Hg2+ and As3+ ions were monitored. The color of the DPL-AuNPs changed gradually from wine red to midnight blue as the concentration of mercuric or arsenic ions was increased (Fig. 8). Additionally, the absorbance at 730 nm increased and that at 525 nm concomitantly decreased as the concentration of mercuric or arsenic ions in the DPL-AuNP solutions was increased (0.00, 0.20, 0.40, 0.60, 0.80, 1.00, 1.20, 1.40 μM for Hg2+ or As3+). The absorbance ratio for each different concentration of each ion was measured in triplicate. Linear regression analysis of the calibration curve showed good linearity (r2 = 0.9917 for Hg2+, and 0.9937 for As3+) within a linear dynamic range of 0.0–1.4 μM. The limits of detection (LODs) of this probe for Hg2+ and As3+ in tap and pond water samples were found to be 0.5 and 0.7 nM, respectively using [3σ/slope].3.6 Application of the DPL-AuNP probe in the analyses of real samples
To validate the present assay, its colorimetric responses in real tap water, and pond water samples spiked with 1.0, 5.0, and 10.0 μM Hg2+ (and As3+) were analyzed using the DPL-AuNP probe. As shown in Table 1, the analytical results of the proposed probe were nearly identical to the amounts of Hg2+ (or As3+) with which the samples were spiked. Thus, the present AuNP-based probe allows the consecutive dual determination of Hg2+ and As3+ ions at a sensitivity equal to that of established instrumental methods, but is more advantageous in terms of simplicity, cost, and time.| Hg2+ | As3+ | |||||||||||
|---|---|---|---|---|---|---|---|---|---|---|---|---|
| Sample | Added (μM) | Detected (mean ± SDa, μM) | Recovery (%) | RSD (n = 7, %) | DMAb | LOD | Added (μM) | Detected (mean ± SDa, μM) | Recovery (%) | RSD (n = 7, %) | ICP-MSc | LOD |
| a SD, standard deviation.b DMA, direct mercury Analyzer.c ICP-MS, inductively coupled plasma mass spectrometry. | ||||||||||||
| Tap water | 1 | 0.94 ± 0.056 | 94.5 | 7.1 | 0.98 | 0.5 nM | 1 | 0.94 ± 0.063 | 94.6 | 7.2 | 1.03 | 0.7 nM |
| 5 | 4.78 ± 0.01 | 95.6 | 7.3 | 4.86 | 5 | 4.87 ± 0.45 | 97.4 | 7.1 | 4.95 | |||
| 10 | 10.02 ± 0.12 | 100.2 | 7.2 | 10.02 | 10 | 10.11 ± 0.23 | 101.1 | 7.5 | 9.88 | |||
| Pond water | 1 | 0.95 ± 0.055 | 95.5 | 7.2 | 0.97 | 1 | 0.95 ± 0.098 | 95.9 | 7.3 | 0.94 | ||
| 5 | 4.85 ± 0.21 | 97.0 | 7.4 | 5.05 | 5 | 4.75 ± 0.54 | 95.1 | 7.0 | 4.90 | |||
| 10 | 9.87 ± 0.65 | 98.7 | 7.3 | 9.88 | 10 | 10.48 ± 0.56 | 104.8 | 7.5 | 9.87 | |||
| Waste water | 1 | 0.96 ± 0.034 | 96.1 | 7.0 | 0.97 | 1 | 0.94 ± 0.056 | 94.8 | 7.2 | 1.02 | ||
| 5 | 4.88 ± 0.031 | 97.6 | 7.2 | 4.91 | 5 | 4.99 ± 0.01 | 99.8 | 7.0 | 5.03 | |||
| 10 | 10.11 ± 0.05 | 100.1 | 7.4 | 9.97 | 10 | 9.87 ± 0.12 | 98.7 | 7.3 | 9.89 | |||
| River water | 1 | 0.96 ± 0.084 | 96.1 | 7.1 | 1.01 | 1 | 0.98 ± 0.087 | 98.1 | 7.2 | 0.97 | ||
| 5 | 4.90 ± 0.001 | 98.0 | 7.2 | 4.95 | 5 | 5.02 ± 0.047 | 100.4 | 7.1 | 4.99 | |||
| 10 | 9.97 ± 0.05 | 99.7 | 7.0 | 9.96 | 10 | 9.89 ± 0.097 | 99.0 | 7.4 | 9.92 | |||
The results of previously reported instrumental methods and NP assays for the detection of Hg2+ and As3+ ions are compared in Table 2, revealing that the current colorimetric DPL-AuNP probe enables the dual determination of Hg2+ and As3+ ions with excellent sensitivity in aqueous samples.
| Probe | Sensing principles | LODs (Hg2+/As3+) | Ref. |
|---|---|---|---|
| a AgNPs conjugated with 2-aminopyrimidine-4,6-diol.b AgNPs conjugated with methionine.c Ag nanoprisms.d AuNPs conjugated with 3-nitro-1H-1,2,4-triazole.e AuNPs in the presence of o-phenylenediamine.f AuNPs conjugated with a thymine derivative modified with quaternary ammonium salt.g Au nanostars.h Aptamer-Ag@SiO2NPs and thiazole orange buffer solution.i N-doped carbon nanoparticles, CNPs.j AgNPs conjugated with polyethylene glycol.k AgNPs conjugated with aptamer.l AuNPs capped with citrates.m AuNPs conjugated with glutathione-dithiothreitol-cysteine-2,6-pyridinedicarboxylic acid.n CuNPs conjugated with ranolazine.o AuNPs conjugated with dithiothreitol-10,12-pentacosadiynoic acid and AuNPs conjugated with lysine. | |||
| Hg2+ | APD-AgNPsa | 0.35 μM | 14 |
| Met-AgNPsb | 20 nM | 15 | |
| AgNPRsc | 1.5 μM | 16 | |
| NTA-AuNPsd | 7 nM | 17 | |
| OPD-AuNPse | 5.0 nM | 18 | |
| N-T-AuNPsf | 0.8 nM | 19 | |
| AuNSg | 0.24 nM | 20 | |
| Aptamer-Ag@SiO2 NPsh | 0.33 nM | 21 | |
| N-doped CNPsi | 2.3 nM | 22 | |
| As3+ | PEG-AgNPsj | 13.3 nM | 23 |
| Aptamer-AgNPsk | 80.1 nM | 24 | |
| lAuNPs | 133.4 nM | 25 | |
| GSH-DTT-CYs-PDCA-AuNPsm | 33.3 nM | 26 | |
| Rano-CuNPsn | 16 nM | 27 | |
| Hg2+/As3+ | DTT-PCDA-AuNPs & Lys-AuNPso | 10.8 nM/710 nM | 28 |
| DPL–AuNPs | 0.5 nM/0.7 nM | This study | |
4 Conclusions
AuNPs of a specific size (∼20 nm) were prepared via the straightforward citrate reduction of HAuCl4, and DPL-AuNPs were then prepared via a ligand-exchange reaction between DPL and citrate-capped AuNPs. AuNPs conjugated with DPL were developed as a highly sensitive colorimetric dual probe for Hg2+ and As3+ ions. The sensing mechanism of this colorimetric probe involves the aggregation of the DPL-AuNPs in the presence of Hg2+ and As3+ ions. The DPL-AuNPs binding sites for Hg2+ (As3+) ions were elucidated by FTIR spectroscopy, high-resolution XPS, and TOF-SIMs, and both ions were found to be selectively coordinated by the nitrogen and oxygen atoms of the conjugated DPL as a function of the pH. When Hg2+ (As3+) ions coordinate with AuNP-bound DPL, the interparticle distance decreases, which induces aggregation, resulting in a significant color change from wine red to dark midnight blue. Various other ions did not interfere with the determination of Hg2+ or As3+, even at concentrations 100-fold higher than those of Hg2+ or As3+. This dual probe offers simple, highly sensitive, highly selective, and on-site sequential monitoring of Hg2+ and As3+ ions in environmental samples, and allows Hg2+ and As3+ ion concentrations as low as 0.5 and 0.7 nM, respectively to be visually detected within 2 min. Notably, Hg2+ (As3+) ions were found to exhibit significant binding affinity and specificity for the DPL-AuNP structure, providing valuable insights for the molecular design and realization of more efficient metal ion probes in the future.Conflicts of interest
The authors have no conflict of interest in the publication of this manuscript.Acknowledgements
This research was financially supported by the Korea Institute of Science and Technology (2E31283 and 2E31380).References
- M. Gibb and K. G. O'Leary, Environ. Health Perspect., 2014, 122, 667–672 CrossRef PubMed.
- K. M. Rice, E. M. Walker Jr, M. Wu, C. Gillette and E. R. Blough, J. Prev. Med. Public Health, 2014, 47, 74–83 CrossRef PubMed.
- J. D. Park and W. Zheng, J. Prev. Med. Public Health, 2012, 45, 344–352 CrossRef PubMed.
- Y. S. Hong, Y. M. Kim and K. E. Lee, J. Prev. Med. Public Health, 2012, 45, 353–363 CrossRef PubMed.
- https://www.wqa.org/learn-about-water/common-contaminants/mercury, accessed 23 December 2020.
- https://www.epa.gov/sites/production/files/2016-06/documents/npwdr_complete_table.pdf, accessed 23 September 2020.
- R. N. Ratnaike, Postgrad. Med. J., 2003, 79, 391–396 CrossRef CAS PubMed.
- J.-Y. Chung, S.-D. Yu and Y.-S. Hong, J. Prev. Med. Public Health, 2014, 47, 253–257 CrossRef PubMed.
- E. Mohammed, T. Mohammed and A. Mohammed, MethodsX, 2018, 5, 824–833 CrossRef PubMed.
- D. J. Butcher, Appl. Spectrosc. Rev., 2016, 51, 397–416 CrossRef CAS.
- L.-H. Jia, Y. Liu and Y.-Z. Li, J. Pharm. Anal., 2011, 1, 100–103 CrossRef CAS PubMed.
- Y. Fang, Y. Pan, P. Li, M. Xue, F. Pei, W. Yang, N. Ma and Q. Hu, Food Chem., 2016, 213, 609–615 CrossRef CAS PubMed.
- X. Yu, C. Liu, Y. Guo and T. Deng, Molecules, 2019, 24, 926 CrossRef PubMed.
- K. S. Prasad, G. Shruthi and C. Shivamallu, Sensors, 2018, 18, 2698 CrossRef PubMed.
- S. Balasurya, A. Syed, A. M. Thomas, N. Marraiki, A. M. Elgorban, L. L. Raju, A. Das and S. S. Khan, Spectrochim. Acta, Part A, 2020, 228, 117712 CrossRef CAS PubMed.
- F. Tanvir, A. Yaqub, S. Tanvir, R. An and W. A. Anderson, Materials, 2019, 12, 1533 CrossRef CAS PubMed.
- X. Chen, Y. Zu, H. Xie, A. M. Kemas and Z. Gao, Analyst, 2011, 136, 1690–1696 RSC.
- Y.-L. Li, Y.-M. Leng, Y.-J. Zhang, T.-H. Li, Z.-Y. Shen and A. G. Wu, Sens. Actuators, B, 2014, 200, 140–146 CrossRef CAS.
- J. Du, Z. Wang, J. Fan and X. Peng, Sens. Actuators, B, 2015, 212, 481–486 CrossRef CAS.
- D. Xu, S. Yu, Y. Yin, S. Wang, Q. Lin and Z. Yuan, Front. Chem., 2018, 27, 566 CrossRef PubMed.
- Y. Pang, Z. Rong, R. Xiao and S. Wang, Sci. Rep., 2015, 5, 9451 CrossRef PubMed.
- J. Liu, Y. Chen, W. Wang, J. Feng, S. Peng, S. Ma, H. Chen and X. Chen, RSC Adv., 2016, 6, 89916–89924 RSC.
- B. S. Boruah, N. K. Daimari and R. Biswas, Results Phys., 2019, 12, 2061–2065 CrossRef.
- F. Divsar, K. Habibzadeh, S. Shariati and M. Shahriarinour, Anal. Methods, 2015, 7, 4568–4576 RSC.
- L. Gong, B. Du, L. Pan, Q. Liu, K. Yang, W. Wang, H. Zhao, L. Wu and Y. He, Microchim. Acta, 2017, 184, 1185–1190 CrossRef CAS.
- R. Domínguez-González, L. G. Varela and P. Bermejo-Barrera, Talanta, 2014, 118, 262–269 CrossRef PubMed.
- G. N. Laghari, A. Nafady, S. I. Al-Saeedi, S. Sirajuddin, S. T. H. Sherazi, J. Nisar, M. R. Shah, M. I. Abro, M. Arain and S. K. Bhargava, Nanomaterials, 2019, 9, 83 CrossRef PubMed.
- A. Motalebizadeh, H. Bagheri, S. Asiaei, N. Fekrat and A. Afkhami, RSC Adv., 2018, 8, 27091–27100 RSC.
- R. Kanagaraj, Y.-S. Nam, S. J. Pai, S. S. Han and K.-B. Lee, Sens. Actuators, B, 2017, 251, 683–691 CrossRef CAS.
- C. D. De Souza, B. R. Nogueira and M. E. C. M. Rostelato, J. Alloys Compd., 2019, 798, 714–740 CrossRef.
- I. A. Mudunkotuwa, A. A. Minshid and V. H. Grassian, Analyst, 2014, 139, 870–881 RSC.
- R. L. Hudson and P. A. Gerakines, Astrophys. J., 2018, 867, 138 CrossRef CAS.
- J.-J. Max and C. Chapados, J. Phys. Chem. A, 2004, 108, 3324–3337 CrossRef CAS.
- S. A. El-Safty and M. A. Shenashen, Sens. Actuators, B, 2013, 183, 58–70 CrossRef CAS.
- S. A. El-Safty, M. A. Shenashen and A. Shahat, Small, 2013, 9, 2288–2296 CrossRef CAS PubMed.
- H. Gomaa, H. Khalifa, M. M. Selim, M. A. Shenashen, S. Kawada, A. S. Alamoudi, A. M. Azzam, A. A. Alhamid and S. A. El-Safty, ACS Sustainable Chem. Eng., 2017, 5, 10826–10839 CrossRef CAS.
- M. Šetka, R. Calavia, L. Vojkůvka, E. Llobet, J. Drbohlavová and S. Vallejos, Sci. Rep., 2019, 9, 8465 CrossRef PubMed.
- G.-W. Wu, S.-B. He, H.-P. Peng, H.-H. Deng, A.-L. Liu, X.-H. Lin, X.-H. Xia and W. Chen, Anal. Chem., 2014, 86, 10955–10960 CrossRef CAS PubMed.
- H. Viltres, O. F. Odio, L. Lartundo-Rojas and E. Reguera, Appl. Surf. Sci., 2020, 511, 145606 CrossRef CAS.
- Y.-P. Kim, H. K. Shon, S. K. Shin and T. G. Lee, Mass Spectrom. Rev., 2015, 34, 237–247 CrossRef CAS PubMed.
- G. Cervantes, V. Moreno, E. Molins and M. Quiros, Polyhedron, 1998, 17, 3343–3350 CrossRef CAS.
Footnote |
| † These authors contributed equally to this work. |
| This journal is © The Royal Society of Chemistry 2021 |

