 Open Access Article
Influence of zinc oxide nanoparticles on anaerobic digestion of waste activated sludge and microbial communities†
Shutao Wang *a,
Lingbo Chenab,
Hao Yangac and
Zhisheng Liud
aState Key Laboratory of Urban Water Resource and Environment, Harbin Institute of Technology, Harbin 150090, China. E-mail: wshutao@hit.edu.cn
bHunan Research Academy of Environmental Sciences, Changsha 410004, China
cBeijing Academy of Social Science, Beijing 100101, China
dChangchun Institute of Urban Planning and Design, Changchun 130022, China
First published on 29th January 2021
Abstract
The influence of long-term exposure of zinc oxide nanoparticles (ZnO NPs) to waste activated sludge on anaerobic digestion and microbial communities was studied. The exposure concentrations were 0, 30, 60, 90, 120, and 150 mg g−1-volatile suspended solids (VSS) (dry). ZnO NPs inhibit the degradation of macromolecular organic matter and the reduction of VSS in waste activated sludge during anaerobic digestion. Only slight effects on the activities of protease, cellulase, acetated kinase, and coenzyme F420 were found at ZnO-NP concentrations of less than 30 mg g−1-VSS, whereas the activities of these three enzymes were adversely affected in a dose-dependent manner when the ZnO NP concentrations were increased from 30 mg g−1-VSS to 150 mg g−1-VSS. High-throughput sequencing analysis revealed that ZnO NPs had an adverse influence on the archaeal community diversity but increased the bacterial community diversity to some extent. High-throughput sequencing analysis also revealed that ZnO NPs resulted in different shift trends in the archaeal and bacteria community structure at phylum, class, and genus levels. ZnO NPs have negative impacts on the Euryarchaeota community, which plays a significant role as methanogens in the anaerobic digestion. In addition, ZnO NPs could increase the relative abundance of Clostridia and Bacteroidia, playing an important role in hydrolysis during the anaerobic digestion.
1 Introduction
Many types of nanomaterials have been used in many fields. Nanoparticles (NPs) are released into the environment as waste after their application and treatment. Many reports have proved that NPs are more toxic than larger particles of the same composition because of their large specific surface area and unique size effects.1–4 In recent years, several ecotoxicological studies have been carried out on the toxicity of NPs on bacteria, cells, algae, and mammals.5,6 For example, both Daphnia magna and Pimephales promelas were found to be sensitive to silver nanoparticles (Ag NPs).7 The photosynthetic production of Chlamydomonas reinhardtii obviously reduced after its exposure to copper nanoparticles (Cu NPs).8 The toxicity of zinc oxide nanoparticles (ZnO NPs) on the environment has received more attention than that of other nanomaterials owing to their widespread applications. ZnO nanomaterials have been employed in many applications, such as optoelectronics, cosmetics, catalysts, ceramics and pigments due to their unique properties.9 It was proved that ZnO NPs could induce a significant growth inhibition in Methanocorpusculaceae.10 ZnO NPs also show obvious toxicity in activated sludge, compared with other NPs11 even at low concentration.Wastewater treatment plants (WWTPs) are one of the most important pathways for NP transformation and migration in the environment. Thus, the fate, transformation, and effects of NPs in biological wastewater treatment and excess sludge treatment are subjects of concern. It was reported that the zinc content in WWTP biosolids reached 8.55 × 10³ mg kg−1-suspended solids (SS).11 It was also proved that ZnO NPs could significantly affect the settleability of activated sludge and removal efficiency of nitrogen and phosphorus over time. The diversity of the microbial community in the activated sludge also became less after exposure to ZnO NPs.12
The inhibiting effect of NPs on biological wastewater treatment processes has been reported;13–15 although, there are still knowledge gaps concerning their effect on anaerobic digestion to produce biogas. Biogas production during anaerobic digestion involves a complex multi-step processes, including substrate hydrolysis, fermentation, and methanogenesis, catalyzed by diverse and special microorganisms.16 NPs can enter the sewers and WWTPs through daily washing from nanomaterials-containing plastics and textiles. Most of the NPs, including ZnO NPs, released from WWTPs get accumulated in activated sludge via adsorption and aggregation.17,18 Before being discharged into the environment, the excess activated sludge produced in WWTPs must be treated. Generally, anaerobic digestion is the preferred process because excess activated sludge gets reused and its energy gets recovered. As known, several biological reactions occur during anaerobic sludge digestion, including the following: (a) hydrolysis, where large organic molecules are decomposed into simple molecules, such as sugars, amino acids, and fatty acids; (b) acidogenesis, where these compounds are further decomposed into simple organic acids, ammonia, carbon dioxide, hydrogen, and other byproducts; (c) acetogenesis, where CO2, H2, and organic acids from acidogenesis are transformed into acetic acid; and (d) methanogenesis that includes hydrogenotrophic methanogenesis and acetoclastic methanogenesis, resulting in methane production.19,20
The adverse impacts of NPs on anaerobic digestion process should be investigated deeply because of the possible toxicity of NPs on microbial communities. It has been reported that heavy metals (Cr, Cu, Cd and Zn) decrease the anaerobic microbial activity in digestion processes.21,22 Metallic NPs can show different toxicological behaviors compared to those exhibited by bulk metal species. ZnO NPs inhibited methane production by 18.3% and 75.1%, respectively, at 30 and 150 mg ZnO per g-SS (suspended solid).13 The inhibition rate of anaerobic digestion increased from 5.8% to 84.0% when CuO NPs concentration increased from 5 mg g−1-SS to 1000 mg g−1-SS, while Ag and CeO2 NPs did not cause drastic impacts.23 In addition, Ag and TiO2 exhibited no effect on methanogenic activity at 1 and 10 mg L−1. These NPs did not seem to affect methane production in short-term exposure during the mesophilic anaerobic digestion of primary sludge.24 In another study, it was also found that only ZnO NPs showed an adverse effect on methane generation among Al2O3, TiO2, ZnO and SiO2 NPs; the influence of ZnO NPs was even dosage-dependent.25 Lower concentration of ZnO NPs (6 mg g−1 SS) had no adverse effect on methane generation. However, methane decreased by 22.8% and 81.1% with increasing the concentration of ZnO NPs to 30 and 150 mg g−1 SS, respectively.25
As mentioned above, although some investigations have been conducted on the effect of NPs on anaerobic digestion processes such as acidogenesis, acetogenesis, and methanogenesis, little is known about the effect of NPs on microbial communities including microbial abundance and community structure under at most 22 d long-term exposure conditions. In the present investigation, a simulated anaerobic digestion reactor was established to investigate the influence of ZnO NPs on anaerobic digestion, and high-throughput sequencing was applied to characterize the microbiological community after long-term exposure. Additionally, the activities of some enzymes related to waste sludge anaerobic digestion were also measured to probe the potential influence of ZnO NPs on the system.
2 Materials and methods
2.1 Nanoparticle suspension and waste activated sludge
The ZnO NP suspension (1.7 g L−1, <100 nm particle size) was purchased from Sigma-Aldrich (St Louis, MO, USA). Before use, the ZnO NP suspension was prepared by dispersing 1 mL of ZnO NPs (1.7 g L−1) in 1 L of deionized water, followed by 1 h of sonication (25 °C, 250 W, 40 kHz). Dynamic light scattering (DLS) analysis using a Malvern Autosizer (4700, Malvern Instruments, UK) indicated that the average particle size in the stock suspension was in the range of 30 to 60 nm. Transmission electron microscopy (TEM) and scanning electron microscopy (SEM) indicated that the ZnO NPs were spherical.The waste activated sludge used in this study was taken from the secondary sedimentation tank of an actual municipal wastewater treatment plant in Harbin, China. The sludge was settled for 24 h for concentration and stored at 4 °C. The sludge was pretreated using an alkaline method for enhancing the hydrolysis. The sludge was stirred at 80 rpm for 6 h after the pH was adjusted to 12 with NaOH solution. At last, the pH was adjusted back to neutral for anaerobic digestion. The characteristics of raw sludge and alkaline-pretreated sludge are showed in Table S1 (ESI†).
2.2 ZnO NP exposure to sludge
The anaerobic digestion reactor was inoculated with the actual activated sludge. The reactor (8 L working volume) was made of plexiglass and heated with water-bath mezzanine. One control and six test concentrations (2, 30, 60, 90, 120, and 150 mg g−1-dry VSS) of ZnO NPs were examined during the exposure experiments. Generally, the concentrations of various types of NPs in the actual mixture of waste activated sludge were less than 50 mg L−1.26 As the environmental release of NPs might increase with large-scale manufacturing, the potential effect of higher ZnO NP concentrations was also investigated. Nearly all the research was set up in triplicate to ensure reliable results. After the addition of ZnO NPs, the change trends in all indices during each operating cycle and long-term period were all measured. The schematic diagram of the reactor used for exposure is shown in Fig. S1 (ESI†).2.3 Analytical methods
The ZnO concentration was analyzed by inductively coupled plasma-optical emission spectrometry (ICP-OES) (PerkinElmer Optima 2100 DV, USA). To measure the zinc content in sludge, the samples were digested according to EPA Method 200.2 prior to ICP analyses. The total chemical oxygen demand (TCOD) and soluble chemical oxygen demand (SCOD) were determined according to the standard potassium dichromate method. The volatile fatty acid (VFA) content was analyzed by GC (Agilent 6890N, USA) with a flame ionization detector (FID) using nitrogen as a carrier.
![[thin space (1/6-em)]](https://www.rsc.org/images/entities/char_2009.gif) 000g, 4 °C, and 0.5 h). The extracts were kept on ice before being used for the enzyme activity assay. The protease and cellulose activity was determined according to Karadzic et al.27 and Van Soest,28 respectively. The acetate kinase and coenzyme F420 activity were analyzed according to Van Niel et al.29 and Mu et al.,14 respectively. The specific enzyme activity was defined as a unit of enzyme activity per milligram of dry VSS.
000g, 4 °C, and 0.5 h). The extracts were kept on ice before being used for the enzyme activity assay. The protease and cellulose activity was determined according to Karadzic et al.27 and Van Soest,28 respectively. The acetate kinase and coenzyme F420 activity were analyzed according to Van Niel et al.29 and Mu et al.,14 respectively. The specific enzyme activity was defined as a unit of enzyme activity per milligram of dry VSS.![[thin space (1/6-em)]](https://www.rsc.org/images/entities/char_2009.gif) 000g, 6–10 °C, and 10 min), and the precipitate was re-suspended in 30 mL of the liquid. This process was repeated twice. The pretreated activated sludge was dissolved in 15 mL of Tris EDTA (TE) buffer solution. Bulk genomic DNA was extracted using sodium dodecyl sulfate (SDS) and hexadecyltrimethyl ammonium bromide (CTAB). The products were examined by agarose (1% w/v) gel electrophoresis in Tris/borate/EDTA buffer (TBE). The total genomic DNA from the microbial samples was first extracted and purified using a PowerSoil DNA Isolation Kit (MoBio Laboratories, Inc., Carlsbad, CA) according to the manufacturer's protocol, confirmed using 1% agarose gel electrophoresis and stored at −20 °C until use. The 16S rRNA genes were amplified with barcoded primers.
000g, 6–10 °C, and 10 min), and the precipitate was re-suspended in 30 mL of the liquid. This process was repeated twice. The pretreated activated sludge was dissolved in 15 mL of Tris EDTA (TE) buffer solution. Bulk genomic DNA was extracted using sodium dodecyl sulfate (SDS) and hexadecyltrimethyl ammonium bromide (CTAB). The products were examined by agarose (1% w/v) gel electrophoresis in Tris/borate/EDTA buffer (TBE). The total genomic DNA from the microbial samples was first extracted and purified using a PowerSoil DNA Isolation Kit (MoBio Laboratories, Inc., Carlsbad, CA) according to the manufacturer's protocol, confirmed using 1% agarose gel electrophoresis and stored at −20 °C until use. The 16S rRNA genes were amplified with barcoded primers.For archaeal:
(1) First PCR primers: 340F: CCCTAYGGGGYGCASCAG; 1000R: GGCCATGCACYWCYTCTC;
It was operated as the following steps: 10× PCR buffer: 5 μL; dNTP (10 mM each): 0.5 μL; genomic DNA: 10 ng; Bar-PCR primer F (50 μM): 0.5 μL; Primer R (50 μM) 0.5 μL; Plantium Taq (5 U μL−1): 0.5 μL; H2O: add to 50 μL. Initial denaturation at 94 °C for 3 min, 5 cycles of 94 °C for 30 s, 45 °C for 30 s, 65 °C for 30 s; 20 cycles of 94 °C for 20 s, 55 °C for 20 s, 65 °C for 30 s followed by a final extension at 72 °C for 30 s and 10 °C until halted.
(2) Second PCR primers: 349F: CCCTACACGACGCTCTTCCGATCTN (barcode) GYGCASCAGKCGMGAAW; 806R: GACTGGAGTTCCTTGGCACCCGAGAATTCCAGGACTACVSGGGTATCTAAT;
It was operated as the following steps: 10× PCR buffer: 5 μL; dNTP (10 mM each): 0.5 μL; genomic DNA: 10 ng; Bar-PCR primer F (50 μM): 0.5 μL; Primer R (50 μM) 0.5 μL; Plantium Taq (5 U μL−1): 0.5 μL; H2O: add to 50 μL. Initial denaturation at 94 °C for 3 min, 5 cycles of 94 °C for 30 s, 45 °C for 30 s, 65 °C for 30 s; 20 cycles of 94 °C for 20 s, 55 °C for 20 s, 72 °C for 30 s followed by a final extension at 72 °C for 5 min and 10 °C until halted.
(3) Third PCR primers: illumina bridge PCR primers.
It was operated as the following steps: 10× PCR buffer: 5 μL; dNTP (10 mM each): 0.5 μL; DNA: 20 ng; Primer F (50 μM) 0.5 μL; Primer R (50 μM) 0.5 μL; Plantium Taq (5 U μL−1): 0.5 μL; H2O: add to 50 μL. Initial denaturation at 95 °C for 3 min, 5 cycles of 95 °C for 15 s, 55 °C for 15 s, 72 °C for 30 s followed by a final extension at 72 °C for 5 min and 10 °C until halted.
For bacteria:
(1) First PCR primers: 341F: CCCTACACGACGCTCTTCCGATCTG (barcode) CCTACGGGNGGCWGCAG 805R: GACTGGAGTTCCTTGGCACCCGAGAATTCCAGACTACHVGGGTATCTAATCC;
It was operated as the following steps: 10× PCR buffer: 5 μL; dNTP (10 mM each): 0.5 μL; genomic DNA: 10 ng; Bar-PCR primer F (50 μM): 0.5 μL; Primer R (50 μM) 0.5 μL; Plantium Taq (5 U μL−1): 0.5 μL; H2O: add to 50 μL. Initial denaturation at 94 °C for 3 min, 5 cycles of 94 °C for 30 s, 45 °C for 20 s, 65 °C for 30 s, 20 cycles of 94 °C for 20 s, 55 °C for 20 s, 72 °C for 30 s followed by a final extension at 72 °C for 5 min and 10 °C until halted.
(2) Second PCR primers: illumina bridge PCR primers.
It was operated as the following steps: 10× PCR buffer: 5 μL; dNTP (10 mM each): 0.5 μL; DNA: 20 ng; primer F (50 μM): 0.5 μL; Primer R (50 μM): 0.5 μL; Plantium Taq (5 U μL−1): 0.5 μL; H2O: add to 50 μL. Denaturation at 95 °C for 30 s, 5 cycles of 95 °C for 15 s, 55 °C for 15 s, 72 °C for 30 s, followed by a final extension at 72 °C for 5 min and 10 °C until halted.
The PCR products were visualized on an agarose gel and mixed proportionally according to mass, prior to sequencing on an Illumina MiSeq benchtop sequencer using pair-end 250 bp kits in Shanghai (Majorbio), China.
The raw sequences were optimized, and low-quality sequences were removed using Mothur (http://www.mothur.org). Mothur was used to trim the barcode and primer sequences, and eliminate sequences shorter than 200 bp, with one or more ambiguous bases with a quality score inferior to 25. Sequences were clustered into operational taxonomic units (OTUs) at 97% sequence similarity using Mothur. Species richness, diversity indices (i.e. observed OTUs), Chao1 estimator, Shannon index, Simpson index, abundance-based coverage estimator (ACE), and rarefaction curves were obtained using Mothur, at a 3% dissimilarity cutoff. To compare the community diversity between samples based on phylogenetic information, the Fast UniFrac online tool (http://unifrac.colorado.edu/) was used. It was used to estimate the weighted UniFrac metric and carry out principal coordinate analysis (PcoA). Moreover, a heatmap was implemented using the R packages heatmap (http://www.r-project.org/). The 16S rRNA gene sequences were deposited in the NCBI Sequence Read Archive under their accession number.
2.4 Statistical analysis
All the tests were performed in triplicate and the results were expressed as the mean ± standard deviation. Analysis of variance (ANOVA) was used to examine the significance of the results; p < 0.05 was considered to be statistically significant. A principal component analysis (PCA) was conducted based on the weighted UniFrac distance using SPSS 16.0 (SPSS Inc., Chicago, USA). Heatmaps and VENN diagrams were plotted by hierarchal clustering.3 Results and discussion
3.1 Effects of ZnO NPs on methane production and reduction of waste activated sludge
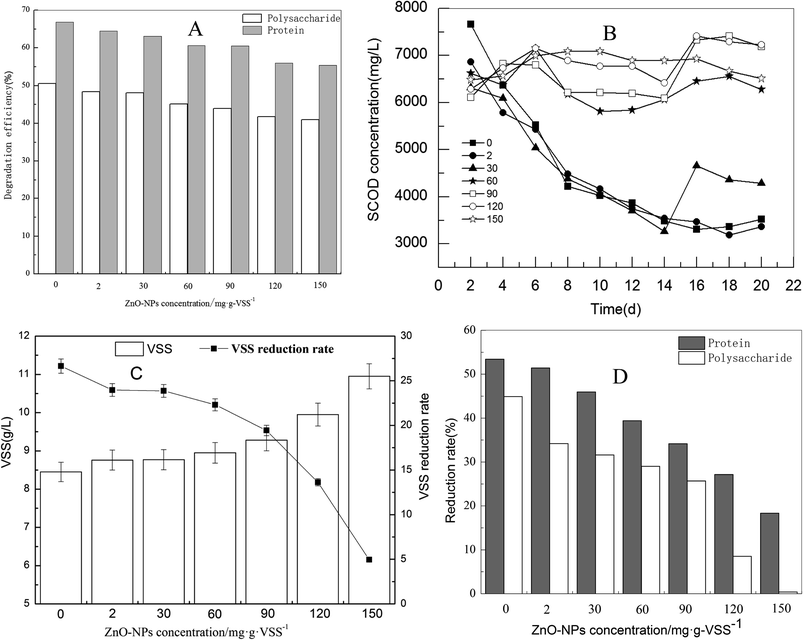
The digestion process primarily occurs via the degradation of macromolecular organics. Soluble protein and polysaccharide dominate macromolecular organic matter, accounting for more than 60% of the total organics of sludge.29 To some extent, the degradation of protein and polysaccharide represents the degradation efficiency of organic matters in waste activated sludge. As shown in Fig. 1(A), with the addition of ZnO NPs to the sludge fermentation system, the adverse effect could be observed in the degradation of both polysaccharide and protein in the supernatant; the effect was relevant to the dosage. At a lower ZnO NP dosage (2 mg g−1-VSS), only a slight inhibition effect occurred. However, when the ZnO NP concentration increased to 150 mg g−1-VSS, the concentrations of soluble protein, polysaccharide, and SCOD increased from 138.5 mg L−1 to 175.0 mg L−1, 909.9 to 1224.3 mg L−1, and 4331.6 to 4841.2 mg L−1, respectively. The degradation rate of protein and polysaccharides decreased by 14.4% and 11.4%, respectively, indicating that ZnO NPs inhibit the degradation of macromolecular organic matter in waste activated sludge during anaerobic digestion.Only a portion of the organic matter were degraded during anaerobic digestion owing to the limitation of fermentation time. Commonly, the degradation efficiency of organic matter, as well as reduction of waste activated sludge are used to assess the performance of the anaerobic digestion.30 As shown in Fig. 1(B), with the increase of ZnO NP concentrations from 2 to 30 mg g−1-VSS, the removal rate of SCOD was nearly unaffected compared to the control during the 22 d exposure. However, it significantly decreased when the ZnO NP concentrations increased from 30 to 150 mg g−1-VSS. Similarly, when the ZnO NP concentration was higher than 60 mg g−1-VSS, the reduction rate dropped quickly and only 5% of the VSS reduction rate was achieved in the fermentation system at 150 mg g−1-VSS concentration of the ZnO NPs (Fig. 1(C)). In addition, as shown in Fig. 1(D), the reduction rate of protein and polysaccharides in waste activated sludge was inhibited in a dose-dependent manner. The reduction rate of protein and saccharides decreased from 53% and 44.3% to 17.9% and 0.8%, respectively, at the ZnO NP concentration of 150 mg mg−1-VSS compared to the control. By comparison, the influence trend of the ZnO NPs was consistent in the degradation of polysaccharides and protein (in the supernatant of the waste activated sludge), SCOD removal, and reduction of the waste activated sludge.
3.2 Effects of ZnO NPs on enzyme activities during anaerobic digestion
Many enzymes are believed to play an important role in methane production during the anaerobic digestion of waste activated sludge. For example, protease, cellulase, acetate kinase, and coenzyme F420 are responsible for sludge hydrolysis, acidification, and methanation during anaerobic digestion.31 As shown in Fig. 2, only a slight effect on the activities of protease, cellulase, and acetated kinase was found at concentrations less than 30 mg g−1-VSS of ZnO NPs. With the increase in ZnO NP concentrations from 30 mg g−1-VSS to 150 mg g−1-VSS, however, the activities of these three enzymes were reduced in a dose-dependent manner. For coenzyme F420, the dosage of 30 mg mg−1-VSS of ZnO NPs could inhibit its activity, i.e., the activity was 76.7%, 68.9%, 48.8%, and 44.4% of the control at concentrations of 60, 90, 120, and 150 mg mg−1-VSS, respectively. Similarly, Mu et al. (2011) found that concentrations of 30 and 150 mg g−1 SS of ZnO NPs could significantly affect the coenzyme F420 activity,14 consistent with the findings in the present study.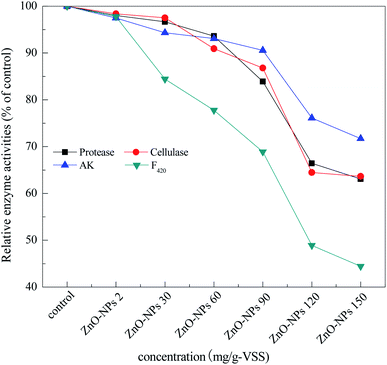 | ||
| Fig. 2 Relative activity of protease, cellulase, acetate kinase, and coenzyme F420 after 20 d exposure. | ||
3.3 Effects of ZnO NPs on the microbial community
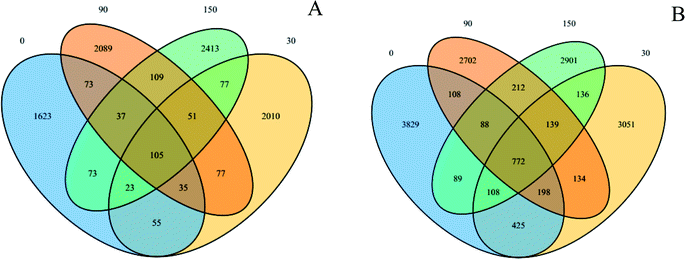
These sequence reads were clustered into OTUs according to similarity (the sequences that have 97% similarity were defined as one OTU). The VENN diagrams (Fig. 3) show the OTU numbers of the different samples. The OTU numbers of 0, 30, 90, and 150 exposures were 2024, 2433, 2576, and 2888, respectively, for the archaeal community. Similarly, the OTU numbers of 0, 30, 90, and 150 were 5617, 4963, 4353, and 4445, respectively, for the bacterial community. The total OTU numbers were 8645 and 14892 for the archaeal and bacterial communities, respectively. In addition, their mutual numbers were 105 and 772 OTUs, respectively, accounting for 1.21% of the total archaeal and 5.18% of the total bacterial community. The abundance order for unclassified abundances was Methanolinea > Methanosaeta > Methanospirillum > sum for the archaeal community and Levilinea > Longilinea > Proteiniclasticum > sum for the bacterial community.
The alpha diversity indices reflect the microbial community diversity of the anaerobic activated sludge. The alpha diversity indices cover the richness, Shannon Index, ACE index, Chao1 index, Coverage, and Simpson index values. Table 1 shows the alpha diversity statistics for the five samples. The OTU numbers and species richness of the samples were positively correlated. Shannon and Simpson indices were used to estimate the microbial diversity in the activated sludge systems; the higher the Shannon index, the higher the diversity of the microbial community. In contrast, a lower Simpson index represents a higher diversity in the community. In addition, according to high-throughput sequencing analysis, the richness rarefaction was plotted to indicate the species abundance in the activated sludge (Fig. S2, in ESI†). As Fig. S2† and Table 1 show, the bacterial community diversities were P0, P30, P90, and P150 in descending order and the archaeal community diversities were 150, 90, 30, and 0 in descending order. For the archaeal community, the Simpson index of P0 was lower than that of the others, indicating that the addition of ZnO NPs had an adverse influence on the archaeal community diversity. On the contrary, for the bacterial community, the Simpson index of P0 was higher than the others, indicating the addition of ZnO NPs increased the diversity of the community.
| Sample (mg L−1) | Sequence number | OTUs | Shannon | ACE | Chao1 | Coverage | Simpson | |
|---|---|---|---|---|---|---|---|---|
| a Note: 0, 30, 90, and 150 represents 0, 30, 90, and 150 mg g−1-VSS ZnO NP exposures, respectively. | ||||||||
| Archaeal | 0 | 57145 | 2024 | 2.608975 | 38![[thin space (1/6-em)]](https://www.rsc.org/images/entities/char_2009.gif) 696.55 696.55 |
15![[thin space (1/6-em)]](https://www.rsc.org/images/entities/char_2009.gif) 904.09 904.09 |
0.969551 | 0.174093 |
| 30 | 64328 | 2433 | 2.426189 | 59![[thin space (1/6-em)]](https://www.rsc.org/images/entities/char_2009.gif) 280.97 280.97 |
20![[thin space (1/6-em)]](https://www.rsc.org/images/entities/char_2009.gif) 351.29 351.29 |
0.967091 | 0.197155 | |
| 90 | 71046 | 2576 | 2.675787 | 56![[thin space (1/6-em)]](https://www.rsc.org/images/entities/char_2009.gif) 696.15 696.15 |
19![[thin space (1/6-em)]](https://www.rsc.org/images/entities/char_2009.gif) 511.67 511.67 |
0.968907 | 0.180479 | |
| 150 | 75902 | 2888 | 2.702693 | 85![[thin space (1/6-em)]](https://www.rsc.org/images/entities/char_2009.gif) 036.21 036.21 |
25![[thin space (1/6-em)]](https://www.rsc.org/images/entities/char_2009.gif) 474.98 474.98 |
0.966391 | 0.18199 | |
| Bacterial | 0 | 55268 | 5617 | 5.904354 | 53![[thin space (1/6-em)]](https://www.rsc.org/images/entities/char_2009.gif) 934.24 934.24 |
26![[thin space (1/6-em)]](https://www.rsc.org/images/entities/char_2009.gif) 153 153 |
0.926196 | 0.015821 |
| 30 | 58382 | 4963 | 5.939201 | 37![[thin space (1/6-em)]](https://www.rsc.org/images/entities/char_2009.gif) 190.59 190.59 |
20![[thin space (1/6-em)]](https://www.rsc.org/images/entities/char_2009.gif) 664.9 664.9 |
0.941763 | 0.011705 | |
| 90 | 50929 | 4353 | 5.720234 | 36![[thin space (1/6-em)]](https://www.rsc.org/images/entities/char_2009.gif) 585.42 585.42 |
19![[thin space (1/6-em)]](https://www.rsc.org/images/entities/char_2009.gif) 891.13 891.13 |
0.939838 | 0.014924 | |
| 150 | 52849 | 4445 | 5.57788 | 42![[thin space (1/6-em)]](https://www.rsc.org/images/entities/char_2009.gif) 323.01 323.01 |
20![[thin space (1/6-em)]](https://www.rsc.org/images/entities/char_2009.gif) 421.16 421.16 |
0.939015 | 0.015239 | |
According to the sequencing results, the species were classified and the flora abundance distribution was obtained. Based on the abundance matrix, an abundance heatmap was plotted, representing the abundance of flora information. As shown in Fig. S3,† the color blocks represent the distance values. Additionally, the left (and top) connecting lines of the heatmap are the clustering tree of the five samples. The more similar the microbial communities are in these samples, the smaller the distance in the cluster tree between samples. For the archaeal community (Fig. S3A†), there are two community branches, 0 and B. Branch B contains 90 and a sub-branch C (30 and 150). Evidently, the 0 branch is very different from the B branches (B30, B90, and B150). For the bacterial community (Fig. S3B†) as well, there were two community branches; one contains 0 and 30 and the other contains 90 and 150. Theoretically, a smaller distance represents the similarity of flora distribution in the Bray tree plot. It means that there was an obvious similarity in flora distribution between 0 and 30 as well as between 90 and 150.
The analysis above suggests that the changes in the flora distributions occurred when the digestion sludge was exposed to ZnO NPs at concentrations of 30, 90, and 150 mg g−1-VSS compared to the control. The 30 mg L−1 ZnO NPs caused a slight change in the flora distribution, whereas the 90 and 150 mg g−1-VSS ZnO NPs caused an obvious change. For the archaeal community, only a slight difference was found between 0 and 30, whereas there was an obvious difference for the 90 and 150 values compared to the 0 value. For the bacterial community, 0 was homologous to 30, and 90 was homologous to 150. Clostridiales, Anaerolineales, and Bacteroidales dominated the mixture system.
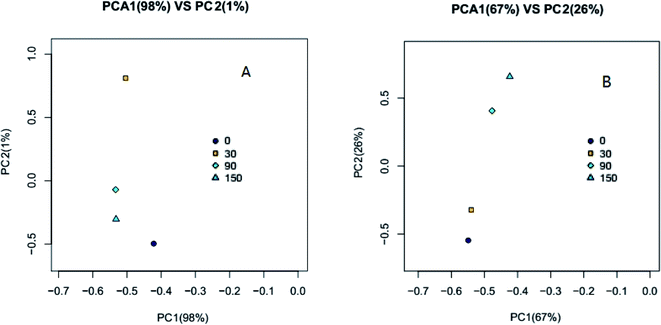
A principal component analysis (PCA) correlation matrix was used to explore the difference in community structures between the samples. Planar scatter plots of archaeal and bacterial communities are shown in Fig. 4(A) and (B), respectively. The first principal component (PC1) explained 98% of the variation for the archaeal community and the second principal component (PC2) accounted for 1% of the variation (Fig. 4(A)). PC1 explained 67% of the variation for the bacterial community and the PC2 accounted for 26% of the variation (Fig. 4(B)). The clustering of points in the planar scatter plots represent the similarity of archaeal and bacterial communities; the more collective their nature, the higher the similarity. From Fig. 4(A), it can be seen that the points 30, 90 and 150 are much more collective than the point 0, indicating the microbial community structure of 30, 90 and 150 mg kg−1 VSS ZnO NPs exposure were much different compared with that of control (0). From Fig. 4(B) it can be seen that the point 0 and 30 were collective and the point 90 and 150 were collective, indicating the microbial community of the former two was similar, but different from the latter two, which were also similar. Thus, it could be concluded that ZnO NPs accumulated in the anaerobic digestion system and affected the microbial community structure.
3.3.2.1 Effects of ZnO NPs on archaeal community structure. The results of high-throughput sequencing are shown in Table 2 that represent the distribution of archaeal communities at phylum, class, and genus levels, respectively.
| Level | Name | Percentage (%) | |||
|---|---|---|---|---|---|
| 0 | 30 | 90 | 150 | ||
| a Notice: concentration unit of ZnO NPs: mg kg−1 VSS. | |||||
| Phylum name | Euryarchaeota | 97.74 | 93.52 | 91.59 | 89.58 |
| Crenarchaeota | 2.09 | 6.31 | 8.24 | 10.33 | |
| Thaumarchaeota | 0.06 | 0.08 | 0.10 | 0.02 | |
| Unclassified | 0.11 | 0.08 | 0.07 | 0.06 | |
| Class name | Methanomicrobia | 90.16 | 80.36 | 78.04 | 76.64 |
| Thermoprotei | 2.09 | 6.31 | 8.24 | 10.33 | |
| Methanobacteria | 6.07 | 6.42 | 8.13 | 5.71 | |
| Thermoplasmata | 1.11 | 6.24 | 5.13 | 6.31 | |
| Unclassified | 0.55 | 0.64 | 0.43 | 0.99 | |
| Genus name | Methanosaeta | 67.64 | 68.86 | 58.87 | 61.20 |
| Methanolinea | 9.00 | 7.35 | 14.37 | 8.95 | |
| Unclassified | 2.64 | 6.82 | 8.64 | 11.34 | |
| Methanospirillum | 11.82 | 4.05 | 3.03 | 4.51 | |
| Methanosphaera | 5.39 | 6.23 | 6.43 | 4.62 | |
| Thermogymnomonas | 1.10 | 1.80 | 5.12 | 6.30 | |
| Methanobacterium | 0.55 | 0.35 | 1.17 | 0.99 | |
| Methanoregula | 0.60 | 0.16 | 0.62 | 1.06 | |
| Methanomethylovorans | 0.50 | 0.56 | 0.29 | 0.52 | |
As Table 2 shows, high-throughput sequencing analysis on the cDNA sequences of the 16S rRNA genes revealed that one common phylum, Euryarchaeota, was retrieved from all four anaerobic digestion systems. The distribution of the dominant archaea differs significantly between the samples. With the increase of concentrations of ZnO NPs, the proportion of Euryarchaeota in the sample is reduced. Euryarchaeota was the much important archaeal community in the anaerobic digestion system. The proportion of Euryarchaeota was 97.74% in the control test but it decreased to 93.52%, 91.59%, and 89.58% in the system containing 30, 90, and 150 mg g−1-VSS ZnO NPs, respectively, suggesting that ZnO NPs negatively impact the Euryarchaeota community.
As shown in Table 2, in the most abundant phylum, Euryarchaeota and Methanomicrobia were the predominant flora, accounting for >90% in the control. Methanomicrobia, Methanobacteria, and Thermoplasmata are very common in the anaerobic digestion system. When the ZnO NP concentration increased from 0 to 30, 90, and 150 mg g−1-VSS, the proportion of Methanomicrobia decreased by 9.80%, 13.44%, and 21.65%, respectively. In contrast, the proportion of both Thermoprotei and Methanomicrobia increased significantly. This indicates that ZnO NPs can inhibit the activity of Methanomicrobia.
Methanosaeta is a strict acetic acid type methanogen. As shown in Table 2, Methanosaeta is the predominant genus. At 30, 90, and 150 mg g−1-VSS of ZnO NPs, the proportions of Methanosaeta were 68.86%, 58.87%, and 61.2%, respectively, demonstrating that a slight adverse influence occurred with the addition of ZnO NPs. This shows that acetic acid type methanogens responded to external stimuli. Differently, Methanospirillum is a hydrogenotrophic methanogen. With the addition of ZnO NPs, the proportion of Methanospirillum was reduced significantly compared to the control. Thus, ZnO NPs can significantly inhibit the activity of hydrogenotrophic methanogen. In addition, Methanolinea, Methanosphaera, and Methanobacterium are all hydrogenotrophic methanogen; some uncertain effects occurred when they were exposed to ZnO NPs at different concentrations.
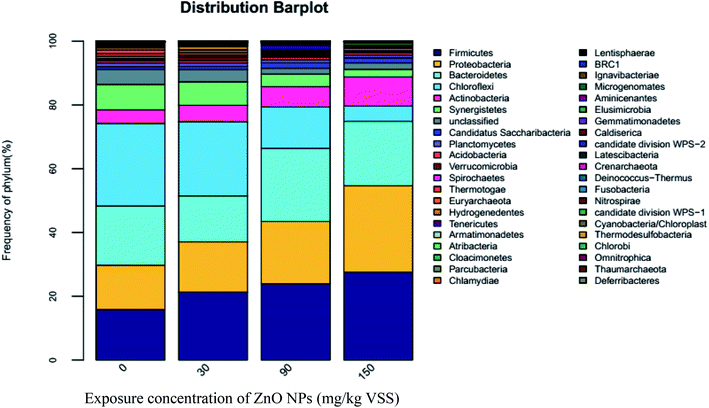
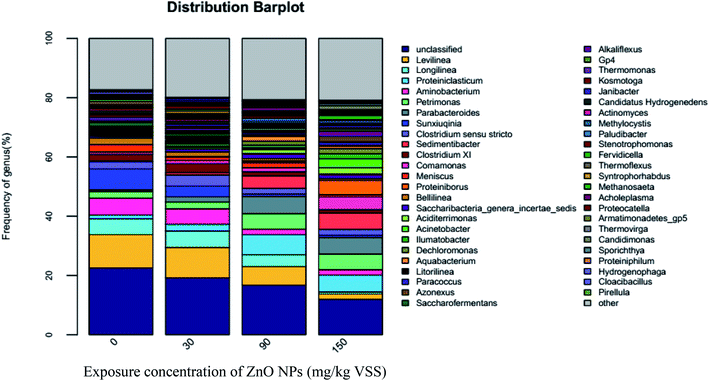
3.3.2.2 Effect of ZnO NPs on bacterial community structure. The results of high-throughput sequencing are shown in Fig. 5–7, demonstrating the bacterial community distribution at the phylum, class, and genus levels. The most common bacterial phyla, Firmicutes, Proteobacteria, Bacteroidetes, Spirochaetes, and Chloroflexi play important roles during anaerobic digestion. Similar to archaeal communities, the first four phyla are major bacterial communities in the present experimental system, accounting for 74–80% of the total sequences shown in Fig. 5. Firmicutes contain many important functional bacteria existing widely in anaerobic digestion systems. Proteobacteria are the predominant bacteria in the activated sludge and plays an important role in anaerobic digestion. Many species of Proteobacteria are related to the metabolism of small molecular compounds including glucose. The percentage of Firmicutes and Proteobacteria increases with the increase of ZnO NP concentrations (Fig. 5), i.e., the proportions of Firmicutes and Proteobacteria increased by 36.66% and 13.35%, 51.04% and 40.77%, and 74.38% and 44.87% at 30, 90, and 150 mg g−1-VSS of ZnO NPs, respectively. As one type of chemoheterotrophic bacterium, Bacteroidetes can hydrolyze vitamin and chitin. As seen in Fig. 5, 30 mg g−1-VSS ZnO NPs decreased the abundance of Bacteroidetes, whereas the proportion of Bacteroidetes increased at 60 and 150 mg g−1-VSS of ZnO NPs, similar to that of Firmicutes and Proteobacteria. The activity increase of Firmicutes, Proteobacteria, and Bacteroidetes may have resulted from their adaptability and resistance to ZnO NPs.
Both Spirochaetes and Actinobacteria are also widely spread in activated sludge and play important roles in the degradation of organic matters.32 Actinobacteria are heterotrophic bacteria, of which most strains produce H2S in a culture and can deoxidize nitrate into nitrite. As seen in Fig. 5, compared with the control (4.28%), the percentage of Actinobacteria increased to 5.17%, 6.4%, and 9.13% at ZnO NP concentrations of 30, 90, and 150 mg g−1-VSS, respectively. Accordingly, ZnO NPs can enhance the relative abundance of these two bacteria classes to some extent. In addition, according to Fig. 5, the percentage of Spirochaetes was very low, indicating the relative abundance was weak.
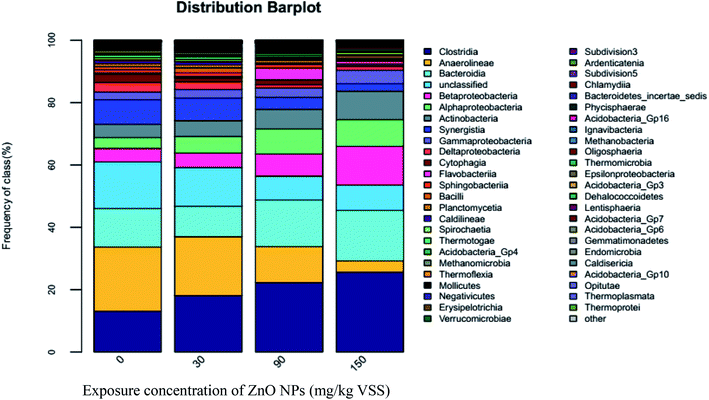
As shown in Fig. 6, high-throughput sequencing analyses on the cDNA sequences of the 16S rRNA genes showed three dominant classes, Clostridia, Anaerolineae, and Bacteroidia, accounting for almost 46% of the community. Clostridia are an important functional class under Firmicutes and play an important role in promoting hydrolysis.33 As ZnO NP concentrations improved from 0 mg g−1-VSS to 30, 90, and 150 mg g−1-VSS, the proportion of Clostridia increased from 13.11% to 18.13%, 22.3%, and 25.66%, respectively. As known, hydrolytic acidification is a very combined process, which many kinds of microbial participate. The whole inhibition (Fig. 1(D)) of hydrolytic process might be caused by the decrease of other microbial classes. In addition, the secondary abundant class, Anaerolineae account for 20.61%, 18.89%, 11.54%, and 3.54% of the total sequence abundance at ZnO NP concentrations of 0, 30, 90, and 150 mg g−1-VSS, respectively, indicating Anaerolineae activity was inhibited with the increase of the ZnO NP concentrations. However, a slight increased trend could be seen for Bacteroidia; they account for 12.29%, 9.75%, 14.92%, and 16.14% at ZnO NP concentrations of 0, 30, 90, and 150 mg g−1-VSS, respectively. In fact, it just a relative abundance difference trend, which possible caused by the death of other classes or species.
Both Longilinea and Levilinea play a role in the degradation of macromolecular compounds during methanation. As shown in Fig. 7, Longilinea and Levilinea are two predominant genera in Anaerolineae. Their proportions decreased with an increase in the ZnO NP concentrations, indicating that ZnO NPs could inhibit their activity. In addition, Clostridium XI is a typical anaerobe that plays an important role in the production of acetic acid and butyrate during the degradation of carbohydrates. As seen in Fig. 7, the proportion decreased from 2.19% to 1.62%, 0.83%, and 0.58% when the ZnO NP concentrations increased from 0 mg g−1-VSS to 30, 90, and 150 mg g−1-VSS, respectively. This indicates that ZnO NPs could inhibit Clostridium XI activity during anaerobic digestion.
The changing trend of dissolved components reflects the performance of hydrolytic acidification of the anaerobic digestion. ZnO NPs affected the degradation efficiency of macromolecular matter. It was found that the concentrations of the dissolved protein and dissolved polysaccharide increased from 138.5 mg L−1 to 175 mg L−1 and from 909.89 mg L−1 to 1224.33 mg L−1, respectively, with ZnO NPs exposure in anaerobic digestion process. As shown in Fig. 1(D), the degradation efficiency of the protein and polysaccharide decreased with ZnO NPs concentrations increasing from 2 mg kg−1 VSS to 150 mg kg−1 VSS. That is, the degradation rate of them dropped from 66.84% to 55.39% and from 50.56% to 41.02%, respectively.
4 Conclusions
ZnO NPs inhibit the degradation of macromolecular organic matter and reduction of VSS in waste activated sludge during anaerobic digestion. The activities of some key enzymes such as protease, cellulose, acetated kinase, and coenzyme F420 are affected significantly at ZnO NP concentrations higher than 30 mg g−1-VSS. High-throughput sequencing analysis revealed that ZnO NPs decrease the archaeal community diversity but increase the bacterial community diversity to some extent. The shift differs in the structure of archaeal and bacterial community at phylum, class, and genus levels. Particularly, the ZnO NPs decreases the relative abundance of the Euryarchaeota phylum of the microbial community, which could impact the important process of methanation during anaerobic digestion. ZnO NPs could increase the abundance of Clostridia and Bacteroidia, playing an important role in hydrolysis during the anaerobic digestion.Conflicts of interest
There are no conflicts to declare.Acknowledgements
This work was sponsored by Natural Science Foundation of Heilongjiang Province, China (No. LH2020D010) and Open Fund of the Key Laboratory of Urban Water Resource and Environment of Harbin Institute of Technology, China (ESK202004).References
- S. Jafarirad, M. Mehrabi and B. Divband, Mater. Sci. Eng., C, 2016, 59, 296–302 CrossRef CAS PubMed.
- L. Q. Zhang, C. Lei, K. Yang, J. C. White and D. H. Lin, Environ. Sci.: Nano, 2018, 5, 2415–2425 RSC.
- Y. H. Dai, Z. Y. Wang, Y. Zhao, L. L. Xu, L. N. Xu, X. Y. Yu, Y. P. Wei and B. S. Xing, Environ. Sci.: Nano, 2018, 5, 2269–2273 RSC.
- H. N. Huang, X. Zheng, S. Y. Yang and Y. G. Chen, Water Res., 2019, 158, 1–10 CrossRef CAS PubMed.
- S. Grosse, L. Evje and T. Syversen, Toxicol. In Vitro, 2013, 27, 305–313 CrossRef CAS PubMed.
- X. Yang, A. P. Gondikas, S. M. Marinakos, M. Auffan, J. Liu, H. Hsu-Kim and J. N. Meyer, Environ. Sci. Technol., 2012, 46, 1119–1127 CrossRef CAS PubMed.
- A. J. Kennedy, M. S. Hull, A. J. Bednar, J. D. Goss, J. C. Gunter, J. L. Bouldin, P. J. Vikesland and J. A. Steevens, Environ. Sci. Technol., 2010, 44, 9571–9577 CrossRef CAS PubMed.
- E. Müller, R. Behra and L. Sigg, Environ. Chem., 2016, 13, 457–463 CrossRef.
- S. Lanone and J. Boczkowski, Curr. Mol. Med., 2006, 6, 651–663 CrossRef CAS PubMed.
- Ç. Akyol, E. G. Ozbayram, B. Demirel, T. T. Onay, O. Ince and B. Ince, Environ. Sci. Pollut. Res., 2019, 26, 13580–13591 CrossRef PubMed.
- L. Chen, Q. Z. Hu, X. Zhang, Z. T. Cai and Y. Wang, Environ. Pollut., 2019, 248, 743–755 CrossRef CAS PubMed.
- X. Ma, H. Weng and J. Zhang, China Environ. Sci., 2011, 31(8), 1306–1313 CAS.
- S. Eduok, R. Ferguson, B. Jefferson, R. Villa and F. Coulon, Sci. Total Environ., 2017, 609, 232–241 CrossRef CAS PubMed.
- H. Mu and Y. Chen, Water Res., 2011, 45, 5612–5620 CrossRef CAS PubMed.
- Y. Yang, S. Gajaraj, J. D. Wall and Z. Q. Hu, Water Res., 2013, 47, 3422–3430 CrossRef CAS PubMed.
- J. K. Wu, G. G. Zhu and R. Yu, Water, Air, Soil Pollut., 2018, 229, 9 CrossRef.
- L. Appels, J. Baeyens, J. Degreve and R. Dewil, Prog. Energy Combust. Sci., 2008, 34, 755–781 CrossRef CAS.
- E. Lombi, E. Donner, E. Tavakkoli, T. W. Turney, R. Naidu, B. W. Miller and K. G. Scheckel, Sci. Technol., 2012, 46, 9089–9096 CrossRef CAS PubMed.
- R. Ma, C. Levard, J. D. Judy, J. M. Unrine, M. Durenkamp, B. Martin, B. Jefferson and G. V. Lowry, Environ. Sci. Technol., 2014, 48, 104–112 CrossRef CAS PubMed.
- Y. Yang, C. Q. Zhang and Z. Q. Hu, Environ. Sci.: Processes Impacts, 2013, 15, 39–48 RSC.
- J. L. C. P. Grady, G. T. Daigger and N. G. Love, Biological Wastewater Treatment, CRC Press, 3rd edn, Revised and Expanded edn, 2011 Search PubMed.
- U. Alkan, G. K. Anderson and O. Ince, Water Res., 1996, 30(3), 731–741 CrossRef CAS.
- S. F. Aquino and D. C. Stuckey, Environ. Eng., 2007, 133(1), 28–35 CrossRef CAS.
- Ú. E. Kőkdemir, A. S. Çığgın, A. Erdem and N. A. Perendeci, Environ. Sci.: Processes Impacts, 2016, 18, 277–288 RSC.
- K. Sakarya, C. Akyol and B. Demirel, Water, Air, Soil Pollut, 2015, 226, 100–108 CrossRef.
- L. E. Barton, M. Auffan, M. Durenkamp, S. McGrath, J. Y. Bottero and M. R. Wiesner, Sci. Total Environ., 2015, 511(1), 535–543 CrossRef CAS PubMed.
- I. Karadzic, A. Masui and N. Fujiwara, Biosci. Bioeng., 2004, 98(3), 145–152 CrossRef CAS.
- P. J. V. Soest, J. B. Robertson and B. A. Lewis, Dairy Sci., 1991, 74, 3583–3597 CrossRef.
- E. W. J. Van Niel, K. J. Appeldoorn, A. J. B. Zehnder and G. J. J Kortstee, Appl. Environ. Microbiol., 1998, 64(8), 2925–2930 CrossRef CAS PubMed.
- M. A. Kiser, H. Ryu, H. Y. Jang, K. Hristovski and P. Westerhoff, Water Res., 2010, 44(14), 4105–4114 CrossRef CAS PubMed.
- C. Arnaiz, J. C. Gutierrez and J. Lebrato, Bioresour. Technol., 2006, 97(10), 1179–1184 CrossRef CAS PubMed.
- X. M. Wang, Z. F. Li, X. Q. Zhou, Q. Q. Wang, Y. Wu, M. SAINO and X. Bai, Bioresour. Technol., 2016, 219, 150–157 CrossRef CAS PubMed.
- R. Chouari, D. Le Paslier, P. Daegelen, P. Ginestet, J. Weissenbach and A. Sghir, Environ. Microbiol., 2005, 7(8), 1104–1115 CrossRef CAS PubMed.
Footnote |
| † Electronic supplementary information (ESI) available. See DOI: 10.1039/d0ra08671a |
| This journal is © The Royal Society of Chemistry 2021 |

