 Open Access Article
Creative Commons Attribution 3.0 Unported Licence
Improving the hydrothermal stability of zeolite Y by La3+ cation exchange as a catalyst for the aqueous-phase hydrogenation of levulinic acid †
Hue-Tong Vu,
Michael Goepel and
Roger Gläser *
*
Institute of Chemical Technology, Universität Leipzig, Linnéstr. 3, 04103 Leipzig, Germany. E-mail: roger.glaeser@uni-leipzig.de
First published on 29th January 2021
Abstract
La3+ cation exchange is shown to improve the hydrothermal stability and catalytic activity of bifunctional zeolite Pt/Y catalysts in the aqueous-phase hydrogenation of levulinic acid (LA) with formic acid (FA) as hydrogen source. La3+ cation exchange of zeolite Y (nSi/nAl = 16) was conducted both in aqueous solution and in the solid state. The hydrothermal stability of La3+-containing zeolite Y probed by exposure to the reaction mixture (0.2 mol L−1 LA, 0.6 mol L−1 FA) at 473 K under autogenous pressure for 24 h improves with increasing La content. The material exhibiting the highest La content (0.5 mmol g−1) is the most stable with a preservation of 25% of the initial specific micropore volume after the hydrothermal treatment, whereas unmodified zeolite Y completely loses its microporosity. A new procedure using DRIFTS is a useful supplementary tool for quantifying the framework degradation of Y-type zeolites after hydrothermal treatment. Bifunctional Pt/Y catalysts after La3+ cation exchange are more active than the parent Y-zeolite for the hydrogenation of LA to γ-valerolactone (GVL), with significant enhancements in LA conversion, i.e., 94% vs. 42%, and GVL yield, i.e., 72% vs. 34%., after 24 h.
1. Introduction
Lanthanum cation exchange, conducted both in liquid phase (mostly water) and in solid state, has been extensively studied and applied for improving the hydrothermal stability of zeolite Y (Y) in fluid catalytic cracking (FCC), typically operated in the gas phase at moderate to high temperatures, e.g., 573–1073 K.1–4 An important advantage of La3+ cation exchange is the high preservation of both the crystalline structure and textural properties of zeolite Y after ion exchange either in the aqueous phase5–11 or in the solid state.7 The incorporation of La3+ cations into zeolite Y has been proven to increase its stability in FCC. This retards undesired dealumination during catalyst regeneration, which is facilitated under the typical regeneration conditions, i.e., at 973 K in the presence of steam generated through coke combustion.12,13 In addition, La3+ cation exchange of faujasitic zeolites was also reported to enhance the catalytic activity for acid-catalyzed reactions, e.g., isomerization, hydroisomerization and cracking, owing to the presence of “super acid sites” arising from the interaction between Si–OH–Al and La3+ cations in their vicinity.14–16 Most studies, however, deal with gas-phase applications of La3+ cation-exchanged zeolite Y, while its hydrothermal stability in liquid water at elevated temperature (T ≥ 473 K) and under catalytic conditions is still not well understood.Zeolites are considered to be promising catalysts for aqueous-phase processing (APP) of biomass,17–21 in which water is used as a “green solvent”, typically at elevated temperature T ≥ 473 K and pressure p ∼4 MPa.22–27 One prominent example among numerous conversion in APP is the aqueous-phase hydrogenation of biomass-derived levulinic acid (LA) to γ-valerolactone (GVL) using formic acid (FA) as an internal hydrogen source.28–33 LA and FA are both products formed with an equimolar ratio from cellulose hydrolysis.34,35 GVL is a versatile platform chemical which can serve as a “green solvent”,36 a fuel additive37 or an intermediate to the valeric biofuel family38 and a series of fine chemicals.39 The conversion of LA to GVL entails a metal-catalyzed hydrogenation and an acid-catalyzed dehydration (Scheme 1).40 Thus, bifunctional catalysts containing a de-/hydrogenation functionality, e.g., Pt, Ru or Pd, and an acid functionality, e.g., zeolites, activated carbon or alumina, are required.
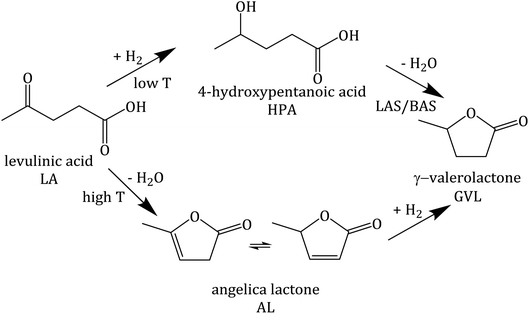 | ||
| Scheme 1 Reaction pathway of hydrogenation of levulinic acid (LA), adapted from ref. 40. | ||
A previous investigation using Pt supported on zeolite Y (Pt/Y) revealed that under the applied reaction conditions (0.2 mol L−1 LA, 0.6 mol L−1 FA, T ≥ 473 K, p ∼4 MPa, 24 h) zeolite Y undergoes a complete loss of crystallinity. This contributed to the comparatively low catalytic activity (LA conversion (XLA) of 42%).41 In the same study, surface silylation of zeolite Y was applied to largely prevent desilication and zeolite framework disruption under APP-related conditions. A significant drawback of this approach is the deterioration of the textural properties (loss of specific surface area by 48% and specific pore volume by 33%) by silylation compared with parent zeolite Y. This results in a drastic decrease in catalytic activity in the hydrogenation of LA (GVL yield (YGVL) of 12% compared with 34% for unmodified Pt/Y).
To overcome these disadvantages, La3+ cation exchange is studied here for stabilization of the zeolite framework via charge compensation and, thus, strengthening Al–O bonds, while preserving crystallinity and textural properties of zeolite Y. Therefore, the current work aims at investigating the influence of La3+ cation exchange (in aqueous solution or in the solid state) on the hydrothermal stability and the catalytic activity of bifunctional Pt/zeolite Y catalysts in the aqueous-phase hydrogenation of LA in the presence of FA. The effects of La3+ cation exchange and silylation are compared in terms of the stabilizing effect on structure of zeolite Y under APP-related conditions. Additionally, a new procedure using diffuse reflectance infrared Fourier transformation spectroscopy (DRIFTS) was examined as a supplementary tool for quantifying the deterioration degree of the zeolite Y framework after exposure to APP-related conditions.
2. Experimental section
2.1 Materials
Zeolite Y (Y) (CBV 720, H+ form, nSi/nAl = 16) was supplied by Zeolyst International. Levulinic acid (LA, ≥ 98%) was purchased from by Merck Schuchardt OHG. Lanthanum(III) nitrate hexahydrate (La(NO3)3·6H2O, 99.99%), formic acid (FA, 99–100%) and γ-valerolactone (GVL, 99%) were obtained from Sigma-Aldrich. Pentanoic acid (PA, 99%), sodium nitrate (NaNO3, 99.0%) and tetraammine platinum(II) nitrate (Pt(NH3)4(NO3)2, 99.99%) were purchased from Alfa Aesar. All chemicals were used as received without further purification.2.2 Catalyst preparation
 | (1) |
2.3 Catalyst characterization
Diffuse reflectance infrared Fourier transform spectroscopy (DRIFTS) was carried out in a Bruker Vector 22 FTIR solid phase spectrometer equipped with a heated DRIFTS cell with a ZnSe window. Prior to the measurement, the samples were dried at 573 K for 30 min under an N2 flow of 100 cm3 min−1. Using the same atmosphere, spectra were recorded at 373 K in the range of 500–4000 cm−1, by addition of 100 scans and with a nominal resolution of 4 cm−1. For pyridine adsorption experiments, the cell was cooled and kept at 363 K, which was followed by saturation of the zeolite with gaseous pyridine in an N2 flow (100 cm3 min−1) for 1 h. In order to remove physisorbed pyridine, the sample was flushed with N2 (100 cm3 min−1) at 363 K for 2 h. For recording the spectrum, the temperature was increased to 473 K and held for 30 min. The bands located at 1445 cm−1 and 1554 cm−1 are respectively ascribed to Brønsted (BAS) and Lewis acid sites (LAS).44 The intensity of these two bands (1445 cm−1 and 1554 cm−1) were used to calculate the ratio of BAS-to-LAS.The acid site density (ASD) and acid site strength distribution of zeolite Y before and after modification were determined by temperature-programmed desorption of ammonia (TPD-NH3) using a tubular glass microreactor coupled with a mass spectrometer (MS, Pfeiffer GSD 301). 50 mg of zeolite powder were placed in the glass reactor and heated with a ramp of 5 K min−1 under helium flow (30 cm3 min−1) to 573 K, at which the temperature was held for 1 h for drying. After cooling down to 363 K, the sample was flushed with NH3 via 6 successive pulses of 1 cm3 until saturation. Subsequently, physisorbed NH3 was removed by treatment at 363 K under the same He flow. This was followed by heating up to 823 K with a ramp of 10 K min−1. The amount of desorbed NH3 was quantified using the MS fragment m/z = 15. Depending on the temperature at maximum NH3 desorption (Tdes), acid sites are classified into 3 groups, i.e., strong (Tdes ≥ 750 K), moderate (500 K < Tdes < 750 K) and weak (Tdes ≤ 500 K) acid sites as proposed for Y-type zeolites.45
A micromeritics ASAP2010 sorption analyzer was used to record N2 sorption isotherms at 77 K. The samples were evacuated at 523 K under vacuum pressure of 3 × 10⁻¹¹ MPa for 6 h prior to the measurements. The specific surface area ABET was determined by the Brunauer–Emmett–Teller (BET) model. The specific pore volume VP was estimated from the N2 uptake at a relative pressure p p0−1 of 0.99. The specific micropore volume Vmicro was calculated using the t-plot model. The specific mesopore volume (Vmeso) determined as Vmeso = VP − Vmicro.
The element content was determined by optical emission spectrometry with inductively coupled plasma (ICP-OES) using a PerkinElmer Optima 8000. Prior to the analysis, the samples were dissolved in 2.0 cm3 HF, 3.0 cm3 HNO3 and 3.0 cm3 HCl and diluted to obtain aqueous solutions which also contained 12.0 cm3 H3BO4 for complexation of excessive HF.
Powder X-ray diffraction (XRD) patterns were recorded at room temperature using a Siemens D5000 diffractometer. The diffraction intensity of Cu-Kα radiation (λ = 0.154 nm) was measured in the range of 2θ between 4° and 90°, with a step size of 0.005° and a counting time of 0.2 seconds. The full width at half maximum of the reflex at 2θ = 15.9° is referred to as FWHM15.9.
Energy dispersive X-ray (EDX) spectroscopy was performed on a LEO 1530 Gemini (Zeiss, Germany, acceleration voltage 20 kV) equipped with an EDX detector from Oxford Instruments (Model 7426). EDX spectra were evaluated with the INCA software, developed by ETAS. The mean element content, e.g., nLa, nAl, nNa, nSi, and the corresponding standard deviation, e.g., ΔnLa, ΔnAl, ΔnNa, ΔnSi, were calculated using results for 3 different particles (3 point scans for each particle). Afterwards, the nLa/nAl-ratio was determined using the mean element content, and the error of the molar ratio, e.g., Δ(nSi/nAl), was calculated following the rule of uncertainty propagation as
 | (2) |
Transmission electron microscopy (TEM) was conducted using a JEOL JEM-2100 Plus instrument. Zeolites were ground, suspended in ethanol, and segregated for 10 min. A few drops of this suspension were placed on a lacey carbon copper grid. Ethanol was evaporated at room temperature. High angle annular dark field scanning transmission electron microscopy (HAADF-STEM) imaging was carried out at 200 kV using a beam current of 12 μA.
2.4 Investigation of the hydrothermal stability
Stability tests were conducted for the zeolites Y, Na–Y and the La3+ cation-exchanged zeolites. The reactant solution for the stability tests and for the catalytic experiments (cf. Section 2.5) was identical, i.e., a 5 wt% aqueous solution of LA (0.2 mol L−1) and FA (0.6 mol L−1). In a stainless-steel autoclave with a 60 cm3 polytetrafluoroethylene (PTFE) liner, 1 g of the zeolite, dried at 373 K under static air for 12 h prior to the experiment, was added to 40 cm3 of the reactant solution. The sealed autoclave was kept in an oven at 473 K for 24 h. After rapid cooling the autoclave to room temperature, the solid was separated by centrifugation, and subsequently washed three times with 30 cm3 of deionized water. The obtained solid was dried at 373 K in static air for 24 h and subsequently analyzed by XRD, N2 sorption and DRIFTS.2.5 Catalytic hydrogenation of levulinic acid with formic acid
Catalytic experiments were carried out in a 300 cm3 stainless steel batch reactor (Model #4560, Parr Instruments Company) with an overhead stirrer, a heater and an external monitor (Model # 4848, Parr Instruments Company) for controlling temperature, pressure and stirring speed. Prior to the catalytic experiments, each catalyst was pressed, crushed and sieved to obtain particles with an average grain size < 200 μm. Subsequently, the catalysts were externally reduced using a tubular oven at 673 K under a flow of H2 (2.0 cm3 min−1) in N2 (8.0 cm3 min−1) for 4 h. In a typical catalytic experiment, 0.50 g reduced catalyst and 125 cm3 of the reaction solution (cf. Chapter 2.4) were loaded into the reactor. The reactor was sealed, purged with N2 three times and heated to 493 K. The reaction was performed at 493 K under autogenous pressure for 24 h while stirring at 700 min−1.Liquid samples were withdrawn at the start of the reaction, i.e., when the desired temperature was reached, typically after 15 min, and after 6, 12 and 24 h of reaction. The withdrawn samples were filtered and characterized by high-performance liquid chromatography (HPLC). An HPLC system (Prominence-HPLC, Shimadzu, Kyoto, Japan) equipped with a photo-diode array detector and a Macherey-Nagel Nucleodur PolarTec column (4.6 × 250 mm) was used for the quantification of FA, LA, PA and GVL. An aqueous solution of 5 mmol L−1 H2SO4 was used as the mobile phase at a flow rate of 0.8 cm3 min−1 and the column was operated at 313 K. Quantification was conducted based on the intensity at a wavelength of 210 nm for FA, GVL and PA, and 226 nm for LA. Retention times of FA, LA, PA and GVL were determined using commercial samples of FA, LA, PA and GVL.
The conversion of FA (XFA), LA (XLA) and the yield of PA (YPA), GVL (YGVL) were calculated from the concentration of the compounds determined via external calibration of the respective integrated peak area.
 | (3) |
 | (4) |
 | (5) |
 | (6) |
After the reaction, the reactor was cooled to room temperature, and the catalyst was removed by centrifugation, washed three times with 30 cm3 deionized water, dried in air at 373 K for 12 h and subsequently analyzed by XRD and N2 sorption. The carbon balance can only be closed to 80% due to the formation of humins strongly attached to the reactor wall.
3. Results and discussion
3.1 Ion exchange in the liquid phase vs. solid-state ion exchange
| Material | nLa/mmol g−1 | nSi/nAl | La3+ cation exchange degree/% |
|---|---|---|---|
| a Determined by ICP-OES.b n. d.: not determined. | |||
| Y | n. d.b | 16 ± 1a | n. d. |
| Na–Y | n. d. | 15 ± 1a | n. d. |
| 0.3La,Na–Y(lq) | 0.19 ± 0.05 | 19 ± 2 | 62 |
| 0.6La,Na–Y(lq) | 0.46 ± 0.04 | 20 ± 2 | 130 |
| 0.7La,Na–Y(lq) | 0.32 ± 0.06 | 24 ± 2 | 104 |
| 0.1La–Y(ss) | 0.08 ± 0.03 | 18 ± 2 | 21 |
| 0.2La–Y(ss) | 0.16 ± 0.05 | 17 ± 2 | 45 |
| 0.3La–Y(ss) | 0.23 ± 0.05 | 18 ± 2 | 65 |
| 0.7La–Y(ss) | 0.50 ± 0.29 | 17 ± 2 | 140 |
In particular, after the first La3+ cation exchange step in the liquid phase, 0.3La,Na–Y(lq) was obtained with a La3+ cation exchange degree of 62%. The La3+ cation exchange degree reached 130% (0.6La,Na–Y(lq)) and dropped to 104% for 0.7La,Na–Y(lq) after two further successive ion exchange steps. This can be associated with the fact that Na–Y was saturated with La3+ cations after the second exchange step (nLa = 0.46 mmol g−1). Thus, the third ion exchange step did not improve the La3+ cation exchange degree, but rather caused leaching of La3+ cations resulting in a lower La content (nLa = 0.32 mmol g−1). Compared with the La3+ cation exchange degree for zeolite Y in the H+ form shown in Table S1,† the presence of Na+ cations in the zeolite Na–Y facilitates the La3+ cation exchange process as indicated by the much higher La3+ cation exchange degrees. For example, the La3+ cation exchange degree after the first ion exchange step using Na–Y is 62% for 0.3La,Na–Y(lq) with respect to 45% for 0.2La–Y(lq) without the Na+ cation exchange. The promoting effect of Na+ cations is well known and related to their weaker electrostatic attraction to the negative charges of the zeolite framework in comparison to H+.7
Demetallation (desilication and dealumination), a typical disadvantage of La3+ cation exchange in the liquid phase, is also observed here as evident from the increased nSi/nAl-ratios, e.g., nSi/nAl = 19, 20, and 24, after three sequential La3+ cation exchange steps starting from zeolite Na–Y (nSi/nAl = 15). To quantify the extent of dealumination and desilication after La3+ cation exchange in the liquid phase, the concentration of Al3+ and Si4+ of the filtrate after each ion exchange step were determined by ICP-OES (cf. Table S2†) and the mass loss of Al and Si due to leaching after each La3+ cation exchange step was calculated (cf. Fig. S3†). Thus, loss of Al due to leaching after each of the three sequential La3+ cation exchange steps is 3.5, 0.6 and 0.1 wt%. These values are inversely linear with the nSi/nAl-ratio of the starting zeolite materials, i.e., 15, 19 and 20, respectively. In contrast, the desilication increases from 0.2 over 0.3 to 0.4 wt% after the three sequential La3+ cation exchange steps. The leached Si weight percentage is not linearly correlated to the nSi/nAl-ratio of the starting materials. The desilication is more pronounced after the third La3+ cation exchange step. Despite the slight increase in nSi/nAl-ratio from 19 to 20, the weight percentage of leached Si increases significantly from 0.3 to 0.4 wt%. This is most probably a consequence of the dealumination which generates three new silanol groups Si–OH per Al atom removed. The hydrolysis of siloxane bonds (Si–O–Si) takes place at the newly generated Si–OH sites and, thus, facilitates further desilication.46 This finding is consistent with an earlier study on the La3+ cation exchange in the liquid phase of ultra-stabilized zeolite Y (H-USY, nSi/nAl = 3.1) using a 0.5 mol L−1 La(NO3)3 aqueous solution.7
In contrast, no demetallation was observed after solid-state La3+ cation exchange. Also, the nSi/nAl-ratio remains unaffected after the ion exchange. With increasing the initial nLa/nAl-ratio to 1.2, the highest La content is obtained for 0.7La–Y(ss), i.e., nLa = 0.50 mmol g−1, which is comparable to 0.46 mmol g−1 (0.6La,Na–Y(lq)) the highest La content obtained from the La3+ cation exchange in the liquid phase. The higher standard deviation of the La content (ΔnLa) determined by SEM-EDX for 0.7La–Y(ss), i.e., ΔnLa = 0.29 mmol g−1, with respect to ΔnLa = 0.04 mmol g−1 (0.6La,Na–Y(lq)) or ΔnLa = 0.06 mmol g−1 (0.7La,Na–Y(lq)) is an indication of a lower homogeneity of local La distribution obtained after solid-state La3+ cation exchange. It was also observed that with increasing initial nLa/nAl-ratio, the ion exchange efficiency, i.e., the fraction of La3+ cations initially present in the ion exchange mixture incorporated into zeolite Y, decreased. As expected, the ion exchange efficiency is 53% for low initial nLa/nAl (≤0.3), i.e., 0.1La–Y(ss) and 0.2La–Y(ss), and decreases to approximately 40% for both 0.3La–Y(ss) and 0.7La–Y(ss). This is due to the decreasing availability of exchange positions, i.e., charge compensators of the negative charges of the zeolite framework AlO4− determined by the Al content of the parent zeolite Y.
Interestingly, irrespective of the ion exchange procedure, a La3+ cation exchange degree > 100% was observed for highly ion-exchanged zeolites (nLa ≥ 0.32 mmol g−1), i.e., 0.6La,Na–Y(lq), 0.7La,Na–Y(lq) and 0.7La–Y(ss). This observation is likely related to the complex nature of introduced La species. The incorporated La3+ cations are likely present not only as La3+ cations, but also as hydroxylated La3+ cations7 and as complexes47 formed through the dissociation of water in the coordination sphere of the La3+ cations as
| La3+ + nH2O → (La(OH)n)(3−n)+ + nH+ | (7) |
| 2La3+ + nH2O → (La–O–La)2(3−n)+ + 2nH+ | (8) |
According to the charge-compensating rule, one La3+ cation compensates the charges of three adjacent AlO4− units. The existence of hydroxylated or complex species decreases the apparent lanthanum charge. Thus, La3+ cations are not necessarily restricted to the anticipated charge-compensation rule, but can also interact with two or only one AlO4−. Consequently, zeolite Y can accommodate an excess amount of La species. This is probably the case for the highly siliceous zeolite Y, in which the probability to find three AlO4− sites in close proximity is scarce. The dissociation of water forming the needed OH− species for the formation of hydroxylated La3+ cations and complexes is most likely favored in the presence of a high density of negative charged framework oxygen atoms. Furthermore, the presence of the various hydroxylated cations or complexes is evident from DRIFTS results (Fig. 1). The band corresponding to the bridging OH groups (Si–OH–Al) initially centered at 3562 cm−1 for the zeolites Y and Na–Y is observed at a lower wavenumber, i.e., ν = 3558 cm−1, for 0.7La,Na–Y(lq) and with a broader shape. The red shift is probably because of the interaction between Si–OH–Al groups and the OH groups attached to extra framework La3+ cations which were previously reported at the wavenumber of 3556 cm−1.48 The broad shape is an indication of a complex mixture of interacting OH groups attached to La3+ cations.13 Since the La3+ cation exchange degree is calculated based on the bulk La content determined by EDX analysis without taking into account the nature of incorporated La, the La3+ cation exchange degree > 100% is observed for the zeolites with high La content (nLa ≥ 0.32 mmol g−1).
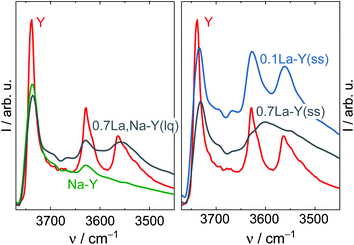 | ||
| Fig. 1 DRIFT spectra of the zeolites Y and Na–Y before and after La3+ cation exchange in the liquid phase (left) and in the solid state (right) recorded at 373 K. | ||
Nevertheless, to obtain highly ion-exchanged zeolites, the La3+ cation exchange in the solid state appears to be better suited in comparison to the ion exchange in the liquid phase as the involvement of a large quantity of expensive lanthanum salt (high La3+ cation exchange efficiency) and sequential ion exchange experiments are obsolete. More importantly, the undesired demetallation generating additional framework defects (silanol groups) is prevented in the solid-state ion exchange. On the other hand, at high La content (nLa > 0.50 mmol g−1), the comparatively low homogeneity of local La distribution indicated by a higher standard deviation of La content (ΔnLa) determined by SEM-EDX is a potential disadvantage of the solid-state La3+ cation exchange.
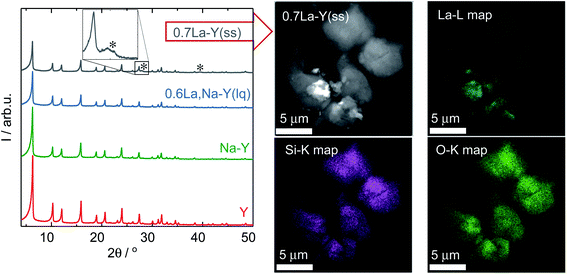
Additionally, the La3+ cations were observed in the form of La2O3 as suggested by the XRD patterns of the zeolite 0.7La–Y(ss) shown in Fig. 2. In particular, two broad reflexes are found at 2θ of 27.9° and 39.4° which can be assigned to (100) and (102) planes characteristic of La2O3 (JCPDS card number 05-0602). However, La2O3 reflexes are not present for other materials having comparable values of nLa/nAl (0.6La,Na–Y(lq) and 0.7La,Na–Y(lq)) from the La3+ cation exchange in the liquid phase. Thus, it is suggested that La2O3 species introduced by the ion exchange procedure in the liquid phase are either present as fine particles (<5 nm) which are not detected by XRD or absent. The observation of La2O3 particles only after La3+ cation exchange in the solid-state for the zeolite 0.7La–Y(ss) with the particle size up to 2 μm (estimated from STEM in Fig. 2, right) might explain its considerably higher standard deviation of La content (ΔnLa = 0.29 mmol g−1) (cf. Chapter 3.1.1).
Therefore, it is concluded that both La3+ cation exchange procedures hardly affect the zeolite Y crystal structure. However, at high La content (nLa > 0.50 mmol g−1), the comparatively low homogeneity of local La distribution (indicated by the La2O3 XRD reflexes and a higher ΔnLa determined by SEM-EDX) might be a drawback of the solid-state La3+ cation exchange.
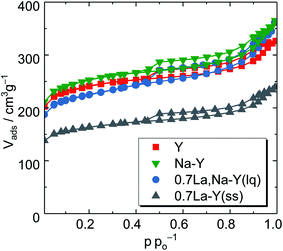 | ||
| Fig. 3 N2 sorption isotherms of the zeolites Y, Na–Y and highly La3+ cation-exchanged zeolites (0.7La,Na–Y(lq) and 0.7La–Y(ss)). | ||
To gain a deeper insight, the t-plot model was used to determine the specific micropore volume (Vmicro). All absolute values of textural properties, e.g., specific surface area (ABET), total pore volume (VP) and Vmicro, derived from N2 sorption results are summarized in Table 2. Irrespective of the ion exchange procedure applied, Vmicro gradually decreases with increasing nLa/nAl up to 0.7 (Fig. 4). As for the solid-state La3+ cation exchange, the reduction of Vmicro (from 0.28 to 0.20 cm3 g−1) is accompanied with a steady loss in specific pore volume VP (from 0.51 to 0.37 cm3 g−1) as well as in specific surface area (from 788 to 533 m2 g−1). This is probably due to a partial pore blockage caused by La2O3 particles (cf. Chapter 3.1.1).
| Material | La3+ cation exchange degree/% | ABETa/m2 g−1 | VPb/cm3 g−1 | Vmicroc/cm3 g−1 |
|---|---|---|---|---|
| a Via BET.b Single point BET.c t-Plot.d n. d.: not determined.e Data from ref. 41. | ||||
| Y | n. d.d | 113 (788) | 0.35 (0.51) | 0.00 (0.28) |
| Na–Y | n. d. | n. d. (815) | n. d. (0.56) | n. d. (0.27) |
| 0.3LaNa–Y(lq) | (62) | 124 (733) | 0.46 (0.49) | 0.01 (0.25) |
| 0.6LaNa–Y(lq) | (130) | 212 (717) | 0.51 (0.49) | 0.04 (0.24) |
| 0.7LaNa–Y(lq) | (104) | 145 (749) | 0.40 (0.56) | 0.02 (0.24) |
| 0.1La–Y(ss) | (21) | n. d. (686) | n. d. (0.47) | n. d. (0.24) |
| 0.3La–Y(ss) | (65) | 106 (727) | 0.42 (0.49) | 0.01 (0.25) |
| 0.7La–Y(ss) | (140) | 187 (533) | 0.38 (0.37) | 0.05 (0.20) |
| Silylated Ye | n. d. | 346 (411) | 0.31 (0.34) | 0.12 (0.15) |
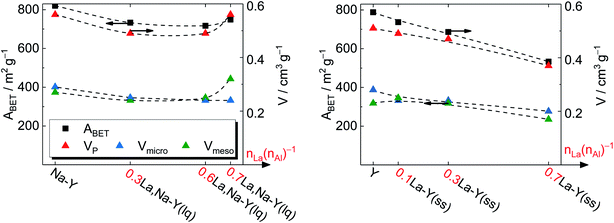 | ||
| Fig. 4 Specific surface area ABET and specific pore volume VP of zeolite Y before and after La3+ cation exchange in the liquid phase (left) and in the solid state (right). | ||
On the other hand, the reduction of Vmicro caused by the La3+ cation exchange in the liquid phase is a result of demetallation (cf. Chapter 3.1.1). The removal of both Al and Si gradually increases with repeating the ion exchange steps. Consequently, it causes a partial extraction of material from the zeolite and results in a widening of the channels and thus a distinct formation of mesopores. After the third ion exchange step, the effect of demetallation is especially pronounced for the zeolite 0.7La,Na–Y(lq) as indicated by a lower Vmicro (0.24 cm3 g−1) and a significantly higher specific mesopore volume (Vmeso = 0.32 cm3 g−1) with respect to the parent zeolite Y (Vmicro = 0.28 cm3 g−1, Vmeso = 0.23 cm3 g−1).
Comparing the extent of influence of the two La3+ cation exchange steps (in the liquid and the solid phase) on the textural properties, the procedure in solid state leads to a higher loss in Vmicro, i.e., 0.08 cm3 g−1 (0.7La–Y(ss)) vs. 0.04 cm3 g−1 (0.7La,Na–Y(lq)), and also in ABET (39 m2 g−1 vs. 255 m2 g−1, respectively). However, the solid-state La3+ cation exchange still is more attractive due to the reasons stated in Chapter 3.1.1 (mainly the fact that less La salt is needed to achieve comparable La contents).
3.2 Hydrothermal stability investigation
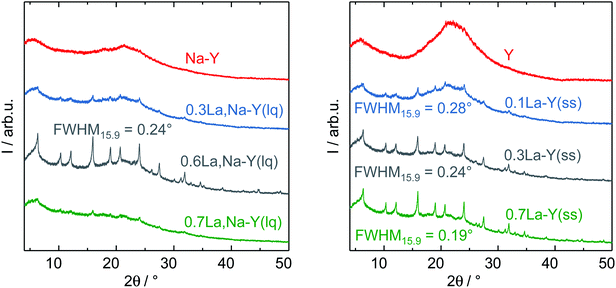
The zeolites Y, Na–Y and the La3+ cation-exchanged zeolites were subjected to a test to examine the influence of introduction of La3+ cations and the procedure of La3+ cation exchange on their hydrothermal stability under APP conditions (cf. Chapter 2.4). Table 2 shows results of N2 sorption analysis of the zeolites after the stability test for 24 h. In particular, zeolite Y underwent a substantial structural disintegration as can be seen from the complete loss of micropore volume and a significant decrease in ABET (86%). This is in good agreement with the loss of characteristic reflexes of Y-type zeolite and the observation of a broad signal at 2θ of 21° representative for an amorphous silica phase in the corresponding XRD pattern (Fig. 5). A similar XRD pattern was also recorded for Na–Y after the stability test suggesting that the Na+ cation exchange had a negligible influence on the hydrothermal stability of zeolite Y.Independent of the ion exchange procedure, La3+ cation-exchanged zeolites show a partial preservation of the initial textural properties and the faujasite-type structure after the hydrothermal stability test as indicated by XRD results (Fig. 5). The N2 sorption results suggest that the preservation extent of ABET, VP and Vmicro is associated with the La3+ cation exchange degree. With respect to the La3+ cation exchange in the liquid phase, the increase in the La3+ cation exchange degree from 62% to 104%, 130% results in a smaller loss in ABET (83%, 81% and 70%) and Vmicro (96%, 92% and 83%). Thus, 0.6La,Na–Y(lq) with the highest La3+ cation exchange degree of 130% is the most stable among the La3+ cation-exchanged zeolites based on Na–Y. This finding is consistent with those from XRD (Fig. 5, left). The reflexes characteristic of faujasite-type zeolites are still clearly visible in the XRD pattern of 0.6La,Na–Y(lq), however, less pronounced for 0.7La,Na–Y(lq) and 0.3La,Na–Y(lq).
Similar to the observation for the La3+ cation exchange in the liquid phase, 0.7La–Y(ss) (La3+ cation exchange degree = 140%) is the most stable material obtained from the solid-state La3+ cation exchange procedure. In comparison to 0.6La,Na–Y(lq), 0.7La–Y(ss) exhibits the smaller loss of ABET (65% vs. 70%) and Vmicro (75% vs. 83%). Thus, 0.7La–Y(ss) is the most stable zeolite among all materials investigated.
Furthermore, the full width at half maximum (FWHM) of XRD reflexes, which is inversely proportional to the crystallite size of zeolite Y, was used as a measure to (semi-) quantitatively determine the extent of structural degradation after test of hydrothermal stability. To mitigate the axial divergence yielding asymmetric reflexes and reducing the calculation inaccuracy, which are more pronounced at low Bragg angles, the second prominent reflex centering at 2θ = 15.9° was investigated. The full width at half maximum of the reflex at 2θ = 15.9° is referred to as FWHM15.9. Zeolite Y exhibits a FWHM15.9 of 0.09° which subsequently increases to 0.19° (0.7La–Y(ss)-140%), 0.24° (0.3La–Y(ss)-65% or 0.6La,Na–Y(lq)-130%) and 0.28° (0.1La–Y(ss)-21%) after the stability test (Fig. 5, right). The increase in FWHM is indicative of a decline in crystallite size probably due to framework disintegration. Therefore, it is confirmed that 0.7La–Y(ss) with the smallest FWHM15.9 is the most stable among all investigated materials.
Noticeably, 0.3La–Y(ss) and 0.6La,Na–Y(lq) exhibit an identical FWHM15.9 (0.24°) despite of the difference in La3+ cation exchange degree (65% vs. 130%, respectively). The similar stability despite different ion exchange degrees might be related to a demetallation taking place during the preparation of 0.6La,Na–Y(lq) which did not occur for 0.3La–Y(ss) (cf. Chapter 2.2.1). The removal of Si and Al generates additional framework defects, i.e., silanol groups, which may facilitate the structural degradation.
In comparison to a zeolite Y silylated using trichloromethylsilane (silane-to-zeolite ratio of 10 mol g−1) reported earlier41 (later referred to as silylated Y), 0.7La–Y(ss) exhibits a lower resistance towards structural degradation. The higher susceptibility to the water attack of 0.7La–Y(ss) is evident from its XRD pattern with a higher FWHM15.9 (0.19° (Fig. 5)), compared with 0.13° of silylated zeolite Y (cf. Fig. S6†) suggesting less pronounced structural disintegration for silylated zeolite Y after 24 h of treatment. In line with XRD results, N2 sorption analysis of silylated zeolite Y shows a smaller loss in Vmicro (20% vs. 75%) and in ABET (16% vs. 65%, Table 2) in comparison to 0.7La–Y(ss) in the current study.
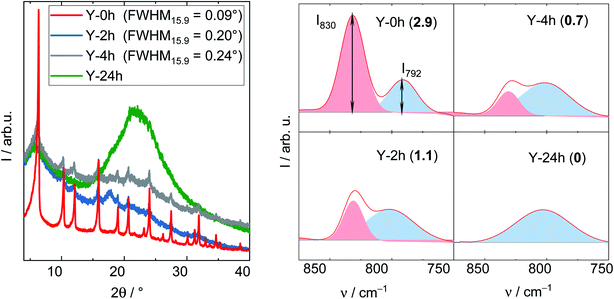
The degradation of zeolite Y framework under APP conditions was further examined by DRIFTS. Firstly, a series of parent zeolite Y with different degradation degree was prepared by varying the treatment time (2, 4 and 24 h) under reaction conditions typical for APP (cLA = 0.2 mol L−1, cFA = 0.6 mol L−1, autogenous pressure, 493 K, 24 h, n = 700 min−1). The obtained materials were characterized by XRD, DRIFTS (Fig. 6) and N2 adsorption analysis (cf. Table S3†). In the XRD patterns, the FWHM15.9, as expected, increases from 0.09° (Y) to 0.20° (after 2 h), 0.24° (after 4 h) and is eventually indistinct from the background with a broad signal at 2θ of 21° representative for amorphous silica (after 24 h). Accordingly, a gradual decrease in ABET was also observed with prolonging the treatment time, in particular from 788 m2 g−1 (Y) to 461, 260 and 111 m2 g−1 after 2, 4 and 24 h, respectively. These observations suggest that the drastic crystallinity loss and amorphization of the zeolite Y occurs quickly during the first 2 h of the experiment. The structural disintegration was complete after 24 h. The same phenomenon is also observed using DRIFT spectroscopy. Here, the shape of symmetric stretching vibration band (νs = 850–750 cm−1) changes accordingly with increasing the treatment time. To properly interpret the νs band, deconvolution was applied resulting in a group of two compositional bands centered at approximately 830 and 792 cm−1. The former band is assigned to the “inter-tetrahedral” mode, which is structure-sensitive, i.e., susceptible to framework distortion affecting the long-range order, whereas the latter at 792 cm−1 corresponds to the “intra-tetrahedral” mode and is structure-insensitive.49 Indeed, the intensity of the band centered at 830 cm−1 (later on referred to as I830) gradually weakens with increasing the treatment time. Furthermore, the band at 830 cm−1 is no longer observed after 24 h, at which the amorphization was complete. In contrast, the intensity of the band at 792 cm−1, i.e., I792, remained unchanged even after 24 h reaction time. Therefore, the I830/I792 ratio was used as a measure of the degradation degree of zeolite Y framework. The results are consistent with XRD, N2 adsorption and DRIFT analysis. With increasing the hydrothermal treatment time, i.e., a higher degree of structural disintegration, I830/I792 ratio decreases significantly from 2.9 (Y-0 h) to 1.1 (Y-2 h), 0.7 (Y-4 h) and further to 0 (Y-24 h). Therefore, it is concluded that DRIFTS, employed in this function for the first time in this study, can be used as a supplementary measure to quantify the degradation degree of zeolite Y framework after hydrothermal treatment.
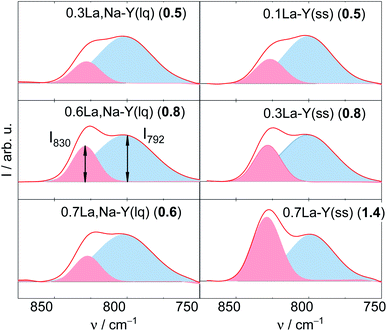
The deconvoluted DRIFTS data of all investigated samples after the stability test are shown in Fig. 7. Accordingly, all La3+ cation-exchanged zeolites can be placed in a descending order of the hydrothermal stability with the corresponding I830/I792 (after 24 h of treatment time): 0.7La–Y(ss) (1.4) > 0.6La,Na–Y(lq) (0.8) ∼0.3La–Y(ss) (0.8) > 0.7La,Na–Y(lq) (0.6) > 0.1La–Y(ss) ∼0.3La,Na–Y(lq) (0.5) > Y (0.0). This finding confirms that 0.7La–Y(ss) is the most stable among the investigated materials. It was thus selected for further investigation of the catalytic activity for the hydrogenation of LA in the presence of FA.
3.3 Hydrogenation of levulinic acid
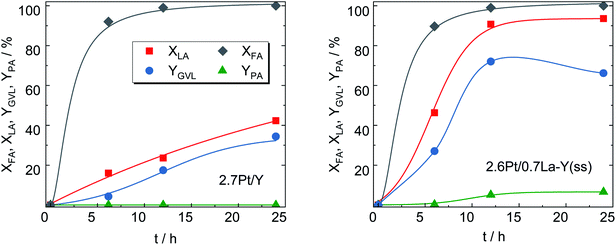
After loading with Pt, 2.7Pt/Y and 2.6Pt/0.7La–Y(ss) the most stable zeolites from Chapter 3.2, were applied as bifunctional catalysts in the hydrogenation of LA with formic acid (FA) as internal hydrogen source. Note that the introduction of Pt leaves the textural properties of the zeolite essentially unaffected as evident, for instance, for the catalyst 2.7Pt/Y with a specific surface area of ABET = 775 m2 g−1 before (Y, cf. Table 2) and 788 m2 g−1 (2.7Pt/Y) after loading with Pt. This is also in accordance with the presence of small Pt nanoparticles on the catalyst.Nearly identical conversion over time was observed for both catalysts in the decomposition of FA (for H2-generation) as depicted in Fig. 8. This is an indication for similar properties of the deposited Pt species catalyzing this reaction and is further confirmed by the comparable Pt content of both catalysts determined by ICP-OES (results shown in Table 3).
Interestingly, despite significantly lower specific surface area (533 vs. 788 m2 g−1), 2.6Pt/0.7La–Y(ss) displays a notably higher LA hydrogenation activity, i.e., XLA = 94%, in comparison to 42% for 2.7Pt/Y after a reaction time of 24 h. Sampling during 24 h of reaction time revealed that LA conversion and GVL yield linearly increased up to 42% and 34%, respectively, for 2.7Pt/Y. In contrast, 2.6Pt/0.7La–Y(ss) displayed a higher LA conversion (94%) and a significantly increased GVL yield (72%) after 12 h. This increase in catalytic activity of 2.6Pt/0.7La–Y(ss) over 2.7Pt/Y, assuming similar properties of the Pt-phase (see above), can be attributed to either a change in acid properties or the improved hydrothermal stability of 2.6Pt/0.7La–Y(ss). Both catalysts investigated in the hydrogenation of LA (2.7Pt/Y and 2.6Pt/0.7La–Y(ss)) show similar acid properties as exemplified by an analogous acid site density (ASD), i.e., 360 μmol g−1 (2.7Pt/Y) and 369 μmol g−1 (2.6Pt/0.7La–Y(ss)) (Table 3). In addition, the BAS-to-LAS ratio determined by DRIFTS is 2.0 (2.7Pt/Y) and 1.4 (2.6Pt/0.7La–Y(ss)) suggesting a comparable fraction of BAS which are required for the LA conversion (cf. Fig. S8†). In agreement, TPD-NH3 results show only a slight decrease in the strong acid site fraction (Tdes ≥ 750 K) of 2.6Pt/0.7La–Y(ss), i.e., 11%, compared with 14% of 2.7Pt/Y. The reduction of strong acid sites for 2.6Pt/0.7La–Y(ss) is probably a result of dehydroxylation and the increasing fraction of weak acid sites (Tdes ≤ 500 K) corresponding to incorporated La3+ cations, i.e., 35% for 2.6Pt/0.7La–Y(ss) compared with 10% for 2.7Pt/Y. Thus, in the current study it is assumed that the acid properties of 2.7Pt/Y and 2.6Pt/0.7La–Y(ss) have inconsiderable influence on the hydrogenation of LA to GVL. Since a loss of 41% ABET and 51% Vmicro was observed for zeolite Y quickly after the first 2 h of reaction time (cf. Y-2 h, Table S3†), the reduced catalytic activity of 2.7Pt/Y is attributed to its lower hydrothermal stability and the resulting substantial structural disintegration. To further validate this hypothesis, the zeolite 0.7La–Y(ss) was applied in the hydrogenation of LA under identical reaction conditions for 2 h (cLA = 0.2 mol L−1, cFA = 0.6 mol L−1, autogenous pressure, 493 K, n = 700 min−1). After filtration, the obtained solid was characterized by DRIFTS and XRD (cf. Fig. S9†). In comparison to Y, 0.7La–Y(ss) exhibits a higher ratio of I830/I792 (1.4 vs. 1.1) and a smaller FWHM15.9 (0.17° vs. 0.20°) confirming higher preservation of the framework for 0.7La–Y(ss). This is in agreement with the N2 sorption results of the catalysts 2.7Pt/Y and 2.6Pt/0.7La–Y(ss) after the hydrogenation of LA with FA for 24 h (Fig. S11†). Both catalysts exhibit mostly mesopores which correspond to a specific mesopore volume of 0.35 cm3 g−1 (2.7Pt/Y) and 0.20 cm3 g−1 (2.6Pt/0.7La–Y(ss), respectively. The lower extent of mesopore formation after the catalytic investigation of 2.6Pt/0.7La–Y(ss) again confirms its higher hydrothermal stability. Hence, the enhanced hydrothermal stability by solid-state La3+ cation exchange is assumed to be the reason for the improved catalytic activity of 2.6Pt/0.7La–Y(ss) (XLA, = 93%, YGVL = 66%) as compared to 2.7Pt/Y (XLA, = 42%, YGVL = 34%) after 24 h reaction time.
Not only the catalytic activity for the hydrogenation of LA into GVL was improved by using 2.6Pt/0.7La–Y(ss). This catalyst also facilitates the formation of pentanoic acid (PA), i.e., YPA = 7%, which was not observed as a reaction product using 2.7Pt/Y. PA is a product of consecutive hydrogenation via the thermodynamically disfavored ring-opening of GVL which strongly depends on the presence of active metal and acid sites50–52 (Scheme 2). The observation of PA as a reaction product of the hydrogenation of LA using 2.6Pt/0.7La–Y(ss) suggests that the incorporation of La3+ cations increases the hydrothermal stability and by that preserves the activity of the metal/acid sites of 2.6Pt/0.7La–Y(ss) under reaction conditions for a longer time, thus enabling the consecutive reaction of GVL to PA to happen.
Finally, the results obtained in the hydrogenation of LA with the La3+ cation-exchanged zeolite Y were compared with the results from an earlier study where the hydrothermal stability was improved via silylation. Despite being more susceptible to the structural degradation (cf. Chapter 3.2, Table 2), 2.6Pt/0.7La–Y(ss) showed a higher catalytic activity, e.g., YGVL = 66%, as compared with YGVL = 12% for 2.5Pt/silylated Y catalyst under identical reaction conditions (cLA = 0.2 mol L−1, cFA = 0.6 mol L−1, 493 K, p ∼ 4 MPa and 24 h). The low catalytic activity of 2.5Pt/silylated Y is mainly attributed to the limited accessibilities to active sites due to the undesired pore blockage by the polymeric silylation layer (as also evident from the lower observed ABET (411 m2 g−1 for 2.5/silylated Y as compared to 788 m2 g−1 for 2.7Pt/Y). In addition, the silylation increases the hydrophobicity of the catalyst further reducing the concentration of the reactants in the proximity to the active sites. Therefore, solid-state La3+ cation exchange can be considered more suitable than silylation for improving hydrothermal stability and the resulting catalytic activity of bifunctional zeolite Y catalysts for the aqueous-phase hydrogenation of LA with FA.
4. Conclusions
La3+ cation exchange of zeolite Y in either liquid phase or solid state is demonstrated to mitigate the framework disintegration under hydrothermal conditions as applied in aqueous phase processing of biomass (water as solvent, pH ∼2, 473–493 K, p ∼4 MPa). The stabilization effect is proportional with the La3+ cation exchange degree irrespective of the ion exchange procedure applied. Consequently, the material with the highest La3+ cations exchange degree, 0.7La–Y(ss) (140%), was the most stable among all studied materials. In order to obtain highly La3+ cation-exchanged faujasite-type zeolites (nLa ≥ 0.5 mmol g−1), the solid-state La3+ cation exchange is advantageous as no sequential ion exchange experiments are needed and the consumption of expensive La salt is greatly reduced. More importantly, the demetallation generating additional framework defects is avoided as compared to the procedure in liquid phase. However, a lower homogeneity of the local La distribution might be a drawback of solid-state La3+ cation exchange. After impregnation with Pt the bifunctional 2.6Pt/0.7La–Y(ss) catalyst is significantly more active as catalyst in the hydrogenation of LA after 24 h, i.e., XLA = 94%, YGVL = 66%, compared to the unmodified 2.7Pt/Y catalyst (XLA = 42%, YGVL = 34%). This increase in activity is likely attributed to the improved hydrothermal stability of the Y-type zeolite. Despite being more susceptible to framework disintegration than the silylated catalyst reported earlier, the La3+ cation exchanged catalyst shows a higher activity in the hydrogenation of LA than its silylated counterpart (XLA = 38% and YGVL = 12%). This is attributed to limited accessibility to the active sites due to silylation. Furthermore, DRIFTS using the intensity ratio of the bands at 830 and 792 cm−1 is, for the first time, proven to be a useful supplementary tool, in addition to the widely accepted methods, e.g., XRD and N2 sorption, to quantify the structural disintegration of zeolite Y by hydrothermal treatment.Conflicts of interest
There are no conflicts of interest to declare.Acknowledgements
The authors would like to thank Dr David Poppitz (for the HAADF-STEM analysis), Dipl.-Ing. Heike Rudzik (for all the ICP-OES analyses) and M. Sc. Aleksa Kojčinović (for his contribution to the preparation La3+-cation exchanged zeolites based on the H+ form of zeolite Y). M. Sc. Florian M. Harth and M. Sc. Eike S. Welter are also greatly acknowledged for their helpful proofreading. M. Sc. Hue-Tong Vu is grateful to Vietnam International Education Development of the Ministry of Education and Training, Vietnam, for funding her doctoral study at Universität Leipzig, Germany.References
- F. Mauge, et al., Zeolites, 1986, 6, 261–266 CrossRef CAS.
- G. de La Puente, et al., Appl. Catal., A, 2000, 197, 41–46 CrossRef CAS.
- F. Lemos, et al., Appl. Catal., 1988, 39, 227–237 CrossRef CAS.
- J. G. Nery, et al., Zeolites, 1997, 18, 44–49 CrossRef CAS.
- J. Scherzer and J. L. Bass, J. Catal., 1977, 46, 100–108 CrossRef CAS.
- J. Scherzer and J. L. Bass, J. Phys. Chem., 1975, 79, 1200–1205 CrossRef CAS.
- F. Schüßler, et al., J. Phys. Chem. C, 2011, 115, 21763–21776 CrossRef.
- H. G. Karge, G. Pál-Borbély and H. K. Beyer, Zeolites, 1994, 14, 512–518 CrossRef CAS.
- H. G. Karge, Zeolites and Microporous Crystals, in Proceedings of the International Symposium on Zeolites and Microporous Crystals, Elsevier, 1994, pp. 135–146 Search PubMed.
- E. Sousa-Aguiar, V. Camorim, F. Zotin and R. Santos, Microporous Mesoporous Mater., 1998, 25, 25–34 CrossRef CAS.
- J. M. Bennett and J. V. Smith, MRS Bull., 1969, 4, 77–86 CrossRef CAS.
- D. W. Breck, Zeolite Molecular Sieves: Structure, Chemistry, and Use, Reprint, Krieger, Malabar Fla., 1984 Search PubMed.
- E. F. Sousa-Aguiar, F. E. Trigueiro and F. M. Z. Zotin, Catal. Today, 2013, 218–219, 115–122 CrossRef CAS.
- F. Schüßler, et al., ACS Catal., 2014, 4, 1743–1752 CrossRef.
- R. Carvajal, P.-J. Chu and J. H. Lunsford, J. Catal., 1990, 125, 123–131 CrossRef CAS.
- H. G. Karge, V. Mavrodinoval, Z. Zheng and H. K. Beye, Appl. Catal., 1991, 75, 343–358 CrossRef CAS.
- T. Ennaert, et al., Chem. Soc. Rev., 2016, 45, 584–611 RSC.
- D. Kubička and O. Kikhtyanin, Catal. Today, 2015, 243, 10–22 CrossRef.
- F. Liguori, C. Moreno-Marrodan and P. Barbaro, ACS Catal., 2015, 5, 1882–1894 CrossRef CAS.
- P. A. Jacobs, M. Dusselier and B. F. Sels, Angew. Chem., Int. Ed., 2014, 53, 8621–8626 CrossRef CAS.
- E. Taarning, et al., Energy Environ. Sci., 2011, 4, 793–804 RSC.
- G. W. Huber, R. D. Cortright and J. A. Dumesic, Angew. Chem. Int. Ed., 2004, 43, 1549–1551 CrossRef CAS.
- J. N. Chheda, G. W. Huber and J. A. Dumesic, Angew. Chem. Int. Ed., 2007, 46, 7164–7183 CrossRef CAS.
- M. Stocker, Angew. Chem. Int. Ed., 2008, 47, 9200–9211 CrossRef CAS.
- B. Kamm, P. R. Gruber and M. Kamm, Biorefineries - Industrial Processes and Products: Status Quo and Future Directions, 3rd reprint, Wiley-VCH, Weinheim, 1st edn, 2008 Search PubMed.
- D. M. Alonso, J. Q. Bond and J. A. Dumesic, Green Chem., 2010, 12, 1493–1513 RSC.
- P. Gallezot, Chem. Soc. Rev., 2012, 41, 1538–1558 RSC.
- M. Al-Naji, et al., J. Mol. Catal. A: Chem., 2016, 417, 145–152 CrossRef CAS.
- S. Pham Anh, S. Nishimura and K. Ebitani, RSC Adv., 2014, 4, 10525–10530 RSC.
- A. M. Ruppert, et al., Catal. Sci. Technol., 2018, 10, 238–251 Search PubMed.
- A. M. Ruppert, et al., Green Chem., 2016, 18, 2014–2028 RSC.
- J. Yuan, et al., Energy Environ. Sci., 2013, 6, 3308–3313 RSC.
- X.-L. Du, et al., Angew. Chem., Int. Ed., 2011, 50, 7815–7819 CrossRef CAS.
- J. J. Bozell, et al., Resour., Conserv. Recycl., 2000, 28, 227–239 CrossRef.
- B. Girisuta, L. P. B. M. Janssen and H. J. Heeres, Ind. Eng. Chem. Res., 2007, 46, 1696–1708 CrossRef CAS.
- D. M. Alonso, S. G. Wettstein and J. A. Dumesic, Green Chem., 2013, 15, 584–595 RSC.
- J. C. Serrano-Ruiz, R. M. West and J. A. Dumesic, Annu. Rev. Chem. Biomol. Eng., 2010, 1, 79–100 CrossRef CAS.
- J.-P. Lange, et al., Angew. Chem., Int. Ed., 2010, 49, 4479–4483 CrossRef CAS.
- I. T. Horváth, et al., Green Chem., 2008, 10, 238–242 RSC.
- O. A. Abdelrahman, A. Heyden and J. Q. Bond, ACS Catal., 2014, 4, 1171–1181 CrossRef CAS.
- H.-T. Vu, F. M. Harth and N. Wilde, Front. Chem., 2018, 6, 143–151 CrossRef.
- K. R. Franklin and R. P. Townsend, J. Chem. Soc., Faraday Trans., 1988, 1(84), 2755–2770 RSC.
- F. E. Trigueiro, et al., J. Alloys Compd., 2002, 344, 337–341 CrossRef CAS.
- M. E. Z. Velthoen, S. Nab and B. M. Weckhuysen, Phys. Chem. Chem. Phys., 2018, 20, 21647–21659 RSC.
- H. G. Karge, V. Dondur and J. Weitkamp, J. Phys. Chem., 1991, 95, 283–288 CrossRef CAS.
- R. M. Ravenelle, et al., J. Phys. Chem. C, 2010, 114, 19582–19595 CrossRef CAS.
- P. Marynen, A. Maes and A. Cremers, Zeolites, 1984, 4, 287–290 CrossRef CAS.
- A. N. Lazarev, Vibrational spectra and structure of silicates, New York Consultants Bureau, 1972 Search PubMed.
- E. M. Flanigen, H. KhatamiI and H. A. Szymanski, in Molecular Sieve Zeolites-I, ed. E.M. Flanigen and L.B. Sand, American Chemical Society, Washington, D. C., 1974, pp. 201–229 Search PubMed.
- K. Kon, W. Onodera and K. Shimizu, Catal. Sci. Technol., 2014, 4, 3227–3234 RSC.
- W. Luo, et al., J. Catal., 2013, 301, 175–186 CrossRef CAS.
- M. Al-Naji, et al., Green Chem., 2020, 4, 1171–1181 RSC.
Footnote |
| † Electronic supplementary information (ESI) available. See DOI: 10.1039/d0ra08907a |
| This journal is © The Royal Society of Chemistry 2021 |

