DOI:
10.1039/D0RA08882J
(Paper)
RSC Adv., 2021,
11, 380-389
Removal of mercury from polluted water by a novel composite of polymer carbon nanofiber: kinetic, isotherm, and thermodynamic studies
Received
19th October 2020
, Accepted 15th December 2020
First published on 23rd December 2020
Abstract
This work aims at the synthesis of a polymer of poly-trimesoyl chloride and polyethyleneimine grafted on carbon fibers (PCF) derived from palm. The obtained PCF was characterized using Fourier-transform infrared spectroscopy (FTIR), scanning electron microscopy (SEM), and energy-dispersive X-ray spectroscopy (EDX) for its structural properties. The obtained PCF was then evaluated for the removal of mercury (Hg(II)) from aqueous solutions using batch adsorption studies at four different temperatures (298, 308, 318, and 328 K). The experimental parameters such as initial concentration, pH, dosage, and contact time were optimized on the mercury adsorption. The percentage removal was 100% with an adsorbent dosage of 100 mg L−1 at a pH between 5 and 7 and temperature of 298 K and thus kinetic, isotherm, and thermodynamic studies were performed under these conditions. By the Langmuir adsorption isotherm, the maximum adsorption capacity of Hg(II) by PCF was 19.2 mg g−1. In addition, results fit the pseudo-second-order model, with R2 > 0.99, to describe the adsorption kinetic mechanism. The adsorption process is spontaneous with an endothermic nature under the studied conditions.
1. Introduction
Water pollution by heavy metals (HMs) is a global serious issue.1 Mercury is considered one of the most hazardous HMs. Due to some of its distinguished physical properties, it is widely used in a variety of industrial, agricultural, and medical applications.2,3 Therefore, mercury pollution in the aquatic system is a result of different industrial activities including plastic, rubber, pulp, paint, pharmaceutical, oil refining, textile, and fertilizer processing.4 It may exist in the environment in organic, inorganic, and/or elemental form.5,6
Mercury is volatile,7 persistent,8 and difficult to be ejected outside the infected organism,9 and human beings have the highest risk of exposure. Therefore, it is considered by the US Environmental Protection Agency (EPA) as one of the top 13 elements with high risk and listed by the European Water Framework Directive (EWFD) as one of the serious pollutants of surface water. It can cause environmental and acute health problems even at low concentrations.10
In the aquatic environment, mercury can form some salts and is found as Hg(II). According to the regulations of the World Health Organization (WHO) and the European Union, 1 and 5 parts per million (ppm) are the maximum permissible limit of Hg(II) in drinking water and wastewater, respectively.11,12 Methylmercury, a more toxic compound, can be formed through the chemical or biological transformation of Hg(II) in aqueous media.13 Therefore, researchers are working hard to propose a feasible solution to maintain the Hg(II) concentration below the allowable limits.
Different chemical and physical methods have been evaluated to remove Hg(II) from aqueous solutions. These techniques include adsorption, ion exchange, reverse osmosis, membrane separation, liquid–liquid extraction, precipitation, electrodeposition, and precipitation.14,15 However, from the engineering point of view, the cost and efficiency of the used technique should be compromised.
The adsorption method is usually more preferable due to its advantages over other methods including its low cost, adsorbent reusability, environmental friendliness, and ease of operation.16 Different adsorbents have been synthesized for Hg(II) removal from aqueous solutions. Clays,17 zeolites,18 and activated carbons19 were used for a long time but with low adsorption capacity. On the other hand, due to the excellent interaction between Hg and the adsorbent surface, the thio/l-functionalized adsorbents have been reported as very effective selective adsorbents to remove Hg(II) from polluted water.20–22 Behjati et al. (2018)23 evaluated the adsorption performance of the di-thiocarbamate nanocomposite impregnated with Fe3O4 to remove mercury from polluted water. It was reported that the adsorption capacity can be improved by controlling the pH values of the treated aqueous solutions. Iannazzo et al. (2017)24 reported a highly efficient adsorption performance of the use of dendrimer-functionalized carbon nanotubes to remove Hg(II) from aqueous solutions and it was a result of the existence of the phosphate group. Fang et al. (2010)25 evaluated the use of functional mesoporous metal–organic frameworks for mercury removal. Poor performance was reported and attributed to the adsorbent instability in water. However, this challenge was overcome by introducing a sulfur group to enhance mercury uptake.26 Recently, Sun et al. (2018)27 studied the adsorption capacity of a composite of metal–organic framework and polymer and an ultra-high adsorption performance was observed and attributed to the increase in the composite porosity.
Polymeric materials and different activated carbons are among the most effective sorbents used to remove Hg(II) from wastewater samples. Adsorbents obtained from natural sources are more desirable because of some environmental and economic concerns. Therefore, activated carbons, obtained from palm28 and organic sewage,11 have been tested. In addition, cross-linked poly(di-thiocarbamate) and hybrid polymer composite were tested for Hg(II) removal.29–31
Activated carbon fibers (ACFs) are lighter and have a larger surface area than activated carbons. Therefore, they are efficient to be used for pollutant removal.32 However, the available literature addressing the use of ACFs to remove Hg(II) from wastewater is very limited. Wang et al. (2009)33 investigated the Hg(II) removal efficiency using sulfur-modified activated carbon fibers and higher adsorption capacity was reported and attributed to the formation of new functional groups. Yao et al. (2014)34 improved the adsorption capacity of Hg(II) by using modified ACFs where sulfur was impregnated on the original ACFs.
Thus, cost effective naturally produced adsorbents were highly promising. However, modification of such adsorbent is required to enhance their removal efficiency. In this work, poly-trimesoyl chloride and polyethyleneimine grafted on carbon fibers (PCF), derived from palm, was synthesized as a novel cost-effective adsorbent for the mercury removal. The obtained PCF was characterized using Fourier-transform infrared (FTIR) spectroscopy, scanning electron microscopy (SEM), and energy-dispersive X-ray (EDX) spectroscopy. The prepared PCF was then evaluated for the removal of mercury from aqueous solutions using batch adsorption studies. PCF showed good mercury removal that can be ascribed due to its multifunctionality. The adsorption kinetics, isotherms, and thermodynamics have been studied.
2. Experimental
2.1 Materials
Chemical reagents including; polyethyleneimine (purity 99%), trimesoyl chloride (99% purity), ethanol (HPLC grade), dimethylformamide (DMF), methanol (HPLC grade), hexane (HPLC grade), mercury(II) (1 g L−1 Hg in nitric acid; certified reference-grade) were acquired from Sigma-Aldrich (St. Louis, MO, USA). All other materials were used as received. Natural mat mesh samples were locally collected from the surrounding date palm tree stems.
2.2 Synthesis
The natural fiber sample was washed with fresh water to remove sand and dust. Then, the washed natural fiber sample was dried. After that, it was pulverized by a mortar and pestle and sieved by a mesh sieve of 50 μm size to have a uniform size of fibers. The sample was then thermally treated in a muffle furnace at 200 °C for 2 h under nitrogen atmosphere gas to provide a low oxygen environment. Then, the sample was allowed to cool. Then, it was washed with distilled water. The obtained carbon fiber was dried for 3 h at 100 °C.
For the synthesis of polymer-modified carbon fiber, 10 g of the obtained carbon fiber was added in a round-bottom flask in an anhydrous DMF and treated with SOCl2 (thionyl chloride) at 0 °C for 2 h under stirring. Then, the system was kept under stirring for 2 days at 70 °C. The acylated carbon fiber was separated by centrifuge. After drying, it was added to 300 ml distilled water and 50 ml ethanol. After that, 10 g of polyethyleneimine was added under stirring. The system was stirred for one day at 70 °C. It was then allowed to cool and filtered to obtain polymer-modified carbon fiber (PCF).
2.3 Characterization
Characterization of PCF was performed using a Field Emission Scanning Electron Microscope (FESEM) (TESCAN, LYRA 3) equipped with energy-dispersive X-ray (EDX) spectroscopy for surface morphology and elemental analysis. A Fourier transform infrared with a spectrum was run on a Thermo Scientific Nicolet 6700 FTIR spectrometer to investigate the functional groups. Sample pellets were prepared by mixing 1% PCF with KBr using an Atlas™ automatic press and then transferring it into an FTIR cell for analysis. A Micromeritics TriStar II PLUS was employed to evaluate the textural properties such as pore size, surface area, and pore volume. Sample degassing occurred at 200 °C under the flow of nitrogen for 3 h to eliminate the impurities. Then, the BET analysis was performed by TriStar II PLUS.
2.4 Adsorption studies
A series of experiments were carried out for estimating the rate of adsorption of mercury onto the PCF surface (kinetics study). The effect of pH has been examined at pH values ranging from 3 to 7 at an adsorbent concentration of 100 mg L−1. To evaluate the temperature effect, the batch adsorption experiments were performed at four different temperatures (298, 308, 318, and 328 K) at the adsorbent dosage and adsorbate concentration of 100 mg, and 100 mg L−1, respectively. The percentage removal of mercury was estimated using eqn (1) while the adsorption capacity was estimated using eqn (2):| |
 | (1) |
| |
 | (2) |
where Ci and Cf refer to the initial and the final concentrations of mercury (mg L−1). Ct is the concentration of mercury at time t (mg L−1). V is the volume (L) of the Hg solution and m refers to the PCF mass in mg. In parallel, blank experiments were established on mercury solutions without adding PCF as control experiments.
3. Results and discussion
3.1 Characterization
The morphological nature of PCF was evaluated using SEM and EDX. Fig. 1 shows the SEM images with different magnifications which indicate the shape of PCF with lengthy granular. EDX spectrum displays the elemental components of PCF including nitrogen, carbon, and oxygen, Table 1. The dispersion of polymer on the carbon fiber (CF) was evaluated by nitrogen mapping. The mapping of N element indicates the uniform distribution of polymer on CF. It should be noted that N element is from the polyethyleneimine. FTIR spectrum indicates the formation of polyamide on CF, Fig. 2. FTIR of PCF compared to IR of CF35 show the dominant absorption peaks of the polymer on CF indicating amine groups (N–H2) contained in 3450 cm−1 while the C–H peaks can be observed at 2850 and 2920 cm−1. The peak of C–N appeared at around 1100–1200 cm−1 while the carbonyl group peak can be observed at 1650 cm−1.36 The bands related to C![[double bond, length as m-dash]](https://www.rsc.org/images/entities/char_e001.gif) C aromatic from the PCF can be observed at 1450 cm−1.37 The N2 adsorption–desorption isotherm indicated a type II isotherm of PCF.38 The BET surface area was found to be 187 m2 g−1, with a pore volume of 0.19 cm3 g−1 and a pore size of 64 Å.
C aromatic from the PCF can be observed at 1450 cm−1.37 The N2 adsorption–desorption isotherm indicated a type II isotherm of PCF.38 The BET surface area was found to be 187 m2 g−1, with a pore volume of 0.19 cm3 g−1 and a pore size of 64 Å.
 |
| | Fig. 1 SEM images, EDX spectrum of PCF, and mapping image of N in PCF. | |
Table 1 Elemental EDX analysis of PCF
| Element |
Apparent concentration |
k Ratio |
Wt% |
| C |
38.50 |
0.38500 |
49.68 |
| N |
28.25 |
0.05029 |
32.52 |
| O |
7.13 |
0.02399 |
13.98 |
| Si |
3.14 |
0.02485 |
1.35 |
| Cl |
1.14 |
0.01000 |
0.50 |
| K |
0.55 |
0.00467 |
0.22 |
| Ca |
2.13 |
0.01903 |
0.87 |
| Zn |
1.67 |
0.01674 |
0.87 |
| Total |
100.00 |
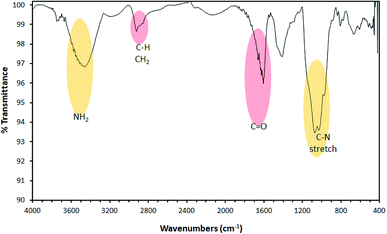 |
| | Fig. 2 FTIR spectrum of PCF. | |
3.2 Adsorption properties
3.2.1 Effect of pH. The adsorption of Hg(II) on the PCF is affected by the aqueous solution pH since both adsorbate and adsorbent are affected by the adsorption media basicity (or acidity). Fig. 3 shows the mercury removal percentages at different pH. While the removal% at pH = 3 was 70%, 60%, and 50% for Hg initial concentration of 20, 50, and 100 mg L−1, respectively, it increases drastically with increasing the solution basicity (increasing pH) to reach 99.5%, 92%, and 88% at pH of 5. Then, it almost remained constant at higher values of pH. Generally, as the pH of the solution increases from 3 to 7, the concentration of H+ ions, competing with Hg2+ for the available adsorption sites on the surface of PCFs, is reduced, and thus adsorption capacity increases. As a result, the solution pH was maintained at 5 during the batch adsorption experiment.
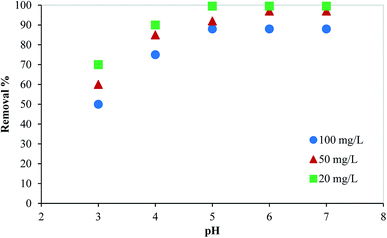 |
| | Fig. 3 Effect of pH on the removal of mercury from aqueous media using PCF. | |
3.2.2 Effect of contact time and initial concentration. As shown in Fig. 4, the adsorption process of Hg(II) by PCFs needs 90 minutes to reach equilibrium. Therefore, all experiments were conducted for more than 90 minutes. Regardless of the mercury initial concentration, more than 35% of the mercury was adsorbed within the first 10 minutes indicating fast removal of Hg over PCF may be due to the amine functional groups. Then, the adsorption rate decreased till reaching equilibrium which can be attributed to the decrease in the available adsorption sites on the PCF surface.
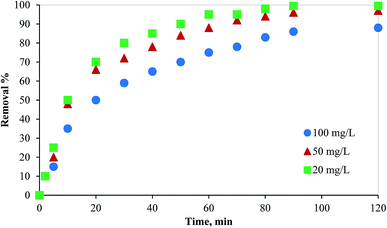 |
| | Fig. 4 Effect of contact time and initial concentration of adsorbate on the removal of mercury from aqueous media using PCF. | |
In addition, the effect of the initial concentration of Hg in an aqueous solution on the adsorption process by 100 mg of PCF was evaluated at 298 K using three different concentrations of the adsorbate (20, 50, and 100 mg L−1). As presented in Fig. 4, as the mercury initial concentration increased, the adsorption performance decreased. For a fixed adsorbent concentration, the available adsorption active sites decrease as the adsorbate concentration increases. The fast removal of mercury from aqueous solutions indicates the excellent performance of the novel synthesized adsorbent.
3.2.3 Effect of adsorbent dosage. The effect of the PCF dosage on the removal of mercury (50 mg L−1) was assessed by changing the PCF mass from 10 to 200 mg within 120 minutes. As shown in Fig. 5, as the adsorbent dosage increased the Hg adsorption increased till reaching 99% at 100 mg of adsorbent dosage. At low adsorbent dosage (below 100 mg), the rate of adsorption increased significantly as the dosage increased till reaching equilibrium. This can be attributed to the large surface area of the adsorbent and available active sites on the adsorbent surface. At the adsorbent dosage of 100 mg, available adsorption active sites were sufficient for complete adsorption, and thus further increase in the dosage will have the same removal% (≈100%). Therefore, kinetic, isotherm, and thermodynamic studies were conducted at 100 mg adsorbent dosage.
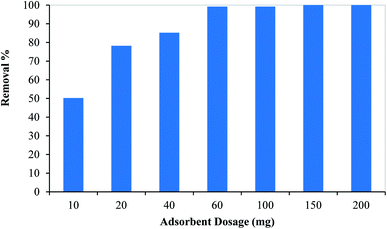 |
| | Fig. 5 Effect of adsorbent dosage on the removal of mercury from aqueous media using PCF. | |
3.2.4 Effect of temperature. The batch adsorption experiments were performed at different temperatures at the adsorbent dosage and adsorbate concentration of 100 mg, and 100 mg L−1, respectively. The temperature effect on the adsorption performance of the prepared adsorbent is shown in Fig. 6. As the temperature increased the mercury removal% increased indicating an endothermic process. However, it can be noted that the material can still adsorb mercury in the range of studied temperature with 86% at room temperature, 90% at 308 K and 92% at 318 K and 97% at 328 K. This indicates the good efficiency of the PCF at wide range of temperatures.
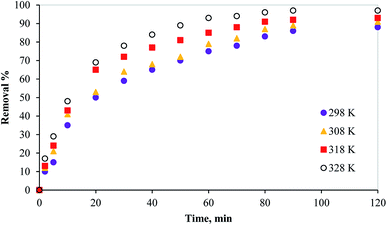 |
| | Fig. 6 Effect of temperature on the removal of mercury from aqueous media using PCF. | |
3.3 Kinetic and isotherm studies
3.3.1 Kinetic models. The adsorption capacity plots at a different initial concentration of mercury are shown in Fig. 7a. A Lagergren first-order model was fitted to the experimental results using eqn (3):39,40| |
ln(qe − qt) = ln![[thin space (1/6-em)]](https://www.rsc.org/images/entities/char_2009.gif) qe − k1t qe − k1t
| (3) |
where qe is the adsorption capacity (mg g−1) at equilibrium, qt is the adsorption capacity (mg g−1) at time t (min), and k1 is the pseudo-first order-rate constant (min−1). A plot of ln(qe − qt) versus time is shown in Fig. 7b. Based on this plot, qe and k1 were estimated (Table 2). The increasing values for the coefficient of determination (R2) as the initial mercury concentration increases indicates very good experimental data fitting by the Lagergren first-order model.
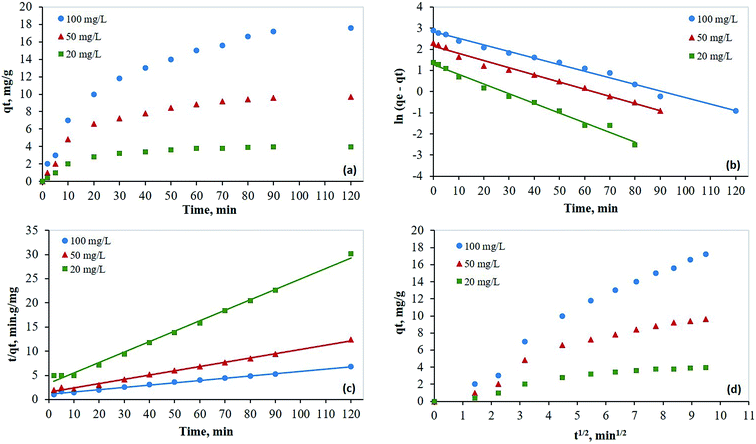 |
| | Fig. 7 Kinetic studies for the removal of mercury on PCF from aqueous solutions at 298 K; (a) capacity plots, (b) Lagergren's first order model; (c) pseudo-second order model; (d) Weber's intraparticle diffusion model. | |
Table 2 Kinetic parameters for the adsorption of mercury over PCF at 298 K
| Ci (mg L−1) |
qe, exp (mg g−1) |
Lagergren first-order |
Pseudo-second-order |
Weber–Morris intraparticle diffusion |
| k1 (min−1) |
qe, cal (mg g−1) |
R2 |
k2 (g mg−1 min−1) |
qe, cal (mg g−1) |
R2 |
Kid (mg g−1 min−1/2) |
C (mg g−1) |
R2 |
| 20 |
4.0 |
0.0457 |
3.60 |
0.9862 |
0.0140 |
4.6 |
0.994 |
0.29 |
1.41 |
0.922 |
| 50 |
10.0 |
0.0339 |
8.57 |
0.9882 |
0.0049 |
11.4 |
0.995 |
0.73 |
3.00 |
0.967 |
| 100 |
17.6 |
0.0311 |
16.96 |
0.9890 |
0.0020 |
21.2 |
0.995 |
1.55 |
2.82 |
0.987 |
In addition, the experimental data were fitted by the pseudo-second-order kinetic model using eqn (4), and the resulting plot is shown in Fig. 7c:41,42
| |
 | (4) |
The values of qe and k2 (second-order rate constant in min−1) were determined from the intercept and slope and presented in Table 2. The consistently high values for R2, ranging from 0.994 to 0.995 across all initial mercury concentrations tested, is a strong indication that the pseudo-second-order model fits well the experimental data.
A Weber–Morris intraparticle diffusion model was fitted to the experimental data using eqn (5):43,44
where
kid is the intraparticle diffusion rate constant (mg g
−1 min
−1/2) and
C is the intercept (mg g
−1). The plot of
qt versus t1/2 (
Fig. 7d) has two linear regions. The second region represents the intraparticle diffusion. It has high
R2 values, which indicate that intraparticle diffusion is the rate-limiting step.
Also, the kinetics was investigated at four different temperatures (298, 308, 318, and 328 K). The adsorption rate was analyzed by examining the above-mentioned kinetic models (Lagergren first order, pseudo-second-order, and Weber–Morris intraparticle diffusion). As expected, as the temperature increased the adsorption capacity increased as mentioned earlier (Fig. 8a). As shown in Fig. 8b and c, although the Lagergren first-order model showed a good linear fitting of the experimental data (R2 ≥ 0.9619), the data were better fitted by the pseudo second-order model (R2 ≥ 0.9939). Furthermore, the Weber–Morris intraparticle diffusion model was used to evaluate the diffusion mechanism according to the available experimental data. As presented in Fig. 8d, the experimental data were linearly fitted well in two zones. While the first one represents the boundary layer diffusion of Hg molecules to the external surface of PCF, the second one represents the diffusion through the adsorbent pores (intraparticle diffusion). All kinetic parameters of the three models at different temperatures are presented in Table 3.
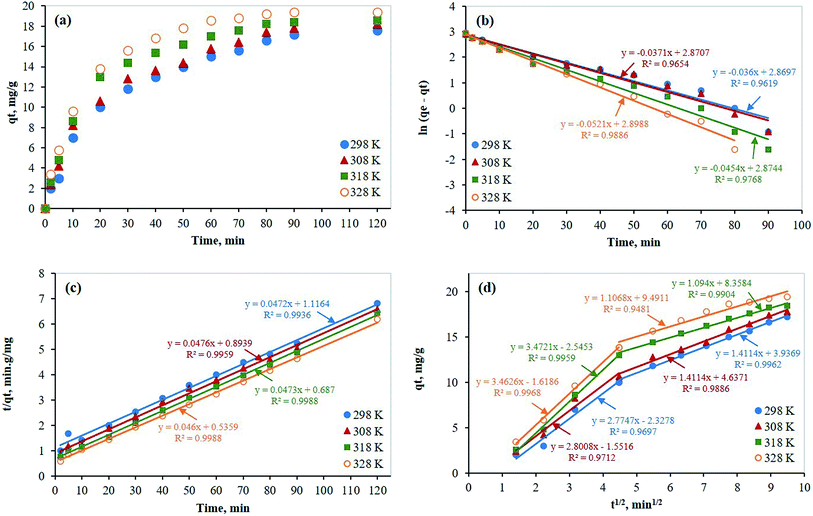 |
| | Fig. 8 Kinetic studies for the removal of mercury on PCF from aqueous solutions containing 100 mg L−1 mercury at different temperatures; (a) capacity plots, (b) Lagergren's first order model; (c) pseudo-second order model; (d) Weber's intraparticle diffusion model. | |
Table 3 Kinetic parameters for the adsorption of mercury over PCF from aqueous solutions containing 100 mg L−1 mercury at different temperatures
| T (K) |
qe, exp (mg g−1) |
Lagergren first-order |
Pseudo-second-order |
Weber–Morris intraparticle diffusion |
| k1 (min−1) |
qe, cal (mg g−1) |
R2 |
k2 (g mg−1 min−1) |
qe, cal (mg g−1) |
R2 |
Kid (mg g−1 min−1/2) |
C (mg g−1) |
R2 |
| 298 |
17.6 |
0.0360 |
17.63 |
0.9619 |
0.002 |
21.19 |
0.9939 |
1.4114 |
3.9369 |
0.9697 |
| 308 |
18.2 |
0.0370 |
17.65 |
0.9654 |
0.003 |
21.01 |
0.9959 |
1.4114 |
4.6371 |
0.9712 |
| 318 |
18.6 |
0.0454 |
17.71 |
0.9768 |
0.003 |
21.14 |
0.9988 |
1.0940 |
8.3584 |
0.9959 |
| 328 |
19.4 |
0.0521 |
18.15 |
0.9886 |
0.004 |
21.74 |
0.9988 |
1.1068 |
9.4911 |
0.9968 |
3.3.2 Isotherm models. The Langmuir, Freundlich, and Temkin adsorption isotherm models have fitted to the experimental data for Hg(II) removal at equilibrium (Fig. 9a, b, and c, respectively). These isotherm models provide insights on the physiochemical adsorption process and they are used for evaluating adsorption capacity. The Langmuir isotherm model (eqn (6)) is used to determine if the adsorption process forms a homogeneous monolayer surface. It may also be utilized to classify the adsorption process as either physical or chemical.45| |
 | (6) |
where KL is the affinity of adsorption sites (L mg−1), qm is the theoretical monolayer sorption capacity (mg g−1), Ce is the concentration of mercury at equilibrium (mg L−1), and qe is the amount of mercury adsorbed per one gram of PCF at equilibrium (mg g−1). The plot of Ce/qe as a function of Ce is shown in Fig. 9a with the parameters listed in Table 4. The slope of this plot gives 1/qm and the Langmuir constant KL is obtained from the intercept.
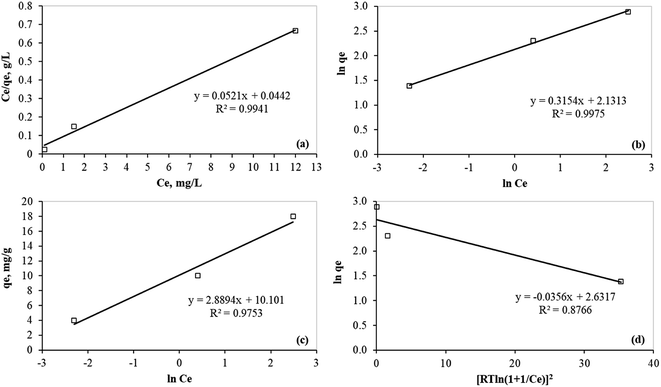 |
| | Fig. 9 Isotherm models for the mercury removal on PCF from aqueous media; (a) Langmuir; (b) Freundlich; (c) Temkin isotherm models; (d) Dubinin–Radushkevich isotherm model. | |
Table 4 Isotherm parameters using models of Langmuir, Freundlich, and Temkin for the adsorption of mercury(II)
| Langmuir |
Freundlich |
Temkin |
Dubinin–Radushkevich |
| qm (mg g−1) |
KL (L mg−1) |
RL |
R2 |
1/n |
n |
KF (mg g−1) |
R2 |
KT (L g−1) |
bT (kJ mol−1) |
R2 |
qD (mg g−1) |
BD (mol2 kJ−1) |
E (kJ mol−1) |
R2 |
| 19.2 |
1.18 |
0.01–0.04 |
0.994 |
0.315 |
3.17 |
8.43 |
0.998 |
32.98 |
0.86 |
0.975 |
13.9 |
0.0356 |
3.75 |
0.877 |
The separation factor, RL, is a dimensionless equilibrium factor calculated according to eqn (7):44
| |
 | (7) |
where
C0 is the initial concentration of mercury (mg L
−1). Adsorption is considered unfavorable if
RL > 1, linear if
RL = 1, favorable if 0 <
RL < 1, and irreversible if
RL = 0.
46 In this study,
RL was found to be between 0.01 and 0.04, which indicates adsorption is favorable. Furthermore, reversible adsorption (
RL ≠ 0) indicates that the adsorption process is physical.
The Freundlich adsorption isotherm model appraises adsorption characteristics on heterogeneous surfaces. In other words, the Freundlich model specifies if adsorption is likely to form multilayers. The Freundlich adsorption isotherm may be expressed with the following equation:47
| |
 | (8) |
where
KF is the Freundlich isotherm constant (mg g
−1) indicating removal capacity, the term 1/
n specifies the adsorption intensity,
n is a constant,
Ce is the concentration of mercury at equilibrium (mg L
−1), and
qe is the amount of mercury adsorbed per one gram of PCF at equilibrium (mg g
−1). The Freundlich adsorption isotherm model was fitted to the experimental data and the plot is shown in
Fig. 9b. Based on the 1/
n value of 0.315 and the corresponding value of
n is 3.17 (
Table 4), mercury adsorption onto PCF favorable on heterogeneous surfaces and forms multilayers of adsorbed mercury on the PCF.
In addition, the Temkin adsorption isotherm model reflects the interaction between the mercury(II) and the PCF, which assumes a linear decline in the adsorption energy. The Temkin model may be expressed by the following equation:48
| |
 | (9) |
where
bT is a constant that defines the adsorption heat (kJ mol
−1),
KT is the equilibrium binding constant (L g
−1),
R is the universal gas constant (expressed in kJ mol
−1 K
−1) and
T is the solution temperature in Kelvin. A plot of
qe as a function of ln
![[thin space (1/6-em)]](https://www.rsc.org/images/entities/char_2009.gif) Ce
Ce provides the isotherm constant, as shown in
Fig. 9c. The data indicates that the equilibrium-binding constant
KT was equal to 32.98 L g
−1, which corresponds to the maximum binding energy (
Table 4).
Furthermore, the adsorption free energy (E) was calculated using the Dubinin–Radushkevich isotherm model expressed as follows:
| |
 | (10) |
| |
 | (11) |
where
qD, and
BD are the model constants obtained from the data linear fitting as shown in
Fig. 9d. The obtained
E value 3.75 kJ mol
−1 (<8 kJ mol
−1) which indicates that the adsorption process is physical.
49
3.3.3 Adsorption thermodynamic. More adsorption characteristics such as spontaneity, the heat evolved/absorbed, and randomness can be obtained from the thermodynamic evaluation of the equilibrium data at different temperatures. Therefore, the change in the standard Gibbs's free energy (ΔG°), entropy (ΔS°), and enthalpy (ΔH°) were calculated. The enthalpy and entropy change can be determined from the slope and intercept of the plot of ln![[thin space (1/6-em)]](https://www.rsc.org/images/entities/char_2009.gif) KD against 1/T using the van't Hoff linear (eqn (12)) as shown in Fig. 10.
KD against 1/T using the van't Hoff linear (eqn (12)) as shown in Fig. 10.| |
 | (12) |
| |
 | (13) |
where KD is the standard thermodynamic equilibrium constant expressed in (L mg−1). The obtained thermodynamic parameters are presented in Table 5.
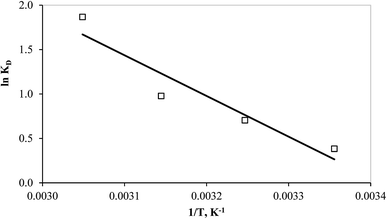 |
| | Fig. 10 van't Hoff plot of the mercury adsorption process at different temperatures. | |
Table 5 Thermodynamic parameters of the mercury adsorption on PCF
| Temperature, K |
ΔG°, kJ mol−1 |
ΔH°, kJ mol−1 |
ΔS°, J mol−1 K−1 |
| 298 |
−0.66 |
38.07 |
130 |
| 308 |
−1.96 |
| 318 |
−3.26 |
| 328 |
−4.56 |
The negative values of the free energy (ΔG°) indicate the spontaneity of the adsorption process of mercury by PCF. In addition, the positive value of ΔH° implies that the adsorption process is endothermic and thus energetically favorable at higher temperatures and this is proved by the decrease of the ΔG° values as the temperature increases. However, the positive value of ΔS° indicates an increase in the randomness at the solution and solid interface (possible structure change) during the adsorption process.
3.4 Comparison with literature
A comparison of the maximum adsorption capacity of mercury by PCF and other different adsorbent materials is presented in Table 6. The synthesized adsorbent in this study showed a better adsorption performance than most of the others. According to the superior finding, the PCF can be used as a promising adsorbent to remove Hg(II) from contaminated drinking and wastewater streams.
Table 6 Comparison of adsorption capacity of mercury with different adsorbents
| Adsorbent |
Qmax Hg(II) (mg g−1) |
Reference |
| Dithiocarbamate-incorporated monosize polystyrene microspheres |
33.20 |
Denizli et al. (2000)50 |
| Dithiocarbamate-anchored polymer/organosmectite composites |
13.40 |
Say et al. (2008)51 |
| Raw smectite |
15.10 |
| Quartamine smectite |
13.40 |
| Magnetic silica |
19.79 |
Helfferich F. (2010)52 |
| Chitosan |
0.013 |
Kushwaha et al. (2010)53 |
| Barbital-immobilised chitosan |
0.004 |
| G-chitosan |
0.0077 |
Kushwaha and Sudhakar (2011)54 |
| BG-chitosan |
0.0065 |
| C. cryptica |
11.90 |
Song et al. (2011)55 |
| S. subspicatus |
9.20 |
| MPTMS-VER |
0.29 |
Saleh (2015)56 |
| MEA-VER |
0.18 |
| VER |
0.099 |
| PEI–AC composite |
16.39 |
Saleh et al. (2017)16 |
| Thio-functionalized graphene oxide/Fe–Mn oxide |
42.40 |
Huang et al. (2017)57 |
| Modified sugarcane bagasse |
11.47 |
Robles et al. (2020)58 |
| PCF |
19.20 |
This work |
4. Conclusions
This study reports the successful synthesis of a polymer grafted on carbon fibers (PCF) from natural and inexpensive resources (palm agricultural waste). Characterization of PCF indicated the successful formation of polymer on the carbon fiber with functional groups of amines and carbonyl groups on the PCF with a surface area of 187 g m−2. The novel synthesized composite was evaluated as an adsorbent to remove mercury(II) from contaminated aqueous solutions. Batch adsorption studies were conducted at four different temperatures (298, 308, 318, 328 K) and the effect of different parameters (pH, contact time, adsorbent dosage, initial adsorbate concentration, and temperature) was investigated. Kinetic studies revealed the superior performance of the pseudo second-order model to fit the experimental data. However, isotherm investigations depicted that the maximum adsorption capacity of Hg(II) over the PCF adsorbent was 19.2 mg g−1, which is better than many of the available adsorbents, and the Freundlich model described well the adsorption isotherm. Furthermore, thermodynamic evaluation confirmed the spontaneity and the endothermic nature of the adsorption process. These findings prove that the PCF is a promising adsorbent to remove mercury from contaminated drinking/wastewater streams at wide range of temperatures. The PCF has many advantages over other available adsorbents including, but it is limited to, cost-effective source of carbon fiber and fast removal of Hg.
Conflicts of interest
There are no conflicts to declare.
Acknowledgements
The authors extend their appreciation to the Deputyship for Research & Innovation, Ministry of Education in Saudi Arabia for funding this research work through the project number IFT20085.
References
- H. N. Mahmud, A. K. ObidulHuq and R. B. Yahya, RSC Adv., 2016, 6, 14778–14791 RSC.
- L. N. Suvarapu and S. O. Baek, J. Anal. Methods Chem., 2015, 2015, 372459 CrossRef.
- C. Tunsu and B. Wickman, Nat. Commun., 2018, 9, 4876 CrossRef.
- S. Basha, Z. V. P. Murthy and B. Jha, Chem. Eng. J., 2009, 147, 226–234 CrossRef CAS.
- T. W. Clarkson and L. Magos, Crit. Rev. Toxicol., 2006, 36, 609–662 CrossRef CAS.
- G. F. Nordberg, and B. A. Fowler, Interactions and mixtures in metal toxicology, in Handbook on the toxicology of metals, Academic Press, San Diego, 4th edn, 2015 Search PubMed.
- E. Oliveri, D. S. Manta, M. Bonsignore, S. Cappello, G. Tranchida, E. Bagnato, N. Sabatino, S. Santisi and M. Sprovieri, Mar. Chem., 2016, 186, 1–10 CrossRef CAS.
- S. Pedro, A. T. Fisk, G. T. Tomy, S. H. Ferguson, N. E. Hussey, S. T. Kessel and M. A. McKinney, Environ. Pollut., 2017, 229, 229–240 CrossRef CAS.
- L. N. Suvarapu, Y. Seo and S. Baek, Rev. Anal. Chem., 2013, 32, 225–245 CAS.
- Q. Zhang, J. Wu and X. Luo, RSC Adv., 2016, 6, 14916–14926 RSC.
- N. Caner, A. Sarı and M. Tuzen, Ind. Eng. Chem. Res., 2015, 54, 7524–7533 CrossRef CAS.
- T. A. Saleh, Environ. Sci. Pollut. Res., 2015, 22, 16721–16731 CrossRef CAS.
- C. T. Driscoll, R. P. Mason, H. M. Chan, D. J. Jacob and N. Pirrone, Environ. Sci. Technol., 2013, 47, 4967–4983 CrossRef CAS.
- F. Kazemi, H. Younesi, A. A. Ghoreyshi, N. Bahramifar and A. Heidari, Process Saf. Environ. Prot., 2016, 100, 22–35 CrossRef CAS.
- K. Hua, X. Xu, Z. Luo, D. Fang, R. Bao and J. Yi, Curr. Nanosci., 2020, 16, 363–375 CrossRef CAS.
- T. A. Saleh, A. Sarı and M. Tuzen, J. Environ. Chem. Eng., 2017, 5, 1079–1088 CrossRef CAS.
- A. Benhammou, A. Yaacoubi, L. Nibou and B. Tanouti, J. Colloid Interface Sci., 2005, 282, 320–326 CrossRef CAS.
- S. Wang and Y. Peng, Chem. Eng. J., 2010, 156, 11–24 CrossRef CAS.
- J. R. Perrich, Activated carbon adsorption for wastewater treatment, CRC Press, Boca Raton, Fla, Chicago, 2018 Search PubMed.
- A. J. Tchinda, E. Ngameni, I. T. Kenfack and A. Walcarius, Chem. Mater., 2009, 21, 4111–4121 CrossRef CAS.
- S. J. L. Billinge, E. J. McKimmy, M. Shatnawi, H. Kim, V. Petkov, D. Wermeille and T. J. Pinnavaia, J. Am. Chem. Soc., 2005, 127, 8492–8498 CrossRef CAS.
- F. He, W. Wang, J. W. Moon, J. Howe, E. M. Pierce and L. Liang, ACS Appl. Mater. Interfaces, 2012, 4, 4373–4379 CrossRef CAS.
- M. Behjati, M. Baghdadi and A. Karbassi, J. Environ. Manage., 2018, 213, 66–78 CrossRef CAS.
- D. Iannazzo, A. Pistone, I. Ziccarelli, C. Espro, S. Galvagno, S. V. Giofre, R. Romeo, N. Cicero, G. D. Bua, G. Lanza, L. Legnani and M. A. Chiacchio, Environ. Sci. Pollut. Res. Int., 2017, 24, 14735–14747 CrossRef CAS.
- Q. R. Fang, D. Q. Yuan, J. Sculley, J. R. Li, Z. B. Han and H. C. Zhou, Inorg. Chem., 2010, 49(24), 11637–11642 CrossRef CAS.
- J. He, K. K. Yee, Z. T. Xu, M. Zeller, A. D. Hunter, S. S. Y. Chui and C. M. Che, Chem. Mater., 2011, 23, 2940–2947 CrossRef CAS.
- D. T. Sun, L. Peng, W. S. Reeder, S. M. Moosavi, D. Tiana, D. K. Britt, E. Oveisi and W. L. Queen, ACS Cent. Sci., 2018, 4, 349–356 CrossRef CAS.
- T. A. Saleh, J. Water Supply: Res. Technol.--AQUA, 2016, 64, 892–903 CrossRef.
- T. A. Saleh, K. Naeemullah, M. Tuzen and A. Sarı, Chem. Eng. Res. Des., 2017, 117, 218–227 CrossRef CAS.
- S. Siva, S. Sudharsan and R. S. Kannan, RSC Adv., 2015, 5, 79665–79678 RSC.
- T. A. Saleh, A. Sarı and M. Tuzen, Chem. Eng. J., 2017, 307, 230–238 CrossRef CAS.
- J. Yu, B. Yue, X. Wu, Q. Liu, F. P. Jiao, X. Y. Jiang and X. Q. Chen, Environ. Sci. Pollut. Res., 2016, 23, 5056–5076 CrossRef CAS.
- J. Wang, B. L. Deng, X. R. Wang and J. Z. Zheng, Environ. Eng. Sci., 2009, 26, 1693–1699 CrossRef CAS.
- Y. X. Yao, H. B. Li, J. Y. Liu, X. L. Tan, J. G. Yu and Z. G. Peng, J. Nanomater., 2014, 2014, 571745 Search PubMed.
- O. Y. Alothman, L. K. Kian, N. Saba, M. Jawaid and R. Khiari, Ind. Crops Prod., 2021, 159, 113075 CrossRef CAS.
- T. Xu, S. Zhou, S. Cui and P. Ding, Composites, Part B, 2019, 178, 107495 CrossRef CAS.
- M. Yang, Y. Gao, H. Li and A. Adronov, Carbon, 2007, 45, 2327–2333 CrossRef CAS.
- S. J. Gregg, and K. S. W. Sing, Adsorption, Surface Area and Porosity, Academic Press, London, 1982 Search PubMed.
- H. Yuh-Shan, Scientometrics, 2004, 59, 171–177 CrossRef.
- S. Lagergren, K. Sven. Vetenskapsakad. Handl., 1898, 24, 1–39 Search PubMed.
- Y. S. Ho and G. McKay, Chem. Eng. J., 1998, 70, 115–124 CrossRef CAS.
- Y. Ho and G. McKay, Process Biochem., 1999, 34, 451–465 CrossRef CAS.
- W. J. Weber and J. C. Morris, J. Sanit. Eng. Div., 1963, 89, 31–60 Search PubMed.
- T. W. Weber and R. K. Chakravorti, AIChE J., 1974, 20, 228–238 CrossRef CAS.
- I. Langmuir, J. Am. Chem. Soc., 1918, 40, 1361–1403 CrossRef CAS.
- S. Siva, S. Sudharsan and R. S. Kannan, RSC Adv., 2015, 5, 79665–79678 RSC.
- H. Freundlich, Z. Phys. Chem., 1907, 57U, 385–470 Search PubMed.
- M. Temkin and V. Pyzhev, Acta Physicochimica URRS, 1940, 12, 327–356 CAS.
- P. Sivakumar and P. N. Palanisamy, Int. J. Chem. Tech. Res., 2009, 1, 502–510 CAS.
- A. Denizli, K. Kesenci, Y. Arica and E. Pişkin, React. Funct. Polym., 2000, 44, 235–243 CrossRef CAS.
- R. Say, E. Birlik, Z. Erdemgil, A. Denizli and A. Ersöz, J. Hazard. Mater., 2008, 150, 560–564 CrossRef CAS.
- F. Helfferich, Ion Exchange, McGraw Hill, New York, USA, 2010, vol. 166 Search PubMed.
- S. Kushwaha and P. P. Sudhakar, Carbohydr. Polym., 2011, 86, 1055–1062 CrossRef CAS.
- S. Kushwaha, B. Sreedhar and P. Padmaja, J. Chem. Eng. Data, 2010, 55, 4691–4698 CrossRef CAS.
- B. Y. Song, Y. Eom and T. G. Lee, Appl. Surf. Sci., 2011, 257, 4754–4759 CrossRef CAS.
- T. A. Saleh, Environ. Sci. Pollut. Res., 2015, 22, 16721–16731 CrossRef CAS.
- Y. Huang, J. Tang, L. Gai, Y. Gong, H. Guan, R. He and H. Lyu, Chem. Eng. J., 2017, 319, 229–239 CrossRef CAS.
- I. Robles, A. Ramirez, E. Flórez and N. Acelas, SN Appl. Sci., 2020, 2, 1029 CrossRef.
|
| This journal is © The Royal Society of Chemistry 2021 |
Click here to see how this site uses Cookies. View our privacy policy here.  Open Access Article
 *a,
Tawfik A. Salehb and
Osama Saberc


![[double bond, length as m-dash]](https://www.rsc.org/images/entities/char_e001.gif) C aromatic from the PCF can be observed at 1450 cm−1.37 The N2 adsorption–desorption isotherm indicated a type II isotherm of PCF.38 The BET surface area was found to be 187 m2 g−1, with a pore volume of 0.19 cm3 g−1 and a pore size of 64 Å.
C aromatic from the PCF can be observed at 1450 cm−1.37 The N2 adsorption–desorption isotherm indicated a type II isotherm of PCF.38 The BET surface area was found to be 187 m2 g−1, with a pore volume of 0.19 cm3 g−1 and a pore size of 64 Å.

![[thin space (1/6-em)]](https://www.rsc.org/images/entities/char_2009.gif) qe − k1t
qe − k1t


![[thin space (1/6-em)]](https://www.rsc.org/images/entities/char_2009.gif) Ce provides the isotherm constant, as shown in Fig. 9c. The data indicates that the equilibrium-binding constant KT was equal to 32.98 L g−1, which corresponds to the maximum binding energy (Table 4).
Ce provides the isotherm constant, as shown in Fig. 9c. The data indicates that the equilibrium-binding constant KT was equal to 32.98 L g−1, which corresponds to the maximum binding energy (Table 4).


![[thin space (1/6-em)]](https://www.rsc.org/images/entities/char_2009.gif) KD against 1/T using the van't Hoff linear (eqn (12)) as shown in Fig. 10.
KD against 1/T using the van't Hoff linear (eqn (12)) as shown in Fig. 10.


