 Open Access Article
Recovery of lanthanum cations by functionalized magnetic multi-walled carbon nanotube bundles†
Lijinhong Huangab,
Lihong Liu *b,
Wanfu Huang*c,
Bingxin Zhaoc,
Zhangfeng Shend,
Yaqing Baoc and
Hussein Znadb
aSchool of Architecture and Design, Jiangxi University of Science and Technology, Ganzhou, China
bFaculty of Science and Engineering, WA School of Mines: Minerals, Energy and Chemical Engineering, Curtin University, WA, Australian. E-mail: lihong.liu@curtin.edu.au
cSchool of Resource and Environmental Engineering, Jiangxi University of Science and Technology, Ganzhou, China. E-mail: sim2008@sina.com
dCollege of Biological, Chemical Science and Engineering, Jiaxing University, China
First published on 25th January 2021
Abstract
Rare-earth elements (REE), including La, are critical raw materials in many technological advancements. Collection of physically adsorbed REEs on clay minerals can be realized first by ion-exchange leaching, followed by adsorption enrichment. Ever increasing demand and limited resources of REEs have fueled the development of nanostructured adsorbents. In this paper, multi-walled carbon nanotubes (MWCNTs) were purified using concentrated H2SO4 and HNO3, then coupled with magnetic Fe3O4 nanoparticles to make low concentration La ion extraction from water possible. The MWCNT@Fe3O4 composites were further crosslinked with 0.1 wt% epichlorohydrin and functionalized with 0.5 wt% carbon disulfide to achieve a La3+ adsorption capacity of 23.23 mg g−1. We fully probed the morphology, crystallinity, chemical composition, and magnetic properties of the as-prepared adsorbent by scanning/transmission electron microscopy, X-ray diffractometry, X-ray photoelectron spectroscopy, vibrating-sample magnetometry, and thermal gravimetry. These results indicated that the MWCNT@Fe3O4 nanohybrid may be a promising candidate for recovering La ions from aqueous solutions.
Introduction
The rare earth elements (REE) comprise a group of fifteen lanthanides of the periodic table (IIIB metals) plus scandium and yttrium. The unique chemical, electrical, magnetic, optical, and luminescent properties of REE render them essential components to high-tech and green-energy products, such as nuclear medicines, lasers, electronic displays, high strength alloys, radar, and vehicle catalytic converters.1 The extraction of REE from commercially significant bastnäsite ores involves large up-front capital investments, high energy costs and environmental risks.2 An alternative source to obtain REE is from weathered crust elution-deposited rare earth ores, also known as ion-adsorption clays.3 The clay deposits contain 0.05 to 0.2 wt% rare earths, out of which 60–90% occur as physically adsorbed species recoverable by simple ion-exchange leaching with concentrated monovalent cations.4 The free rare earth ions (RE3+) are then precipitated with oxalic acid and converted to RE oxides via 900 °C calcination. However, when RE3+ concentrations are low, the use of adsorbents for ion pre-concentrating is necessary.5 Indeed, adsorption is the most explored method due to its simplicity and wide-ranging availability for low concentration REE recovery from electronics waste, brines, and various industrial wastes.Biosorption based on a variety of biomaterials such as algae, fungi, bacteria, etc., have been proposed for the recovery of RE3+, but more efforts are needed to solve the problematic nature of biomass regeneration. Recently, bulky zeolite, clay, active carbon, and nanomaterials (NMs) have received increasing attention. Numerous non-magnetic SiO2, TiO2 and carbon based NMs have been reported for this type of application.6 In particular, the large surface areas, high porosity, hollow and layered structures have made multi-walled carbon nanotubes (MWCNTs) an ideal adsorption material. On the one hand, the high adsorption capacity of MWCNTs stems from the large specific surface area, hence having more active or binding sites. On the other hand, the sorption of RE3+ is primarily controlled by electrostatic forces, which are associated with negatively charged surface function groups.7 Oxidized MWCNTs and graphene oxides have emerged as excellent metal ion adsorbents due to possessing many oxygen donor groups (e.g. hydroxyl, carbonyl and carboxyl) on their surfaces.8,9
The sorption performance of MWCNTs relies on their homogeneous dispersion. It is a challenge to remove the suspended MWCNTs from the aquatic phase. Experiments have been conducted to explore the use of magnetism as an effective means of separating the spent adsorbents. Magnetite (Fe3O4) and maghemite (γ-Fe2O3) are commonly incorporated with MWCNTs for adsorption removal of Cr6+, Pb2+, Mn2+, Cu2+ and organic cationic dyes.10–13 However, few studies on the interaction between RE3+ and magnetic MWCNTs has been reported which serves as the primary motivation of this work.
The overall objective of this research is to modify MWCNT to become a magnetically retrievable adsorbent that can efficiently recover REEs. Firstly, an attempt has been made to purify and oxidize MWCNT to overcome the hydrophobicity issue by the introduction of hydroxyl and carboxyl groups. Polyvinyl alcohol was employed to assemble MWCNT@Fe3O4. Upon the surface treatment, epichlorohydrin (ECH) was used to cross-link the CNTs through reaction with –OH. There are sparse studies regarding the use of magnetic MWCNTs–ECH hybrids for the removal of La3+. It was expected that the 3D structure formation can enhance the mechanical strength of the adsorbent in harsh acid solution. Functionalized CNTs-based nanomaterials have exhibited an enhanced performance for energy-related oxygen evolution reaction and water oxidation.14–16 In this study, MWCNT@Fe3O4 with CS2 was constructed based on the innate affinity of S2− for metal ions.17 The ability of the as-prepared adsorbent to recover La3+ was evaluated under a range of ECH and CS2 weight ratios. Effective La3+ sorption was accomplished with 0.1 wt% ECH and 0.5 wt% carbon disulfide.
Experimental section
Materials and chemicals
Pristine multi-walled carbon nanotubes (MWCNTs) and Fe3O4 nanoparticles were purchased from Shenzhen Nanoport Co., Ltd. and Aladdin, respectively. Concentrated sulfuric acid/nitric acid and absolute ethyl alcohol were purchased from Xilong Science Co., Ltd. Polyvinyl alcohol (PVA-1788) and epichlorohydrin (ECH) were obtained from Shanghai McLean Biochemical Co. Ltd. Analytical grade sodium hydroxide and carbon disulfide were procured from Sinopharm Chemical Reagent Co., Ltd. All the products were used as received.Modification and functionalization of multi-walled carbon nanotubes
To remove carbonaceous and metallic impurities, at room temperature, 6 g of MWCNTs were ultrasonically treated in a mixture of 180 mL concentrated sulphuric acid (98%) and 60 mL concentrated nitric acid (70%) for 35 min followed by refluxing under 500 rpm magnetic stirring at 80 °C for 3 h. The suspension was settled for 12 h then diluted with 1.92 L DI water. After 10 h settlement, the supernatant fluid was decanted off and the precipitate was washed with DI water for several times to reach neutral pH. After ethanol washing 4 more times, the product was vacuum dried at 80 °C for 12 h.The magnetic Fe3O4 NPs were embedded within MWCNT bundles that were crosslinked by ECH. Briefly, 1 g of purified MWCNT in 30 mL absolute ethanol was ultrasonically treated for 1 h. At the same time, 1 g of PVA in 30 mL ultrapure water was magnetically stirred at 500 rpm for 1 h at room temperature then mixed with the MWCNT suspension slowly. After that, 1 g of Fe3O4 powder was added and the mixture was magnetically stirred for 3 h to obtain a homogenous suspension. 0.1 M NaOH (6 mL) was slowly injected into the mixture to ionize the MWCNT hydroxyl groups. After 12 h settlement, the precipitate was washed with ultrapure water till reaching neutral pH. To crosslink the MWCNT thus embedding Fe3O4 NPs within the MWCNT matrix, 100 mL ECH with various concentrations were mixed with the assembled MWCNT@Fe3O4 composites and then stirred for 4 h at room temperature. After decantation, the precipitate was washed with ultrapure water then dried in −0.1 MPa at 70 °C for 12 h.
To functionalize MWCNT@Fe3O4 with S motif, 100 mL CS2 with different concentrations were mixed with 1 g MWCNT@Fe3O4 in water. After 12 h stirring at 400 rpm, the precipitate was collected by decantation and washed with ultrapure water several times then dried in −0.1 MPa at 70 °C for 12 h.
Orthogonal array (OA) design for optimizing concentrations of ECH and CS2
In this study, ECH and CS2 concentrations were two identified factors to have large effects on the adsorption capacity of MWCNT@Fe3O4. We first determined ECH concentration (factor A, from 0.05 to 10%) influence by fixing CS2 concentration at 0.5%. Secondly, we evaluated CS2 concentration (factor B, from 0.1 to 2%) influence by fixing ECH concentration at 0.1%. Based on these preliminary results, in order to realize prompt evaluation of optimal concentrations of ECH and CS2 for the maximum La3+ adsorption, a Taguchi OA9 (32) matrix, which is an orthogonal array of two factors and 3 levels, was then employed to design experimental conditions as shown in Table 1.| ECH concentration (A, wt%) | CS2 concentration (B, wt%) | |
|---|---|---|
| Level 1 | 0.1 | 0.1 |
| Level 2 | 1.0 | 0.5 |
| Level 3 | 5.0 | 1.0 |
Nine trials were conducted as per the level combinations. Optimal conditions were obtained after the experiments and data analysis, including range analysis and analysis of variance.
Materials characterizations
The morphology of the prepared samples was observed by scanning electron microscopy (SEM, Quanta FEG 250). The crystal structure of the composites was characterized by powder X-ray diffraction (XRD, X'Pert Pro MPD) using Cu-Kα radiation (λ = 0.15404 nm). The data was collected under a continuous scan mode between 10 and 90° with a step size of 0.02° and a scan rate of 2° min−1. The current and voltage were set at 30 mA and 40 kV, respectively. The Brunauer–Emmett–Teller (BET) specific surface areas of as-prepared samples were measured by N2 adsorption–desorption isotherm with a Quantachrome NOVA touch LX4 apparatus (Quantachrome Autosorb-IQ, USA). The chemical compositions and bonds were studied by X-ray photoelectron spectroscopy (XPS, ESCALAB 250Xi K-alpha, Thermo Fisher Scientific) with Al Kα X-ray at 15 kV and 150 W. Fourier transform infrared (FTIR) spectra were measured by using a VERTEX70 spectrometer. Thermogravimetric analysis (TGA; Mettler-Toledo) was performed using a simultaneous differential thermal analysis (DTA). A heating rate of 5 °C min−1 was used from room temperature to 900 °C under atmospheric air. Vibrating sample magnetometer (VSM) (Model: Lake shore 7400, United States) was employed to study the hysteresis loops and the magnetic properties of the magnetite nanocomposites.La3+ adsorption and reusability tests
The batch adsorption of La3+ was evaluated by continuously stirring the samples (200 mg modified MWCNT@Fe3O4 with 50 mL of 100 mg L−1 La(NO3)3 solution) at 150 rpm in a thermostatic shaker, at 25 ± 2 °C for 12 h. The initial pH was 5. After the completion of adsorption, the solutions were centrifuged, and the residual concentration of La3+ in the supernatant was detected on a Perkin Optima 8300 inductively coupled plasma-optical emission spectrometry (ICP-OES).To investigate the reusability, sequential adsorption–desorption experiments in batch mode were carried out for three cycles. The adsorbents loaded with La3+ were placed in 2 mol L−1 H2SO4 and vibrated for 60 min. The La3+ concentration in the aqueous phase and stripping acid were determined using ICP-OES.
Results and discussion
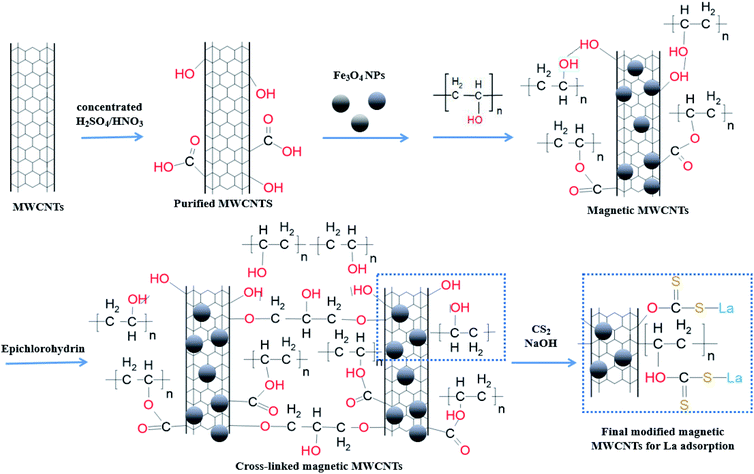
As depicted in Scheme 1, firstly, MWCNTs were purified by concentrated HNO3/H2SO4. MWCNT@Fe3O4 composites were then prepared via surface deposition and epichlorohydrin (ECH) cross-linking process. Finally, CS2 molecules were introduced to add S motif for enhanced metal ion adsorption. We systemically investigated the influence of ECH and CS2 concentrations in the following sections.Effect of epichlorohydrin (ECH) concentration on La3+ sorption
Epichlorohydrin (ECH) reacts with –OH groups on the surface of carbon nanotubes to form a three-dimensional network through ether bonds.18 It is well documented such chemical crosslink can enhance the mechanical strength and maintain the adsorption performance in harsh acidic solution. Fig. 1 shows the effect of ECH concentration on the extent of sorption of La3+. An increase in the cross-linker concentration from 0.05 to 1% led to an improved La3+ uptake, which may be correlated to the extra pores formed among MWCNT bundles. However, the uptake of La3+ declined when ECH concentration increased from 5 to 8%, implying that steric effects likely play a role due to excessive cross-linking. When 10% ECH was used, La3+ adsorption increased a bit but still lower than the 1% ECH cross-linked MWCNT@Fe3O4. This may occur due to self-crosslinking of the hydroxyl group of ECH at the C2 position and/or hydrolysis of ECH under alkaline condition.19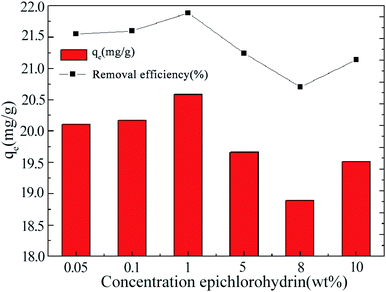 | ||
| Fig. 1 La(III) adsorbed by functionalized MWCNT@Fe3O4 with variable epichlorohydrin (ECH) concentrations, [CS2] = 0.5 wt%. | ||
Effect of CS2 concentration on La3+ sorption
Sulfur-doped carbon materials have been extensively explored in metal adsorption due to the soft acid–soft base interactions between metal ions and sulfur functionalities. For example, Saha has investigated aqueous phase adsorption of Hg, Pb, Cd, and Ni ions by sulfur-functionalized ordered mesoporous carbons.20 Besides physisorption in the pores of the parent carbon, sulfur is hypothesized to increase surface polarity and enhance negative charge on the sorbent materials to attract the metal cations.Effect of CS2 concentration on La3+ adsorption by modified MWCNTs was investigated at fixed ECH concentration of 0.1 wt% (Fig. 2). Sorption of La3+ increased with increase in CS2 concentration from 0.1 wt% to 0.5 wt%, as more thiol groups for S–La3+ complex were formed on carbon surface after reaction with OH groups (Scheme 1). When the concentration of CS2 reached to 1.0 wt%, OH groups were already consumed and most of CS2 molecules were physically tangled with MWCNTs, therefore reducing the adsorption effect. The final composite functionalized with 0.5 wt% CS2 exhibited ideal La3+ adsorption at 23.23 mg g−1.
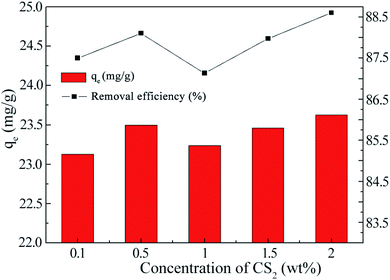 | ||
| Fig. 2 La(III) adsorbed by functionalized MWCNT@Fe3O4 with variable CS2 concentrations, [ECH] = 0.1 wt%. | ||
Optimization of ECH and CS2 concentrations by Taguchi approach
According to the OA9 matrix, nine experiments were performed, and their adsorption results were shown in Table 2.For range analysis, we first calculated Kji and  . Kji is the sum of the evaluation indexes of all levels (i, i = 1, 2, 3) in each factor (j, j = A, B).
  is the mean value of Kji. For example, K1A = 56.82 + 65.98 + 63.79 = 186.59.
  . For each factor j, a higher
  means the level i has a larger effect on La3+ sorption. Rj is defined as the range between the maximum and minimum value of
  and is used for deciding the impact of the factors.21 It can be seen that RA(3.31) < RB(3.71), therefore the concentration of CS2 is the main influencing factor. The highest adsorption of La3+ for each level was determined as A3B2. In Fig. 2, when [CS2] = 0.5 wt%, the La3+ adsorption amount of 0.1% ECH modified composite was much higher than that of 5% ECH modified one. A1B2 was thus selected as the optimal combination and La3+ removal rate and adsorption capacity were 65.98% and 13.20 mg g−1, respectively.
In order to comprehensively evaluate the differences among the mean values and to obtain the magnitudes of the factor affecting the index, the analysis of variance (ANOVA) of La3+ removal was investigated and the calculated results are presented in Table 3. The sum of square deviation was calculated by the follow expression:
| SSi = 3((M1i − M)2 + (M2i − M)2 + (M3i − M)2) |
| (i = A, B) |
| Sum of square deviation | Degrees of freedom | Mean square | F value | F, threshold value (0.1) | F, threshold value (0.05) | F, threshold value (0.01) | ||
|---|---|---|---|---|---|---|---|---|
| La3+ adsorption | A | 18.47 | 2 | 9.24 | 0.75 | 4.32 | 6.94 | 18.00 |
| B | 25.91 | 2 | 12.96 | 1.06 | 4.32 | 6.94 | 18.00 | |
| Error | 67.55 | 6 | 11.26 | — | — | — | — | |
| Sum | 93.47 | 8 | — | — | — | — | — | |
The number of levels (3) subtracted 1 gave the degree of freedom 2 (DOF).22 Sum of square deviation divided by DOF produced mean square (Mi). F value is defined as the ratio of the sum of the square of each factor's mean deviations to that of the experimental error. The significance of each factor is judged according to the F-distribution critical value table. F0.01< Fα indicates that the influence of this factor is highly significant; F0.05 < Fα < F0.01, F0.1 < Fα < F0.05, and Fα < F0.1 means the factor has significant, certain effect and no significant effect, respectively. As can be seen from the Table 3, both the ECH and CS2 concentrations have no significant effect on the La3+ adsorption capacity. Further improvement in accuracy indicates that the F value of the CS2 concentration has increased, but the effect is still not significant. On the other hand, the CS2 concentration has certain effect on the adsorption performance, which is consistent with the results in Table 2.
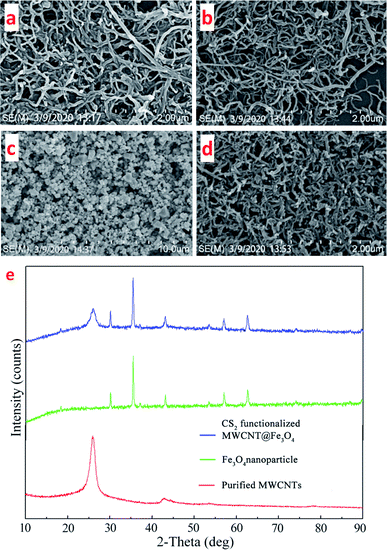
Morphologies, structures, and textural properties of samples
The morphologies of original MWCNTs, purified MWCNTs, Fe3O4 nanocrystals and the final Fe3O4@MWCNTs composites were observed by SEM (Fig. 3a–d). Relatively long and tangled MWCNTs became short and well dispersed after acid treatment. The coarsened tube walls suggest more adsorption sites are available. Fe3O4 cubic shaped magnetic nanoparticles with size around 3 nm were attached and embedded in the nanocomposites.Fig. 3e shows the X-ray diffraction patterns of the purified multi-walled carbon nanotubes, Fe3O4 nanoparticles and the CS2 functionalized MWCNT@Fe3O4 nanocomposites. For MWCNs, a strong graphite (002) characteristic diffraction peak corresponding to a d-spacing between graphene sheets of 3.42–3.46 Å was observed at around 25.84°. The weak (100) peak at 2θ ≈ 42.68° related to the in-plane graphitic structure of MWCNs.23 These results indicate that the structure of the MWCNTs was intact after pretreatment by concentrated acids. For Fe3O4, six major diffraction peaks at 2θ = 18.32°, 31.49°, 35.34°, 44.76°, 58.13°, and 64.24° (marked by their indices d(1 1 1), d(2 2 0), d(3 1 1), d(4 0 0), d(5 1 1) and d(4 4 0)) could be indexed to the pure cubic spinel phase of Fe3O4 (JCPDF card no. 19-0629).24 Both characteristic peaks of MWCNT and main peaks of Fe3O4 were present, suggesting the successful embedding of Fe3O4 into MWCNT bundles.
Thermogravimetric analysis
The thermogravimetric (TG) curves recorded for pristine MWCNTs, oxidized MWCNTs, and MWCNTs@Fe3O4 hybrid are shown in Fig. 4. The curves were measured from room temperature to 900 °C in air at heating rate of 5 °C min−1. All samples showed <1% weight loss when the temperature was lower than 150 °C, attributing to the evolution of physically adsorbed water molecules.25 For pristine MWCNT, differential weight loss curves showed three peaks T1,max at 178.8 °C, T2,max at 477.4 °C and T3,max of 868.6 °C. The DTG peak at 477.4 °C is attributed to the oxidation of disordered or amorphous carbons. At temperatures higher than 500 °C, the observed decomposition corresponds to the thermal oxidation of the remaining disordered carbon.26 After acid treatment, the sample continuously lost 12.08% weight, due to the elimination of carboxylic and hydroxyl functional groups that attached to the MWCNT walls.27,28 The thermal degradation of the final hybrid is a four-stage process. There is a 6.03 wt% loss at the second stage ∼200–300 °C and a 7.17 wt% loss at the fourth stage ∼800–900 °C. The former was attributed to the oxidation of the PVA and ECH while the later accounted for the degradation of CS2 and Fe3O4.29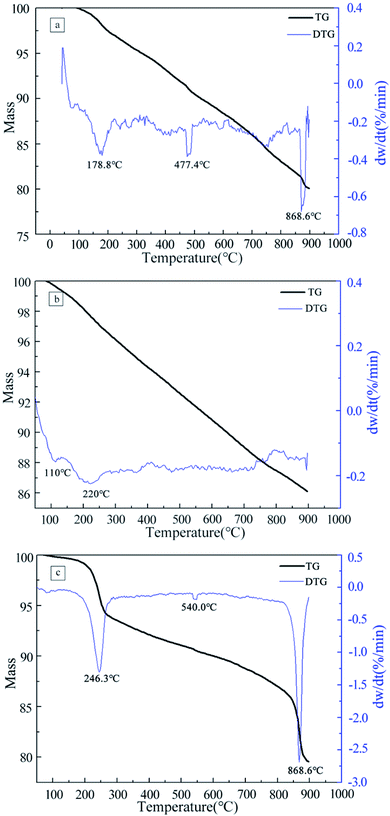 | ||
| Fig. 4 TGA curves of the pristine MWCNTs (a), acid treated MWCNTs (b) and CS2 functionalized MWCNTs@Fe3O4 (c). | ||
BET analysis
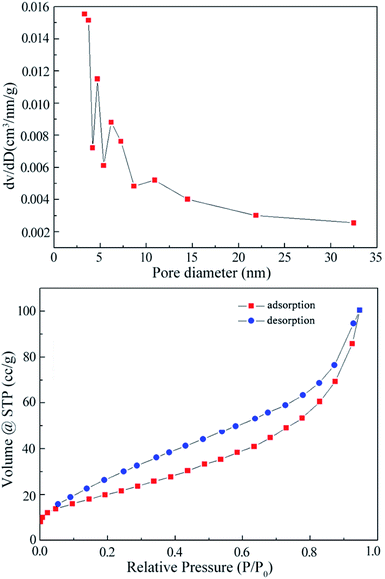
To give further insight into the textural properties of the functionalized MWCNT@Fe3O4, the BET surface area and pore volume were calculated using the Barrett–Joyner–Halenda (BJH) method as 77.39 m2 g−1 and 0.1554 cm3 g−1, respectively. The specific surface area is in the lower part of reported carbon nanotube materials, which could be explained by three factors: (1) functional groups block pore entrances; (2) bundling of nanotubes via ECH, (3) MWCNTs were partially covered with Fe3O4 NPs.30,31 Moreover, the N2 absorption/desorption curve at 77 K in Fig. 5 reveals a typical IV isotherm with a large H3 hysteresis loop.32 The hysteresis phenomenon is usually associated with capillary condensation in mesoporous structures.33 Thus, slit-shaped pores are expected in these samples. The pore size distribution has a relatively wide range of 3.3 to 7.2 nm, corresponding well with the hysteresis observation.Fourier transform infrared (FT-IR) analysis
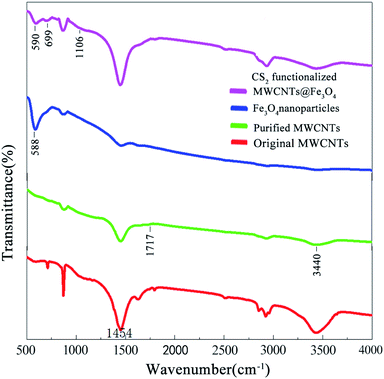
FT-IR characterization was performed to identify the surface functional groups. The pristine MWCNTs exhibited two major peaks at 880 and 1454 cm−1, which could be associated with the amorphous carbon and E1u (1590 cm−1) IR-active modes of graphitic C![[double bond, length as m-dash]](https://www.rsc.org/images/entities/char_e001.gif) C, respectively.34,35 As a result of acid purification, the intensity of 880 cm−1 band is significantly decreased. Meanwhile, the –OH band at 3444 cm−1 and the carboxyl band at 1717 cm−1 confirm the presence of hydrophilic moieties at the carbon tube surface.36 These polar functional groups not only provide numerous ion sorption sites, but also improve the dispersity of MWCNTs in aqueous solution. The characteristic peak of pure Fe3O4 NPs was observed at 588 cm−1. After mixing with MWCNTs and crosslinking by ECH, the upshifted adsorption band at 590 cm−1 corresponds to the stretching vibration of Fe–O–Fe was revealed, confirming that Fe3O4 NPs were loaded onto the surface of MWCNTs through ECH coordination.37 The successful CS2 functionalization of MWCNT@Fe3O4 is ascertained by two peaks located at 699 cm−1 and 1106 cm−1, corresponding to the C–S and C
C, respectively.34,35 As a result of acid purification, the intensity of 880 cm−1 band is significantly decreased. Meanwhile, the –OH band at 3444 cm−1 and the carboxyl band at 1717 cm−1 confirm the presence of hydrophilic moieties at the carbon tube surface.36 These polar functional groups not only provide numerous ion sorption sites, but also improve the dispersity of MWCNTs in aqueous solution. The characteristic peak of pure Fe3O4 NPs was observed at 588 cm−1. After mixing with MWCNTs and crosslinking by ECH, the upshifted adsorption band at 590 cm−1 corresponds to the stretching vibration of Fe–O–Fe was revealed, confirming that Fe3O4 NPs were loaded onto the surface of MWCNTs through ECH coordination.37 The successful CS2 functionalization of MWCNT@Fe3O4 is ascertained by two peaks located at 699 cm−1 and 1106 cm−1, corresponding to the C–S and C![[double bond, length as m-dash]](https://www.rsc.org/images/entities/char_e001.gif) S vibrations,38 respectively (Fig. 6).
S vibrations,38 respectively (Fig. 6).
Surface study by X-ray photoelectron spectroscopy
To aid the interpretation, the nanocomposites were investigated by X-ray photoelectron spectroscopy (XPS) to characterize the nature of the ECH crosslinked MWCNTs and to verify the CS2 functionalization on the composition of Fe3O4@MWCNT. The survey XPS spectra (Fig. 7a) show S, C, O, and Fe at the surface. The high resolution C 1s spectrum (Fig. 7b) shows two carbon peaks at 284.8 and 286.1 eV, respectively, indicating the presence of C![[double bond, length as m-dash]](https://www.rsc.org/images/entities/char_e001.gif) C and C
C and C![[double bond, length as m-dash]](https://www.rsc.org/images/entities/char_e001.gif) O.39 The O 1s spectrum of the thiol-modified magnetic carbon nanotubes can be successfully fit to three main peaks (Fig. 7c), which are located at the binding energies of 530.2, 532.2, and 533.5 eV, corresponding to C–O, C–OH and C
O.39 The O 1s spectrum of the thiol-modified magnetic carbon nanotubes can be successfully fit to three main peaks (Fig. 7c), which are located at the binding energies of 530.2, 532.2, and 533.5 eV, corresponding to C–O, C–OH and C![[double bond, length as m-dash]](https://www.rsc.org/images/entities/char_e001.gif) O–OH in the carboxyl group.40 The introduction of these oxygen-containing functional groups on the surface of the carbon nanotubes is expected to improve the dispensability. The Fe 2p core level spectrum (Fig. 7d) shows two binding energies at 711.3 and 724.7 eV, which can be assigned to Fe 2p3/2 and Fe 2p1/2 components. These values correlate well with those of bulk Fe3O4.41,42 Fig. 7e exhibits two S 2p peaks at 164.8 eV and 168.5 eV, corresponding to the C–S and S
O–OH in the carboxyl group.40 The introduction of these oxygen-containing functional groups on the surface of the carbon nanotubes is expected to improve the dispensability. The Fe 2p core level spectrum (Fig. 7d) shows two binding energies at 711.3 and 724.7 eV, which can be assigned to Fe 2p3/2 and Fe 2p1/2 components. These values correlate well with those of bulk Fe3O4.41,42 Fig. 7e exhibits two S 2p peaks at 164.8 eV and 168.5 eV, corresponding to the C–S and S![[double bond, length as m-dash]](https://www.rsc.org/images/entities/char_e001.gif) O bonds, further confirming the presence of thiol groups on the surface of composites.43,44
O bonds, further confirming the presence of thiol groups on the surface of composites.43,44
Previous studies have confirmed that the pore size distribution and surface functional groups are important factors that determine the REE adsorption performance of nano-carbons. In this study, as revealed by the BET, FTIR and XPS characterizations, the mesoporous structure and the presence of carboxyl and S groups contributed to the La3+ adsorption.
VSM analysis
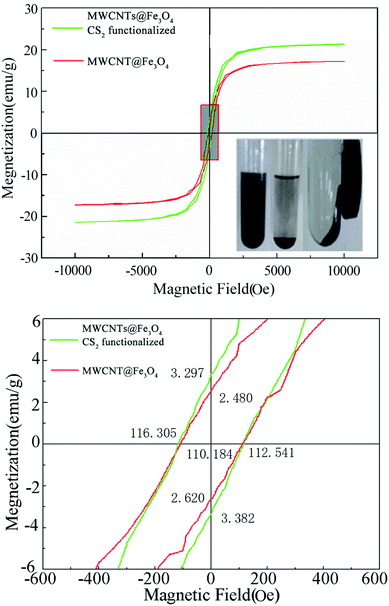
Magnetization curves of MWCNT@Fe3O4 before and after CS2 modification are presented in Fig. 8. CS2 modification decreased both the saturation magnetization (Ms) from 21.37 to 17.22 and the remanence (Mr) from 3.34 to 2.55 emu g−1. The coercivity was decreased from 114.42 to 111.36 Oe. The magnetic separation feasibility of final MWCNT@Fe3O4 was tested by placing a magnet near a test tube containing the nanohybrids. As shown in the inset, the samples can easily be dispersed in water and an external magnet can attract them for later removal. The data illustrates that the magnetite nanoparticles, tethered on the surface of the MWCNTs give the adsorbent a magnetic response.The sequential adsorption–desorption cycles showed that MWCNT@Fe3O4 had acceptable reusability. As shown in Table S1,† after two acid elution processes, the adsorption capacity of La3+ dropped slightly from 23.23 to 19.32 mg g−1. The adsorbents maintained similar XRD patterns. FTIR spectra indicated the existence of carboxyl, Fe–O–Fe, C–S and C![[double bond, length as m-dash]](https://www.rsc.org/images/entities/char_e001.gif) S groups. The decrease of adsorption efficiency can be mainly attributed to a progressive saturation of the adsorbent active sites by La3+ as well as negative impact on material integrity due to extreme pH levels.
S groups. The decrease of adsorption efficiency can be mainly attributed to a progressive saturation of the adsorbent active sites by La3+ as well as negative impact on material integrity due to extreme pH levels.
Conclusions
In this study, uniform Fe3O4 nanoparticles were embedded into multi-wall carbon nanotube (MWCNT) bundles via a facile epichlorohydrin (ECH) cross-linking process. The nanocomposites were further functionalized by CS2 as a reusable magnetic adsorbent for enhanced rare earth La3+ adsorption in aqueous media. The maximum adsorption capacity was found to vary with ECH and CS2 concentrations. The best concentration combination for favourable La3+ adsorption was determined by orthogonal array analysis and experimental results. Different characteristics of the final absorbent are explored through FESEM, XRD, TGA, BET, FTIR, XPS, and VSM methods. This retrievable nano adsorbent has exhibited suitable efficiency in La3+ recovery and made the process highly valuable from environmental perspective.Funding
This work was supported by National Natural Science Foundation of China (Number: 41662004 and 41362003).Conflicts of interest
There are no conflicts to declare.Acknowledgements
Funding was provided by the National Natural Science Foundation in China. The authors are grateful to the Faculty of Science and Engineering, WA School of Mines, Curtin University in Australian and the Jiangxi University of Science and Technology in China.References
- G. Charalampides, K. I. Vatalis, B. Apostoplos and B. Ploutarch-Nikolas, Procedia Economics and Finance, 2015, 24, 126–135 CrossRef.
- J. C. Callura, K. M. Perkins, C. W. Noack, N. R. Washburn, D. A. Dzombak and A. K. Karamalidis, Green Chem., 2018, 20(7), 1515–1526 RSC.
- X. J. Yang, A. Lin, X. L. Li, Y. Wu, W. Zhou and Z. Chen, Environ. Dev., 2013, 8, 131–136 CrossRef.
- G. A. Moldoveanu and V. G. Papangelakis, Hydrometallurgy, 2012, 117, 71–78 CrossRef.
- T. Kegl, A. Košak, A. Lobnik, Z. Novak, A. K. Kralj and I. Ban, J. Hazard. Mater., 2020, 386, 121632 CrossRef CAS.
- D. Dupont, W. Brullot, M. Bloemen, T. Verbiest and K. Binnemans, ACS Appl. Mater. Interfaces, 2014, 6, 4980–4988 CrossRef CAS.
- C. E. Cardoso, J. C. Almeida, C. B. Lopes, T. Trindade, C. Vale and E. Pereira, Nanomaterials, 2019, 9, 814 CrossRef CAS.
- S. M. A. Koochaki-Mohammadpour, M. Torab-Mostaedi, A. Talebizadeh-Rafsanjani and F. Naderi-Behdani, J. Dispersion Sci. Technol., 2014, 35, 244–254 CrossRef CAS.
- X. Xu, J. Zou, X. R. Zhao, X. Y. Jiang, F. P. Jiao, J. G. Yu and J. Teng, Colloids Surf., A, 2019, 570, 127–140 CrossRef CAS.
- Z. N. Huang, X. L. Wang and D. S. Yang, Water Sci. Eng., 2015, 8, 226–232 CrossRef.
- G. D. Tarigh and F. Shemirani, Talanta, 2013, 115, 744–750 CrossRef.
- W. W. Tang, G. M. Zeng, J. L. Gong, Y. Liu, X. Y. Wang, Y. Y. Liu and D. Z. Tu, Chem. Eng. J., 2012, 211, 470–478 CrossRef.
- J. L. Gong, B. Wang, G. M. Zeng, C. P. Yang, C. G. Niu, Q. Y. Niu and Y. Liang, J. Hazard. Mater., 2009, 164, 1517–1522 CrossRef CAS.
- X. Wang, Z. J. Ma, L. L. Chai, L. Q. Xu, Z. Y. Zhu, Y. Hu, J. J. Qian and S. M. Huang, Carbon, 2019, 141, 643–651 CrossRef CAS.
- T. T. Li, J. J. Qian, Q. Q. Zhou, J. L. Lin and Y. Q. Zheng, Dalton Trans., 2017, 46, 13020 RSC.
- X. Wang, A. Dong, Z. Y. Zhu, L. L. Chai, J. Y. Ding, L. Zhong, T. T. Li, Y. Hu, J. J. Qian and S. M. Huang, Small, 2020, 16, 2004614 CrossRef CAS.
- M. J. Manos and M. G. Kanatzidis, Chem. Sci., 2016, 7, 4804–4824 RSC.
- L. Dehabadi and L. D. Wilson, Carbohydr. Polym., 2014, 113, 471–479 CrossRef CAS.
- I. A. Udoetok, R. M. Dimmick, L. D. Wilson and J. V. Headley, Carbohydr. Polym., 2016, 136, 329–340 CrossRef CAS.
- D. Saha, S. Barakat, S. E. Van Bramer, K. A. Nelson, D. K. Hensley and J. Chen, ACS Appl. Mater. Interfaces, 2016, 8, 34132–34142 CrossRef CAS.
- X. Wu and D. Y. Leung, Appl. Energy, 2011, 88, 3615–3624 CrossRef CAS.
- J. Luo, G. Zhu, F. Zhang, Q. Li, T. Zhao and X. Zhu, RSC Adv., 2015, 5, 6071–6078 RSC.
- Y. Li, X. B. Zhang, X. Y. Tao, J. M. Xu, W. Z. Huang, J. H. Luo and H. J. Geise, Carbon, 2005, 43, 295–301 CrossRef CAS.
- L. Cui, H. Huang, P. Ding, S. Zhu, W. Jing and X. Gu, Sep. Purif. Technol., 2020, 237, 116380 CrossRef CAS.
- V. Datsyuk, M. Kalyva, K. Papagelis, J. Parthenios, D. Tasis, A. Siokou and C. Galiotis, Carbon, 2008, 46, 833–840 CrossRef CAS.
- P. Hou, C. Liu, Y. Tong, S. Xu, M. Liu and H. Cheng, J. Mater. Res., 2001, 16, 2526–2529 CrossRef CAS.
- M. Tang, H. Dou and K. Sun, Polymer, 2006, 47, 728–734 CrossRef CAS.
- S. Grandi, A. Magistris, P. Mustarelli, E. Quartarone, C. Tomasi and L. Meda, J. Non-Cryst. Solids, 2006, 352, 273–280 CrossRef CAS.
- S. H. Chaki, T. J. Malek, M. D. Chaudhary, J. P. Tailor and M. P. Deshpande, Adv. Nat. Sci.: Nanosci. Nanotechnol., 2015, 6, 035009 Search PubMed.
- A. Peigney, C. Laurent, E. Flahaut, R. R. Bacsa and A. Rousset, Carbon, 2001, 39, 507–514 CrossRef CAS.
- M. E. Birch, T. A. Ruda-Eberenz, M. Chai, R. Andrews and R. L. Hatfield, Ann. Occup. Hyg., 2013, 57, 1148–1166 CAS.
- N. Yan, X. Zhou, Y. Li, F. Wang, H. Zhong, H. Wang and Q. Chen, Sci. Rep., 2013, 3, 16 Search PubMed.
- A. A. Farghali, H. A. Tawab, S. A. Moaty and R. Khaled, J. Nanostruct. Chem., 2017, 7, 101–111 CrossRef CAS.
- J. L. Bantignies, J. L. Sauvajol, A. Rahmani and E. Flahaut, Phys. Rev. B: Condens. Matter Mater. Phys., 2006, 74, 195425 CrossRef.
- U. J. Kim, X. M. Liu, C. A. Furtado, G. Chen, R. Saito, J. Jiang and P. C. Eklund, Phys. Rev. Lett., 2005, 95, 157402 CrossRef CAS.
- L. Stobinski, B. Lesiak, L. Kövér, J. Tóth, S. Biniak, G. Trykowski and J. Judek, J. Alloys Compd., 2010, 501, 77–84 CrossRef CAS.
- M. Moazzen, A. M. Khaneghah, N. Shariatifar, M. Ahmadloo, I. Eş, A. N. Baghani and N. Rastkari, Arabian J. Chem., 2019, 12, 476–488 CrossRef CAS.
- C. N. R. Rao, R. Venkataraghavan and T. R. Kasturi, Can. J. Chem., 1964, 42, 36–42 CrossRef CAS.
- D. L. Ramasamy, V. Puhakka, B. Doshi, S. Iftekhar and M. Sillanpää, Chem. Eng. J., 2019, 365, 291–304 CrossRef CAS.
- J. V. Rojas, M. Toro-Gonzalez, M. C. Molina-Higgins and C. E. Castano, Mater. Sci. Eng., B, 2016, 205, 28–35 CrossRef CAS.
- H. Veisi, S. Najafi and S. Hemmati, Int. J. Biol. Macromol., 2018, 113, 186–194 CrossRef CAS.
- Y. Chu, X. Tan, Z. Shen, P. Liu, N. Han, J. Kang and S. Liu, J. Hazard. Mater., 2018, 356, 53–60 CrossRef CAS.
- A. A. Razzaq, Y. Yao, R. Shah, P. Qi, L. Miao, M. Chen and Z. Deng, Energy Storage Mater., 2019, 16, 194–202 CrossRef.
- I. Menapace, W. Yiming and E. A. Masad, Advances in Materials and Pavement Performance Prediction, Taylor & Francis Group, London, 2018, p. 431, ISBN 978-1-138-31309-5 Search PubMed.
Footnote |
| † Electronic supplementary information (ESI) available. See DOI: 10.1039/d0ra09902c |
| This journal is © The Royal Society of Chemistry 2021 |

