 Open Access Article
The effect of pH and transition metal ions on cysteine-assisted gold aggregation for a distinct colorimetric response†
Trang Thi Thuy Nguyena,
Olivia A. Hanb,
Eun Bi Lima,
Seungjoo Haam c,
Joon-Seo Park*b and
Sang-Wha Lee
 *a
*a
aDepartment of Chemical and Biological Engineering, Gachon University, 1342 Seongnamdaero, Sujeong-gu, Seongnam-si, Gyeonggi-do 13120, Republic of Korea. E-mail: lswha@gc.gachon.ac.kr
bDepartment of Chemistry, Eastern University, 1300 Eagle Road, St. Davids, PA 19087-3696, USA. E-mail: jpark6@eastern.edu
cDepartment of Chemical and Biomolecular Engineering, Yonsei University, 50 Yonsei-ro, Seodaemun-gu, Seoul 03722, Republic of Korea
First published on 5th March 2021
Abstract
Colorimetric detection is a promising sensing strategy that is applicable to qualitative and quantitative determination of an analyte by monitoring visually detectable color changes with the naked eye. This study explored the cysteine (Cys)-induced aggregation of gold nanoparticles (AuNPs) in order to develop a sensitive colorimetric detection method for Cys. For this purpose, we systematically investigated the colorimetric response of AuNPs to Cys with varying particle sizes and concentrations. The AuNPs with various diameters ranging from 26.5 nm to 58.2 nm were synthesized by the citrate reduction method. When dispersed in water to have the same surface area per unit volume, the smaller AuNPs (26.5 nm) exhibited a more sensitive response to Cys compared to a larger counterpart (46.3 nm). We also examined the effect of divalent first-row transition metal ions (Mn2+, Fe2+, Co2+, Ni2+, Cu2+, and Zn2+) on the Cys-induced aggregation of AuNPs. Among the tested metal ions, the addition of Cu2+ provided the highest enhancement in sensitivity to Cys regardless of pH between 3.5 and 7. The significant increase in the sensitivity caused by Cu2+ could be attributed to the capability of Cu2+ to form a highly stable chelate complex with surface-immobilized Cys, facilitating the aggregation of AuNPs. For the AuNPs–Cu2+ system at pH 7, the detection limit for Cys was determined to be 5 nM using UV-vis spectroscopy. The reported strategy showed the potential to be used for a rapid and sensitive detection of Cys and also metal ions that can facilitate Cys-mediated aggregation of AuNPs.
1. Introduction
Colorimetric detection using plasmonic nanoparticles (NPs) is one of the promising sensing strategies for the real-time monitoring of chemical and biological analytes by the naked eye without help from sophisticated instrumentation.1–3 Especially, gold and silver NPs (AuNPs and AgNPs) have attracted considerable attention due to their unique optical properties to be used as chemical and biological sensors.4,5 For example, the aggregation of AgNPs has been used to detect dopamine (DA) molecules because the catechol group of DA attaches to the surface of AgNPs via chemisorption-type interactions, resulting in the color change of AgNPs solution from yellow to pale red (or brown).4 A number of examples using AuNPs for colorimetric detection also can be found for various chemical and biological analytes.6–10 Recently, the AuNPs-based colorimetric methods have been actively developed to detect harmful substances such as lead(II) ion, cartap pesticide, and melamine in a low concentration range.11–14 Mercury is one of the most toxic heavy metals and the rapid detection of mercury is required for safety assurance. For this purpose, AuNPs capped with hydrophilic (11-mercaptoundecyl)-trimethylammonium (MTA) have been used to develop an efficient method for detecting mercuric ion (Hg2+). In the absence of Hg2+, MTA acted as a stabilizing agent for AuNPs, but the addition of Hg2+ led to the detachment of MTA from the surface with a consequent formation of MTA–Hg2+ complex via thiol group binding. As a result, MTA-free AuNPs tended to aggregate and the dispersion color turned from red to blue.5Cysteine (Cys) is an essential amino acid, which is involved in biological self-detoxification, protein synthesis, and body metabolism.15–18 The disulfide linkage between thiol groups of two Cys residues is an essential component of the secondary and tertiary structures of proteins, which define the biological function of the proteins. The Cys level outside the normal physiological range can be associated with various diseases. For example, a high Cys level has been reported to cause amino acid transport disorder. On the other hand, Cys deficiency could lead to growth retardation, skin lesions, edema, liver injury, muscle and fat loss, leucocyte deficiency, and even neurological disorders such as Alzheimer's and Parkinson's diseases.19–22 Currently, a series of methods including high-performance liquid chromatography (HPLC), mass spectrometry, and resonance light scattering are used for Cys tracking.23–25 However, most of the current detection methods require sophisticated instrumentation, time-consuming separation, and costly derivatization process. Thus, it is needed to develop a simple and rapid detection method for Cys. The thiol groups of Cys can strongly bind to AuNPs,26 and its terminal carboxylate and amine groups have a strong coordination capability to metal ions in aqueous solution.27 Therefore, the aggregation of AuNPs can be facilitated through the complexation of metal ions with the surface immobilized Cys, and the accompanying colorimetric change can provide the possibility to be used as a colorimetric sensor for Cys.
In this study, we systematically investigated the aggregation behavior of AuNPs caused by various concentrations of Cys in order to develop a colorimetric detection method for Cys. We sought to optimize the particle size and concentration to improve the colorimetric sensitivity of AuNPs to the detection of Cys. We also sought to examine the influence of transition metal ions on the Cys-induced aggregation of AuNPs. A number of papers have been reported on the colorimetric detection of heavy metal ions due to the growing concern about their toxic effects in contaminated water.3,28–31 However, to our knowledge, few papers systematically examined the effect of various metal ions on the Cys-assisted aggregation of AuNPs. We tested several divalent first-row transition metal ions (Mn2+, Fe2+, Co2+, Ni2+, Cu2+ and Zn2+) at various pH levels in the range of 3.5 to 7 in order to understand how they can facilitate the aggregation of AuNPs with and without Cys. Among the examined metal ions, Cu2+ showed the most promising results throughout the pH range, which can be applied for the sensitive detection of Cys using AuNPs.
2. Experimental section
2.1. Chemicals
All the chemicals were purchased from Sigma-Aldrich Co.: tetrachloroauric acid (HAuCl4, ≥99.9%), trisodium citrate (Na3C6H5O7, meets USP testing specifications), L-cysteine hydrochloride (C3H7NO2S·HCl, ≥98%), copper(II) nitrate trihydrate (Cu(NO3)2·3H2O, ≥99.5%), manganese(II) chloride (MnCl2), iron(II) chloride tetrahydrate (FeCl2·4H2O), cobalt(II) chloride hexahydrate (CoCl2·6H2O), nickel(II) nitrate hexahydrate (Ni(NO3)2·6H2O), zinc nitrate hexahydrate (Zn(NO3)2·6H2O), and HPLC grade water (H2O). All the reagents were analytically pure.2.2. Synthesis of AuNPs
All glasswares were cleaned with aqua regia (HCl![[thin space (1/6-em)]](https://www.rsc.org/images/entities/char_2009.gif) :
:![[thin space (1/6-em)]](https://www.rsc.org/images/entities/char_2009.gif) HNO3 = 3
HNO3 = 3![[thin space (1/6-em)]](https://www.rsc.org/images/entities/char_2009.gif) :
:![[thin space (1/6-em)]](https://www.rsc.org/images/entities/char_2009.gif) 1 vol/vol) and rinsed thoroughly with deionized (DI) water prior to use. AuNPs were synthesized using the citrate reduction method. In brief, 50 mL of tetrachloroauric acid (HAuCl4) (0.01 wt%) was boiled at 100 °C in a 250 mL round bottom flask while being stirred. An aliquot (0.5–6.25 mL) of 1.0 wt% citrate solution was injected quickly into the flask. After 2 min boiling, the solution reached a red color from black (deep blue) and the flask was removed from the hot plate immediately to a cold plate while being stirred at room temperature (rt) for 2 h. The reaction mixtures with different molar ratios of citrate to gold(III) (citrate/Au3+) were prepared by varying the concentration of citrate ions to a fixed amount of Au3+ precursor. Finally, AuNPs were stored at 4 °C prior to a further characterization. The analytical instruments used in this study are described in the ESI.†
1 vol/vol) and rinsed thoroughly with deionized (DI) water prior to use. AuNPs were synthesized using the citrate reduction method. In brief, 50 mL of tetrachloroauric acid (HAuCl4) (0.01 wt%) was boiled at 100 °C in a 250 mL round bottom flask while being stirred. An aliquot (0.5–6.25 mL) of 1.0 wt% citrate solution was injected quickly into the flask. After 2 min boiling, the solution reached a red color from black (deep blue) and the flask was removed from the hot plate immediately to a cold plate while being stirred at room temperature (rt) for 2 h. The reaction mixtures with different molar ratios of citrate to gold(III) (citrate/Au3+) were prepared by varying the concentration of citrate ions to a fixed amount of Au3+ precursor. Finally, AuNPs were stored at 4 °C prior to a further characterization. The analytical instruments used in this study are described in the ESI.†
2.3. Aggregation test of AuNPs
The AuNPs stored at 4 °C for one week were used to investigate the effect of particle sizes, concentrations, metal ions, and solution pH on the aggregation of AuNPs. For the aggregation experiment, various concentrations of Cys (0–20 mM) were prepared by diluting the stock solution of 100 mM Cys with appropriate volumes of DI water. After then, 0.80 mL of AuNPs dispersion was added into 0.80 mL of Cys solutions with varying concentrations. The UV-vis absorption spectra of the mixed solutions were recorded after 15 min of reaction time. The aggregation of AuNPs was also monitored after adding transition metal ions (Mn2+, Fe2+, Co2+, Ni2+, Cu2+, and Zn2+) over the concentration range of Cys. For instance, 0.16 mL of the metal ion was added to 1.28 mL of AuNPs solution at different pH levels (pH 7–3.5) adjusted by adding 0.1 M HCl in the DI water without any salts or electrolytes. Then, the effect of transition metal ions (0.1, 1.0 mM) on the colorimetric response of AuNPs aggregation was recorded by UV-vis spectroscopy with and without Cys.3. Results and discussion
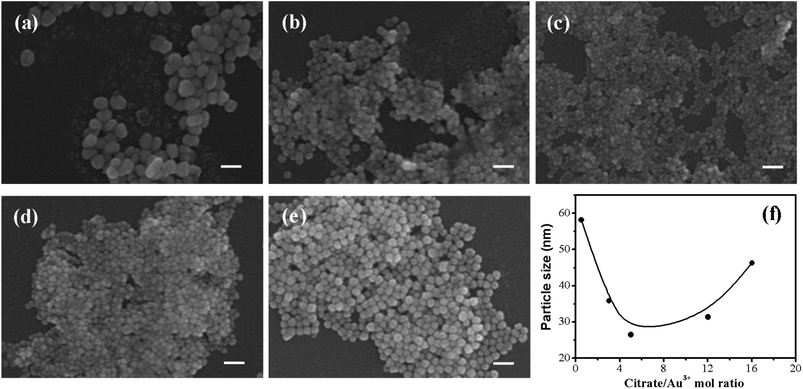
The AuNPs with different sizes were prepared by citrate reduction method with various molar ratios of citrate/Au3+ ranging from 0.5![[thin space (1/6-em)]](https://www.rsc.org/images/entities/char_2009.gif) :
:![[thin space (1/6-em)]](https://www.rsc.org/images/entities/char_2009.gif) 1 to 16
1 to 16![[thin space (1/6-em)]](https://www.rsc.org/images/entities/char_2009.gif) :
:![[thin space (1/6-em)]](https://www.rsc.org/images/entities/char_2009.gif) 1. According to the SEM images of AuNPs, the size of AuNPs decreased with increasing citrate/Au3+ ratio from 0.5
1. According to the SEM images of AuNPs, the size of AuNPs decreased with increasing citrate/Au3+ ratio from 0.5![[thin space (1/6-em)]](https://www.rsc.org/images/entities/char_2009.gif) :
:![[thin space (1/6-em)]](https://www.rsc.org/images/entities/char_2009.gif) 1 to 5
1 to 5![[thin space (1/6-em)]](https://www.rsc.org/images/entities/char_2009.gif) :
:![[thin space (1/6-em)]](https://www.rsc.org/images/entities/char_2009.gif) 1 (Fig. 1(a–c)), but it started to increase with a further increase of citrate/Au3+ ratio from 5
1 (Fig. 1(a–c)), but it started to increase with a further increase of citrate/Au3+ ratio from 5![[thin space (1/6-em)]](https://www.rsc.org/images/entities/char_2009.gif) :
:![[thin space (1/6-em)]](https://www.rsc.org/images/entities/char_2009.gif) 1 to 16
1 to 16![[thin space (1/6-em)]](https://www.rsc.org/images/entities/char_2009.gif) :
:![[thin space (1/6-em)]](https://www.rsc.org/images/entities/char_2009.gif) 1 (Fig. 1(c–e)). At the lowest molar ratio of citrate/Au3+ (0.5
1 (Fig. 1(c–e)). At the lowest molar ratio of citrate/Au3+ (0.5![[thin space (1/6-em)]](https://www.rsc.org/images/entities/char_2009.gif) :
:![[thin space (1/6-em)]](https://www.rsc.org/images/entities/char_2009.gif) 1), the average size of AuNPs was estimated as 58.2 nm by dynamic light scattering (DLS) method. The size of AuNPs decreased to 35.9 nm at the molar ratio of 3
1), the average size of AuNPs was estimated as 58.2 nm by dynamic light scattering (DLS) method. The size of AuNPs decreased to 35.9 nm at the molar ratio of 3![[thin space (1/6-em)]](https://www.rsc.org/images/entities/char_2009.gif) :
:![[thin space (1/6-em)]](https://www.rsc.org/images/entities/char_2009.gif) 1 and reached to the minimum size of 26.5 nm at the molar ratio of 5
1 and reached to the minimum size of 26.5 nm at the molar ratio of 5![[thin space (1/6-em)]](https://www.rsc.org/images/entities/char_2009.gif) :
:![[thin space (1/6-em)]](https://www.rsc.org/images/entities/char_2009.gif) 1. Above the molar ratio of 5
1. Above the molar ratio of 5![[thin space (1/6-em)]](https://www.rsc.org/images/entities/char_2009.gif) :
:![[thin space (1/6-em)]](https://www.rsc.org/images/entities/char_2009.gif) 1, the particle size was again increased to 31.4 nm and 46.3 nm at the molar ratio of 12
1, the particle size was again increased to 31.4 nm and 46.3 nm at the molar ratio of 12![[thin space (1/6-em)]](https://www.rsc.org/images/entities/char_2009.gif) :
:![[thin space (1/6-em)]](https://www.rsc.org/images/entities/char_2009.gif) 1 and 16
1 and 16![[thin space (1/6-em)]](https://www.rsc.org/images/entities/char_2009.gif) :
:![[thin space (1/6-em)]](https://www.rsc.org/images/entities/char_2009.gif) 1, respectively (Fig. 1(f)). The reversal in the trend of particle size change might be attributed to the different mechanism of particle formation depending on the molar ratio of citrate/Au3+. The small AuNPs (26.5 nm) exhibited the narrower size distribution than those of the large AuNPs (35.9 nm, 58.2 nm), as shown in Fig. S1.†
1, respectively (Fig. 1(f)). The reversal in the trend of particle size change might be attributed to the different mechanism of particle formation depending on the molar ratio of citrate/Au3+. The small AuNPs (26.5 nm) exhibited the narrower size distribution than those of the large AuNPs (35.9 nm, 58.2 nm), as shown in Fig. S1.†
Turkevich and Frens demonstrated that the size of AuNPs was facilely manipulated by adjusting the concentration ratio of citrate to Au3+, which was explained by two-step mechanism consisting of a rapid nucleation and a subsequent particle growth.32,33 According to this mechanism, the increased concentration of citrate relative to the fixed concentration of Au3+ can accelerate the nucleation rate, resulting in an increased number of nuclei in a short time. After then, the size of nuclei increases via the diffusion-controlled growth pathway for a long time. Thus, the increased numbers of nuclei consequently decrease the final size of AuNPs under the same amounts of Au precursors.34,35 In this work, however, the opposite trend of particle size change was observed at the higher molar ratio of citrate/Au3+ in the range of 12![[thin space (1/6-em)]](https://www.rsc.org/images/entities/char_2009.gif) :
:![[thin space (1/6-em)]](https://www.rsc.org/images/entities/char_2009.gif) 1 to 16
1 to 16![[thin space (1/6-em)]](https://www.rsc.org/images/entities/char_2009.gif) :
:![[thin space (1/6-em)]](https://www.rsc.org/images/entities/char_2009.gif) 1.35 When the concentration of citrate is further increased, the solution pH approaches to a neutral value and the larger fractions of citrate are deprotonated. Then, the reactivity of Au3+ complex is decreased so that its nucleation rate is slowed down, consequently leading to the increase of particle size caused by Ostwald ripening effect.35,36
1.35 When the concentration of citrate is further increased, the solution pH approaches to a neutral value and the larger fractions of citrate are deprotonated. Then, the reactivity of Au3+ complex is decreased so that its nucleation rate is slowed down, consequently leading to the increase of particle size caused by Ostwald ripening effect.35,36
Ji and co-workers reported a new pH-dependent mechanism of citrate-mediated growth of AuNPs, consisting of nucleation, aggregation, and smoothing steps.35 Zabetakis et al. reported the formation of AuNPs via a gold nanowire intermediate in acidic condition.36,37 When the molar ratio of citrate/Au3+ is below a certain value, the citrate tends to be more protonated due to the decrease of solution pH. The protonated citrates (i.e., less negatively charged citrates) as a stabilizer could not effectively protect the surface of AuNPs, eventually forming large AuNPs. As expected from the more protonation of citrates at lower pH condition, the zeta-potentials of AuNPs were increased from −26.51 mV (at pH 7) to −18.33 (at pH 3.5) (Fig. S2†). The pH of the solution was measured to be 4.21, 5.52, 6.50, and 6.65 corresponding to 0.5![[thin space (1/6-em)]](https://www.rsc.org/images/entities/char_2009.gif) :
:![[thin space (1/6-em)]](https://www.rsc.org/images/entities/char_2009.gif) 1, 3
1, 3![[thin space (1/6-em)]](https://www.rsc.org/images/entities/char_2009.gif) :
:![[thin space (1/6-em)]](https://www.rsc.org/images/entities/char_2009.gif) 1, 12
1, 12![[thin space (1/6-em)]](https://www.rsc.org/images/entities/char_2009.gif) :
:![[thin space (1/6-em)]](https://www.rsc.org/images/entities/char_2009.gif) 1, and 16
1, and 16![[thin space (1/6-em)]](https://www.rsc.org/images/entities/char_2009.gif) :
:![[thin space (1/6-em)]](https://www.rsc.org/images/entities/char_2009.gif) 1 of the molar ratio of citrate/Au3+, respectively.
1 of the molar ratio of citrate/Au3+, respectively.
The XRD diffraction patterns of AuNPs (26.5 nm) were presented in Fig. S3.† The XRD results confirmed the formation of crystalline AuNPs by the citrate reduction method. The characteristic diffraction peaks of the AuNPs are observed at 2θ = 37.84°, 43.88°, 64.46°, and 77.42° that are assigned to (111), (200), (220), and (311) planes of a face center cubic (fcc) lattice of Au crystals, respectively.38
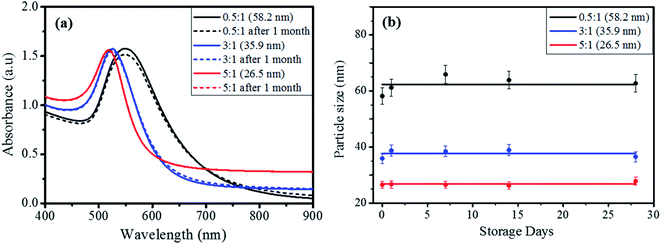
The colloidal stability of prepared AuNPs was tested to ensure the reliable colorimetric detection of Cys over a period of time. Fig. 2(a) shows the UV-vis spectra of the AuNPs prepared with different molar ratios of citrate/Au3+, in which the solid and dotted lines represent the spectra of AuNPs before and after one month storage, respectively. The surface plasmon resonance (SPR) peak was red-shifted from 520 nm to 550 nm with the increase of particle size from 26.5 nm to 58.2 nm. The reason for the shift to a longer wavelength can be interpreted as the increase in the effective refractive index for larger NPs according to the modified Mie theory.39,40 The UV-vis spectra of the samples did not exhibit a notable difference between the solid and dotted lines, signifying the sufficient stability of the AuNPs to be used over one month without aggregation. When compared with the broad absorption band of 58.2 nm AuNPs, the smaller AuNPs (26.5 nm) exhibited a narrower peak, indicative of a more monodisperse size distribution. The particle size was monitored periodically by DLS with the elapse of storage time, as seen from Fig. 2(b). The AuNPs prepared with citrate/Au3+ = 0.5![[thin space (1/6-em)]](https://www.rsc.org/images/entities/char_2009.gif) :
:![[thin space (1/6-em)]](https://www.rsc.org/images/entities/char_2009.gif) 1 (58.2 nm) exhibited a slight increase in size from 58.2 nm to 62.7 nm after one month, indicating the moderate aggregation of the AuNPs. On the other hand, the smaller AuNPs prepared with citrate/Au3+ = 3
1 (58.2 nm) exhibited a slight increase in size from 58.2 nm to 62.7 nm after one month, indicating the moderate aggregation of the AuNPs. On the other hand, the smaller AuNPs prepared with citrate/Au3+ = 3![[thin space (1/6-em)]](https://www.rsc.org/images/entities/char_2009.gif) :
:![[thin space (1/6-em)]](https://www.rsc.org/images/entities/char_2009.gif) 1 (35.9 nm) and 5
1 (35.9 nm) and 5![[thin space (1/6-em)]](https://www.rsc.org/images/entities/char_2009.gif) :
:![[thin space (1/6-em)]](https://www.rsc.org/images/entities/char_2009.gif) 1 (26.5 nm) did not show any distinct change of particle size. Given that citrates form a stabilizing layer on the surface of AuNPs, the slightly diminished stability of AuNPs (58.2 nm) prepared with the lowest citrate/Au3+ ratio might imply an insufficient amount of citrate ions to fully protect the surface of AuNPs. As explained above, the solution pH is proportional to the citrate concentration because citrate is a weak base. Therefore, the solution pH decreases with decreasing citrate/Au3+ ratio and more citrates can be protonated at the lower pH. The protonated citrates cannot form a complete stabilizing layer on the AuNPs surface during particle formation due to the weakened electrostatic attraction caused by decreased negative charge.35,36 As a result, the AuNPs synthesized with the lowest citrate/Au3+ ratio can show a reduced stability, though it was not significant. On the other hand, the AuNPs prepared with citrate/Au3+ = 3
1 (26.5 nm) did not show any distinct change of particle size. Given that citrates form a stabilizing layer on the surface of AuNPs, the slightly diminished stability of AuNPs (58.2 nm) prepared with the lowest citrate/Au3+ ratio might imply an insufficient amount of citrate ions to fully protect the surface of AuNPs. As explained above, the solution pH is proportional to the citrate concentration because citrate is a weak base. Therefore, the solution pH decreases with decreasing citrate/Au3+ ratio and more citrates can be protonated at the lower pH. The protonated citrates cannot form a complete stabilizing layer on the AuNPs surface during particle formation due to the weakened electrostatic attraction caused by decreased negative charge.35,36 As a result, the AuNPs synthesized with the lowest citrate/Au3+ ratio can show a reduced stability, though it was not significant. On the other hand, the AuNPs prepared with citrate/Au3+ = 3![[thin space (1/6-em)]](https://www.rsc.org/images/entities/char_2009.gif) :
:![[thin space (1/6-em)]](https://www.rsc.org/images/entities/char_2009.gif) 1 (35.9 nm) and 5
1 (35.9 nm) and 5![[thin space (1/6-em)]](https://www.rsc.org/images/entities/char_2009.gif) :
:![[thin space (1/6-em)]](https://www.rsc.org/images/entities/char_2009.gif) 1 (26.5 nm) maintained the almost same particle size over a period of one month, confirming their excellent colloidal stability.
1 (26.5 nm) maintained the almost same particle size over a period of one month, confirming their excellent colloidal stability.
 | ||
| Fig. 2 (a) UV-vis spectra of AuNPs prepared with different molar ratios of citrate/Au3+, (b) the variation of particle size measured by DLS method with the elapse of storage time. | ||
In order to investigate the size effect of AuNPs on the colorimetric detection of Cys, AuNPs with two different sizes were compared. The 26.5 nm AuNPs and 46.3 nm AuNPs were prepared with the different molar ratio of citrate/Au3+ = 5![[thin space (1/6-em)]](https://www.rsc.org/images/entities/char_2009.gif) :
:![[thin space (1/6-em)]](https://www.rsc.org/images/entities/char_2009.gif) 1 and 16
1 and 16![[thin space (1/6-em)]](https://www.rsc.org/images/entities/char_2009.gif) :
:![[thin space (1/6-em)]](https://www.rsc.org/images/entities/char_2009.gif) 1, respectively, and the particle concentration was adjusted to have the same surface area per unit volume of AuNPs (2.21 × 10⁻⁴ m2 mL−1). After the addition of Cys, the aggregation degree of AuNPs was quantified by the absorbance ratio (A640/520) measured at 640 nm and 520 nm in their UV-vis spectra. According to Fig. S4,† the smaller AuNPs (26.5 nm) exhibited the more sensitive response to Cys as compared to the larger one (46.3 nm). The A640/520 of the 26.5 nm AuNPs increased rapidly with the increase of Cys concentration from 200 μM to 500 μM, leading to the distinct red-to-blue color change. On the other hand, the aggregation of larger AuNPs (46.3 nm) required the much higher concentration of Cys (1000 μM) for the same color change. It is not clear why the smaller AuNPs (26.5 nm) demonstrated the more enhanced sensitivity to Cys as compared to the larger counterpart (46.3 nm), and none of the data in this study can provide an unequivocal explanation for the size effect. Moreover, a past research has reported a contradicting result that larger AuNPs (40 nm) exhibited the higher sensitivity to Cys than that of smaller AuNPs (13 nm).41 Nevertheless, assuming the 26.5 and 46.3 nm AuNPs were generated through two substantially different reaction pathways as explained for the result in Fig. 1, it might be reasonable to expect that those particles could have distinctive surface morphologies and stabilizing citrate layer structures. Briefly, the solution pH during particle formation is controlled by the concentration of citrates and, in turn, the formation mechanism is determined by the solution pH. The formation of AuNPs with a higher citrate/Au3+ ratio can proceed through the well-known nucleation-growth pathway but the AuNPs prepared with a lower citrate/Au3+ ratio can be formed by an alternative pathway consisting of nucleation, attachment to nanowires, and smoothing the nanowires via ripening to dots.35,36 The surface binding of citrates and their layer structure can be influenced by the surface structure of AuNPs,42 which can be determined by the reaction pathway. Especially, the smaller AuNPs were formed at a lower pH where protonated citrates cannot protect the AuNPs surface effectively due to the diminished electrostatic attraction to the surface, which might lead to formation of incomplete or thinner citrate layer. Therefore, the stabilizing citrates might be replaced with Cys more readily on the small AuNPs (26.5 nm, citrate/Au3+ = 5
1, respectively, and the particle concentration was adjusted to have the same surface area per unit volume of AuNPs (2.21 × 10⁻⁴ m2 mL−1). After the addition of Cys, the aggregation degree of AuNPs was quantified by the absorbance ratio (A640/520) measured at 640 nm and 520 nm in their UV-vis spectra. According to Fig. S4,† the smaller AuNPs (26.5 nm) exhibited the more sensitive response to Cys as compared to the larger one (46.3 nm). The A640/520 of the 26.5 nm AuNPs increased rapidly with the increase of Cys concentration from 200 μM to 500 μM, leading to the distinct red-to-blue color change. On the other hand, the aggregation of larger AuNPs (46.3 nm) required the much higher concentration of Cys (1000 μM) for the same color change. It is not clear why the smaller AuNPs (26.5 nm) demonstrated the more enhanced sensitivity to Cys as compared to the larger counterpart (46.3 nm), and none of the data in this study can provide an unequivocal explanation for the size effect. Moreover, a past research has reported a contradicting result that larger AuNPs (40 nm) exhibited the higher sensitivity to Cys than that of smaller AuNPs (13 nm).41 Nevertheless, assuming the 26.5 and 46.3 nm AuNPs were generated through two substantially different reaction pathways as explained for the result in Fig. 1, it might be reasonable to expect that those particles could have distinctive surface morphologies and stabilizing citrate layer structures. Briefly, the solution pH during particle formation is controlled by the concentration of citrates and, in turn, the formation mechanism is determined by the solution pH. The formation of AuNPs with a higher citrate/Au3+ ratio can proceed through the well-known nucleation-growth pathway but the AuNPs prepared with a lower citrate/Au3+ ratio can be formed by an alternative pathway consisting of nucleation, attachment to nanowires, and smoothing the nanowires via ripening to dots.35,36 The surface binding of citrates and their layer structure can be influenced by the surface structure of AuNPs,42 which can be determined by the reaction pathway. Especially, the smaller AuNPs were formed at a lower pH where protonated citrates cannot protect the AuNPs surface effectively due to the diminished electrostatic attraction to the surface, which might lead to formation of incomplete or thinner citrate layer. Therefore, the stabilizing citrates might be replaced with Cys more readily on the small AuNPs (26.5 nm, citrate/Au3+ = 5![[thin space (1/6-em)]](https://www.rsc.org/images/entities/char_2009.gif) :
:![[thin space (1/6-em)]](https://www.rsc.org/images/entities/char_2009.gif) 1) than the large one (46.3 nm, citrate/Au3+ = 16
1) than the large one (46.3 nm, citrate/Au3+ = 16![[thin space (1/6-em)]](https://www.rsc.org/images/entities/char_2009.gif) :
:![[thin space (1/6-em)]](https://www.rsc.org/images/entities/char_2009.gif) 1), consequently leading to the more sensitive colorimetric response.
1), consequently leading to the more sensitive colorimetric response.
Scheme 1(A) illustrates the formation of AuNPs capped with citrate ions and the Cys-assisted aggregation of AuNPs. Here, the citrate was used as a reducing and stabilizing agent.42 The negatively charged citrates on the particle surface can prevent the aggregation of AuNPs through electrostatic repulsion. When Cys is added to the dispersion of citrate-stabilized AuNPs, the capped citrates are readily displaced with Cys with thiol group due to its strong affinity to the Au surface. It is also known that amine groups can bind to the surface of AuNPs strongly, but in amino acids, the binding of α-amine next to the carboxylic acid group is suppressed at neutral pH due to the electrostatic repulsion between negatively charged carboxylates and particle surface.43 As a result, the Cys attached on the AuNPs through thiol group produces zwitterionic structure exposing negatively charged carboxylate (–COO−) and positively charged ammonium groups (–NH3+).44 The zwitterionic attractions of oppositely charged groups and hydrogen bonding can induce the aggregation of adjacent AuNPs, as described in Scheme 1(A).45 The solution color of aggregated AuNPs changes from red to blue via such a Cys-assisted cross-linking assembly, which is immediately observed by naked eyes. When the interparticle distance decreases to less than the average particle size in the aggregates, the absorption band shifts to longer wavelength accompanying the red-to-blue color transition because of the plasmonic coupling effect of neighboring particles.46 Furthermore, the metal ions can form the coordination complex with the zwitterionic groups of Cys ligand, as shown in Scheme 1(B). That is, each cation (M2+) can form a stable chelate complex with Cys molecules attached on neighboring AuNPs, promoting their aggregation. Thus, it is plausible to expect that the colorimetric response of AuNPs can be enhanced by the addition of metal ions that can form chelate complex with Cys.
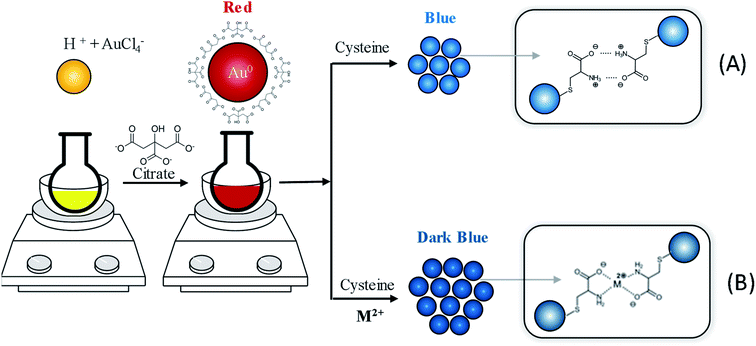 | ||
| Scheme 1 Schematic illustration of aggregation behavior and color changes of AuNPs via (A) Cys-assisted cross-linking, and (B) M2+-mediated coordination complex formation. | ||
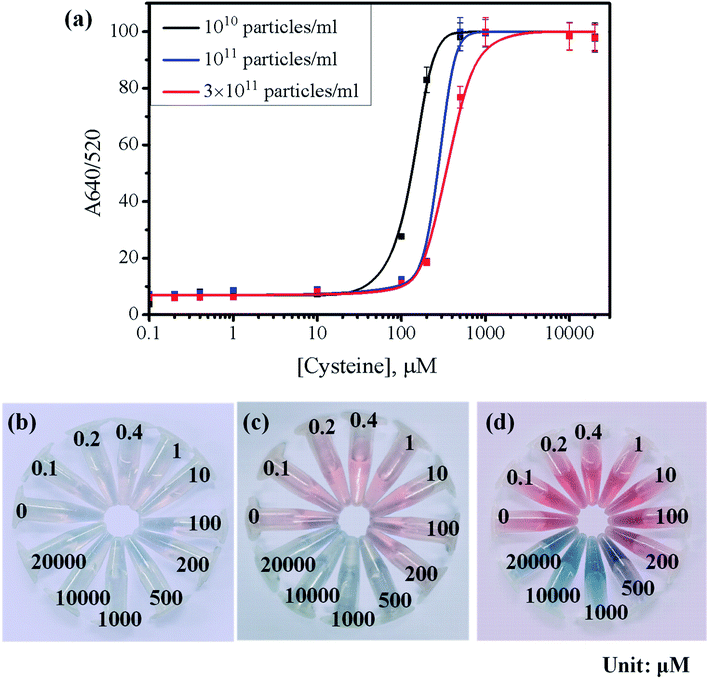
To test the visibility of colorimetric response, the aggregation behavior of 26.5 nm AuNPs at three different concentrations (1010/mL, 1011/mL, and 3 × 10¹¹/mL) was investigated with increasing Cys concentration. Fig. 3 displays the photographs and Fig. S5† shows the UV-vis spectra of the series of examined samples. The 26.5 nm AuNPs showed the characteristic SPR peak (λmax) at 520 nm in the absence of Cys. Upon the addition of Cys, however, the peak at 520 nm declined and a new secondary peak was generated around 640–700 nm, indicating the aggregation of AuNPs in proportion to Cys concentration.47 The absorbance ratio at 640 nm and 520 nm (A640/520) was chosen as a spectroscopic index for the degree of AuNPs aggregation. According to Fig. S5(a–c),† the addition of Cys did not induce a noticeable red-shift of SPR peak when the concentration of Cys was less than 10 μM. With a further increase of Cys above 10 μM, however, the peak intensity at 520 nm decreased significantly and the secondary peak at the longer wavelength appeared markedly.
Fig. 3(a) summarized the absorbance ratios of A640/520 extracted from the UV-vis spectra of AuNPs at different particle concentrations over the concentration range of Cys between 0.1 and 20![[thin space (1/6-em)]](https://www.rsc.org/images/entities/char_2009.gif) 000 μM. The A640/520 ratio at the low concentration of AuNPs (1010/mL) reached ∼85% with 200 μM Cys, whereas the AuNPs at 1011/mL and 3 × 10¹¹/mL reached only 20% of absorbance ratio for the same concentration of Cys. These results suggest that the AuNPs at 1010/mL provide a more sensitive response to Cys than the AuNPs at 1011/mL and 3 × 10¹¹/mL, which require more Cys to induce appreciable aggregation of AuNPs for the colorimetric detection. However, Fig. 3(b) shows that the AuNPs (1010/mL) did not exhibit a clear color change that can be easily recognized with naked eyes. On the other hand, the AuNPs (3 × 10¹¹/mL) exhibited the most distinct color change without any supporting analytical instruments, as shown in Fig. 3(b–d). To obtain the better visibility of color change, the AuNPs were prepared at 3 × 10¹¹/mL in the subsequent tests.
000 μM. The A640/520 ratio at the low concentration of AuNPs (1010/mL) reached ∼85% with 200 μM Cys, whereas the AuNPs at 1011/mL and 3 × 10¹¹/mL reached only 20% of absorbance ratio for the same concentration of Cys. These results suggest that the AuNPs at 1010/mL provide a more sensitive response to Cys than the AuNPs at 1011/mL and 3 × 10¹¹/mL, which require more Cys to induce appreciable aggregation of AuNPs for the colorimetric detection. However, Fig. 3(b) shows that the AuNPs (1010/mL) did not exhibit a clear color change that can be easily recognized with naked eyes. On the other hand, the AuNPs (3 × 10¹¹/mL) exhibited the most distinct color change without any supporting analytical instruments, as shown in Fig. 3(b–d). To obtain the better visibility of color change, the AuNPs were prepared at 3 × 10¹¹/mL in the subsequent tests.
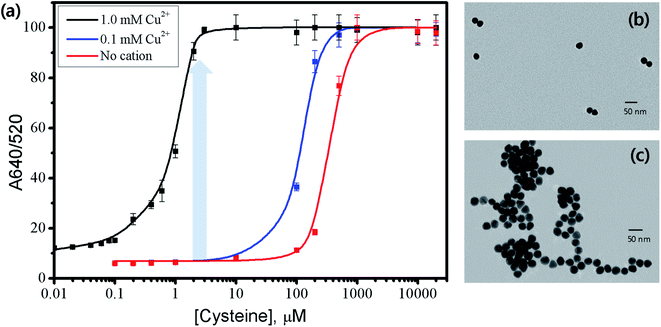
We hypothesized that the addition of Cu2+ ions could increase the colorimetric sensitivity of AuNPs to Cys by facilitating the aggregation through the chelate formation with Cys molecules on adjacent AuNPs (please see Scheme 1(B)).41 To test this hypothesis, the effect of Cu2+ ions on the Cys-induced aggregation was investigated with 26.5 nm AuNPs at 3 × 10¹¹/mL. In the absence of Cys, the addition of Cu2+ to the dispersion of citrate-stabilized AuNPs did not show any noticeable change in the UV-vis spectrum (data not shown). The result confirmed that Cu2+ at 0.1 or 1.0 mM could not cause the aggregation of AuNPs by themselves, and thus Cu2+ ions do not interfere with the AuNPs-based colorimetric detection of Cys. Fig. 4 shows the change of A640/520 ratio for 26.5 nm AuNPs with increasing Cys concentration from 0.005 to 20![[thin space (1/6-em)]](https://www.rsc.org/images/entities/char_2009.gif) 000 μM with or without Cu2+ ions. The absorbance ratio of AuNPs in the absence of Cu2+ exhibited a negligible value at 100 μM Cys and no color change was observed. On the other hand, in the presence of Cu2+ at 0.1 mM, the absorbance ratio reached ∼40% at 100 μM Cys, producing the purple color as shown in the inset of Fig. S6,† and reached ∼100% at ∼500 μM. The sensitivity of the AuNPs to Cys was further increased with increasing amount of Cu2+ ions. In the presence of Cu2+ at 1.0 mM, the A640/520 ratio already reached ∼80% with only 1.5 μM Cys and a noticeable aggregation of AuNPs was observed, as evidenced by the blue color shown in the inset of Fig. S6.† The A640/520 ratio reached the maximum value at ∼10 μM Cys. The TEM images in Fig. 4 (b and c) show that the AuNPs with 1.5 μM Cys were well dispersed before the addition of Cu2+ but significantly aggregated after the addition of Cu2+ at 1.0 mM. In the absence of Cu2+, the zwitterionic attraction and hydrogen bonding between Cys molecules anchored on the adjacent AuNPs can lead to the aggregation of the nanoparticles. It seems reasonable because the amine group in Cys exists as a positively charged ammonium group and the carboxylic acid group in Cys exists as a negatively charged carboxylate group at neutral pH. In contrast, upon the addition of Cu2+, the Cu2+ ion can form the highly stable chelate complex with the Cys on neighboring AuNPs, facilitating the aggregation of the particles not only by zwitterionic attraction but also by the chelate formation (Scheme 1(B)). The facilitated aggregation of AuNPs results in the enhanced colorimetric sensitivity of the particles to Cys.
000 μM with or without Cu2+ ions. The absorbance ratio of AuNPs in the absence of Cu2+ exhibited a negligible value at 100 μM Cys and no color change was observed. On the other hand, in the presence of Cu2+ at 0.1 mM, the absorbance ratio reached ∼40% at 100 μM Cys, producing the purple color as shown in the inset of Fig. S6,† and reached ∼100% at ∼500 μM. The sensitivity of the AuNPs to Cys was further increased with increasing amount of Cu2+ ions. In the presence of Cu2+ at 1.0 mM, the A640/520 ratio already reached ∼80% with only 1.5 μM Cys and a noticeable aggregation of AuNPs was observed, as evidenced by the blue color shown in the inset of Fig. S6.† The A640/520 ratio reached the maximum value at ∼10 μM Cys. The TEM images in Fig. 4 (b and c) show that the AuNPs with 1.5 μM Cys were well dispersed before the addition of Cu2+ but significantly aggregated after the addition of Cu2+ at 1.0 mM. In the absence of Cu2+, the zwitterionic attraction and hydrogen bonding between Cys molecules anchored on the adjacent AuNPs can lead to the aggregation of the nanoparticles. It seems reasonable because the amine group in Cys exists as a positively charged ammonium group and the carboxylic acid group in Cys exists as a negatively charged carboxylate group at neutral pH. In contrast, upon the addition of Cu2+, the Cu2+ ion can form the highly stable chelate complex with the Cys on neighboring AuNPs, facilitating the aggregation of the particles not only by zwitterionic attraction but also by the chelate formation (Scheme 1(B)). The facilitated aggregation of AuNPs results in the enhanced colorimetric sensitivity of the particles to Cys.
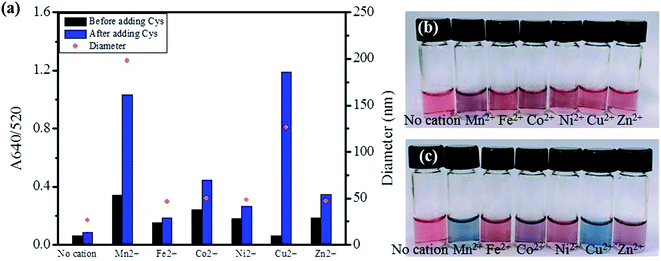
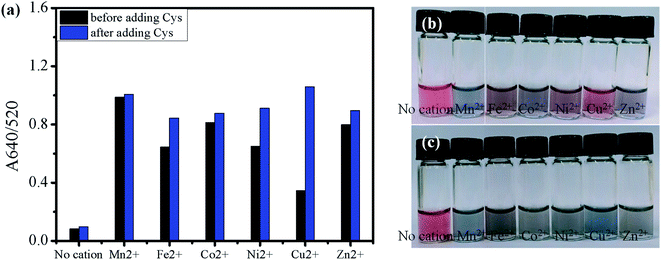
For comparison with Cu2+, other divalent first-row transition metals (Mn2+, Fe2+, Co2+, Ni2+, Zn2+) were examined for the aggregation of AuNPs. As shown for Cu2+, all the examined metals at 1.0 mM did not induce a distinctive color change of AuNPs without Cys in the solution (Fig. 5(b)). However, when 1.5 μM Cys was added to the AuNPs solutions containing the divalent first-raw transition metals, some solutions exhibited a significant increase in the A640/520 absorption ratio (Fig. 5(a)) and accompanying red-to-blue color change (Fig. 5(c)). The absorbance ratio increased in the order of Fe2+ < Ni2+ < Zn2+ < Co2+ ≪ Mn2+ < Cu2+ upon the addition of Cys. According to the Irving–Williams series, Cu2+ can form the most stable complex among the divalent first-row transition metal ions regardless of the nature of ligands.48 Thus, the highest absorbance ratio for Cu2+ can be rationalized by the stable complex formation of Cu2+ with the Cys molecules attached on neighboring AuNPs, facilitating the particle aggregation. However, the second highest absorbance ratio for Mn2+ cannot be explained only by the complex formation with Cys because the Irving–Williams series predicts that Mn2+ forms the least stable complex among the examined divalent transition metal ions. A past study has reported that the aggregation of citrate-stabilized AuNPs caused by Mn2+ can be explained by two factors.49 First, the adsorption of Mn2+ on the negatively charged surface can reduce the surface charge of AuNPs, decreasing the electrostatic repulsion between particles. Second, the carboxylate groups of citrates on the surface of AuNPs can form complexes with Mn2+, decreasing the negative surface charge and crosslinking neighboring AuNPs. Even though the decrease of interparticle distance caused by above two factors is insignificant, the aggregation rate by a crosslinker such as Cys can be drastically enhanced by such a small decrease. In fact, the reaction rate of AuNPs aggregation has been reported to be proportional to the fourth-degree of Mn2+ concentration.49 The result suggests that Mn2+ may reduce the negative surface charge on AuNPs more effectively than other metal ions, assisting the complex formation with amino acids attached on neighboring AuNPs as described in Scheme 1(B).50 The size of aggregated AuNPs with both Cys and Mn2+ was measured to be 198.2 ± 86.4 nm, leading to partial precipitation of highly aggregated AuNPs. On the other hand, the addition of Cu2+ with Cys to AuNPs produced a more vivid color change without noticeable precipitation and the size was measured to be 126.5 ± 57.7 nm.
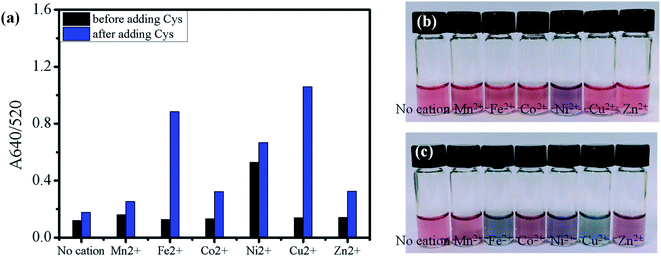
We hypothesized that the protonation of citrates at an acidic pH can reduce the surface charge of AuNPs and interparticle repulsion, and thus accelerate the aggregation of AuNPs. To test the hypothesis, the aggregation of AuNPs was investigated in the slightly acidic solution at pH 5. Fig. 6(b) shows that all examined transition metal ions at pH 5 except Cu2+ induced the distinct red-to-blue color change even before the addition of Cys, indicating the significant aggregation of AuNPs. In order to confirm our hypothesis, we measured the zeta-potentials of the AuNPs-metal ion systems in the absence of Cys. The magnitude of negative zeta potential of citrate-stabilized AuNPs decreased with decreasing pH (Fig. S2†), probably due to the protonation of citrates, but it was still determined to be a large negative value (−22.08 ± 2.19 mV) at pH 5. However, such a small change made a big difference in the effect of metal ions. The zeta potential increased substantially to the range of −0.64 to −1.68 mV upon the addition of Fe2+, Ni2+, or Zn2+ (Fig. S7†). Such zeta potentials close to zero can facilitate the aggregation of AuNPs due to the diminished repulsion between particles, which was indicated by the large A640/520 ratios measured after the addition of the metal ions but before the addition of Cys (Fig. 6(a), black bars).
On the other hand, the addition of Cu2+ caused an apparently smaller increase in zeta potential than other metal ions and the AuNPs–Cu2+ showed a relatively large negative zeta potential of −11.38 ± 3.17 mV after the addition of Cu2+. Therefore, the AuNPs–Cu2+ exhibited less pronounced aggregation of particles as evidenced by the low A640/520 ratio before the addition of Cys (Fig. 6(a)). However, the A640/520 ratio for AuNPs–Cu2+ increased substantially upon the addition of Cys, and Cu2+ showed the highest A640/520 ratio among the examined metal ions. This result proposes the aggregation by Cu2+ occurs mostly through the complexation of Cu2+ with Cys rather than by reducing the surface negative charge. In the case of AuNPs–Mn2+, a measurable zeta-potential value was not obtained even before the addition of Cys, probably due to the significant precipitation of highly aggregated AuNPs. The result clearly indicates that the aggregation of AuNPs caused by Mn2+ occurs by reducing the surface negative charge of AuNPs by adsorption of Mn2+ on the surface or complexation with citrate stabilizers,49,51 in contrast to the AuNPs–Cu2+.
As shown in Fig. 6, the rapid aggregation of AuNPs by the examined metal ions at pH 5 interfered with the detection of Cys in the subsequent step, and the concentration of the metal ions was lowered tenfold to 0.1 mM to minimize the metal-mediated aggregation. The metal ions at 0.1 mM did not induce a noticeable color change of the AuNPs at pH 5 even with Cys (Fig. S8†). The effect of transition metal ions (0.1 mM) on the Cys-mediated aggregation of AuNPs was further investigated under a more acidic condition at pH 3.5 (Fig. 7). Unlike the results at pH 5, the solutions including 0.1 mM Cu2+ and Fe2+ at pH 3.5 exhibited a distinct red-to-blue color change of the AuNPs upon the addition of Cys (Fig. 7(c)). The difference of A640/520 absorbance ratios measured before and after the addition of Cys increased in the order of Mn2+ < Zn2+ – Co2+ ≪ Fe2+ < Cu2+ (Fig. 7(a)). In this order, Ni2+ was not included because it already exhibited an apparent red-to-purple color change even before the addition of Cys. The zeta potential of the AuNPs–Ni2+ was measured to be nearly zero at pH 3.5, indicating Ni2+ can facilitate the aggregation of AuNPs by reducing the surface charge of the particles as discussed for Mn2+ at pH 7.52 In contrast with the result at pH 7, the solution including Mn2+ did not show a noticeable color change even after adding Cys. It is unclear why Mn2+ was less effective for the aggregation of AuNPs at a lower pH because a reduced solution pH is likely to accelerate the rate of aggregation by protonating anionic citrates. However, we would like to note that the experiments at pH 3.5 was carried out with a tenfold lower concentration of Mn2+ (0.1 mM) than that at pH 7 (1.0 mM). The reduced concentration of Mn2+ might not be enough to cause such an aggregation by reducing the surface charge. The zeta-potentials of AuNPs–Fe2+ and AuNPs–Cu2+ were measured as −18.33 ± 1.94 mV and −17.54 ± 8.8 mV at pH 3.5, respectively, indicating that the stabilizing citrate layer on the surface of AuNPs remained relatively stable in the presence of 0.1 mM Fe2+ and Cu2+ under the given condition. Therefore, the pronounced red-to-blue color change for the AuNPs–Fe2+ and AuNPs–Cu2+ upon the addition of Cys (Fig. 7(c)) can be explained that the aggregation of AuNPs is accelerated primarily by the complexation of Fe2+ and Cu2+ with Cys on neighboring particles.
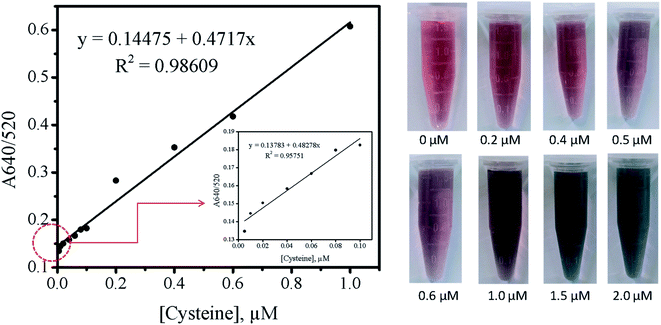
In summary, the optimized sensor system reported in this paper showed a promising potential to be used for the colorimetric detection of trace Cys in the presence of 1.0 mM Cu2+ at pH 7. As shown in the right image of Fig. 8, the discernable color change was observed at 0.5 μM Cys and the more distinct change was visually identified at 1.0 μM Cys. Then, the color of AuNPs solution was completely changed from red to blue at 1.5 μM Cys. Furthermore, the absorbance ratio of A640/520 for the AuNPs–Cu2+ system was linearly correlated with the concentration of Cys from 10−6 to 10−8 M at pH 7. When using a spectroscopic method, the limit of detection (LOD) for Cys was determined to be 5 nM (0.6 ng mL−1), which was comparable or even better than the reported values in past researches.30,41,51,53
4. Conclusions
This study explored a detection method for Cys using AuNPs and tried to optimize the experimental condition to improve the sensitivity of the colorimetric response of AuNPs to Cys. The AuNPs were prepared by the citrate reduction method and the particle size was adjusted between 26.5 nm and 58.2 nm by controlling the ratio of citrate/Au3+. The effect of particle size on the Cys-mediated aggregation of AuNPs was investigated and the smaller AuNPs (26.5 nm) exhibited a more sensitive colorimetric response to Cys than the larger AuNPs (46.5 nm). Among the AuNPs at the examined concentrations (1010/mL, 1011/mL, and 3 × 10¹¹/mL), the particles at the highest concentration (3 × 10¹¹/mL) showed the most distinguishable color change upon mixing with Cys. Therefore, the 26.5 nm AuNPs at 3 × 10¹¹/mL were selected to be used for further investigations. Finally, the effect of various divalent first-row transition metal ions (Mn2+, Fe2+, Co2+, Ni2+, Cu2+, and Zn2+) on the Cys-induced particle aggregation was studied. At pH 7, the addition of 1.0 mM Mn2+ or Cu2+ was found to significantly facilitate the crosslinking of AuNPs in the presence of Cys. Based on the measured zeta potentials, it can be reasonable to propose that Mn2+ ions reduce the surface charge of AuNPs most effectively to accelerate their aggregation. On the other hand, the aggregation assisted by Cu2+ may occur due to the formation of highly stable complexes of Cu2+ with Cys, leading to the crosslink of AuNPs. All examined 1.0 mM metal ions except Cu2+ resulted in pronounced aggregation of AuNPs under an acidic condition even without Cys, and the concentration of metal ions was lowered to 0.1 mM to investigate their effect at pH 3.5. In contrast with the results at pH 7, Mn2+ did not show a perceptible colorimetric response of AuNPs upon the addition of Cys, probably due to the tenfold lower Mn2+ concentration. However, Cu2+ that can form the most stable complex with Cys among the examined metal ions showed the distinct red-to-blue color change of AuNPs at pH 3.5 as well as pH 7 upon the addition of Cys. The results presented in this study can be used to develop a direct detection method for Cys and also a strategy to investigate biological activities that produce or liberate Cys. Moreover, this system is potentially applicable to the colorimetric detection of harmful metal ions that can bind to Cys and promote the aggregation of AuNPs.Conflicts of interest
There are no conflicts to declare.Acknowledgements
This research work was supported by the Gachon University research fund of 2018 [GCU-2018-0307]. This research was also supported by the Bio and Medical Technology Development Program of the National Research Foundation (NRF) funded by the Ministry of Science & ICT [NRF-2018M3A9H4056340].References
- M. S. Kim, D. H. Kim, J. Lee, H. T. Ahn, M. I. Kim and J. Lee, Nanoscale, 2020, 12, 1419–1424 RSC.
- T. N. Le, T. D. Tran and M. I. Kim, Nanomaterials, 2020, 10, 2 Search PubMed.
- E. Priyadarshini and N. Pradhan, Sens. Actuators, B, 2017, 238, 888–902 CrossRef CAS.
- Y. Lin, C. Chen, C. Wang, F. Pu, J. Ren and X. Qu, Chem. Commun., 2011, 47, 1181–1183 RSC.
- D. Liu, W. Qu, W. Chen, W. Zhang, Z. Wang and X. Jiang, Anal. Chem., 2010, 82, 9606–9610 CrossRef CAS PubMed.
- L. Wang, X. Liu, X. Hu, S. Song and C. Fan, Chem. Commun., 2006, 3780–3782, 10.1039/b607448k.
- H. Wei, B. Li, J. Li, E. Wang and S. Dong, Chem. Commun., 2007, 3735–3737, 10.1039/b707642h.
- Y. Zheng, Y. Wang and X. Yang, Sens. Actuators, B, 2011, 156, 95–99 CrossRef CAS.
- Y. Huo, L. Qi, X. J. Lv, T. Lai, J. Zhang and Z. Q. Zhang, Biosens. Bioelectron., 2016, 78, 315–320 CrossRef CAS PubMed.
- T. M. Godoy-Reyes, A. M. Costero, P. Gaviña, R. Martínez-Máñez and F. Sancenón, ACS Appl. Nano Mater., 2019, 2, 1367–1373 CrossRef CAS.
- J. S. Lee, M. S. Han and C. A. Mirkin, Angew. Chem., 2007, 46, 4093–4096 CrossRef CAS PubMed.
- W. Liu, D. Zhang, Y. Tang, Y. Wang, F. Yan, Z. Li, J. Wang and H. S. Zhou, Talanta, 2012, 101, 382–387 CrossRef CAS PubMed.
- X. Liang, H. Wei, Z. Cui, J. Deng, Z. Zhang, X. You and X. E. Zhang, Analyst, 2011, 136, 179–183 RSC.
- K. W. Huang, C. J. Yu and W. L. Tseng, Biosens. Bioelectron., 2010, 25, 984–989 CrossRef CAS PubMed.
- Y. Dai, Y. Zheng, T. Xue, F. He, H. Ji and Z. Qi, Spectrochim. Acta, Part A, 2020, 225, 117490 CrossRef CAS PubMed.
- K. G. Reddie and K. S. Carroll, Curr. Opin. Chem. Biol., 2008, 12, 746–754 CrossRef CAS PubMed.
- S. H. Adams, Adv. Nutr., 2011, 2, 445–456 CrossRef CAS PubMed.
- H. Miki and Y. Funato, J. Biochem., 2012, 151, 255–261 CrossRef CAS PubMed.
- B. Filanovsky, Anal. Chim. Acta, 1999, 394, 91–100 CrossRef CAS.
- Y. S. Borghei, M. Hosseini, M. Khoobi and M. R. Ganjali, J. Fluoresc., 2017, 27, 529–536 CrossRef CAS PubMed.
- J. Deng, Q. Lu, Y. Hou, M. Liu, H. Li, Y. Zhang and S. Yao, Anal. Chem., 2015, 87, 2195–2203 CrossRef CAS PubMed.
- J. S. Lee, P. A. Ulmann, M. S. Han and C. A. Mirkin, Nano Lett., 2008, 8, 529–533 CrossRef CAS PubMed.
- K. Yin, Design of Novel Biosensors for Optical, Sensing and Their Applications in Environmental Analysis, 2020, vol. 10, pp. 75–91, DOI:10.1007/978-981-13-6488-4_6.
- M. Rafii, R. Elango, G. Courtney-Martin, J. D. House, L. Fisher and P. B. Pencharz, Anal. Biochem., 2007, 371, 71–81 CrossRef CAS PubMed.
- Z. P. Li, X. R. Duan, C. H. Liu and B. A. Du, Anal. Biochem., 2006, 351, 18–25 CrossRef CAS PubMed.
- M. Zhou, J. Ding, L. P. Guo and Q. K. Shang, Anal. Chem., 2007, 79, 5328–5335 CrossRef CAS PubMed.
- M. Belcastro, T. Marino, N. Russo and M. Toscano, J. Mass Spectrom., 2005, 40, 300–306 CrossRef CAS PubMed.
- M. Shellaiah, N. Thirumalaivasan, K. W. Sun and S.-P. Wu, Microchem. J., 2021, 160, 105754 CrossRef CAS.
- K. Saha, S. S. Agasti, C. Kim, X. Li and V. M. Rotello, Chem. Rev., 2012, 112, 2739–2779 CrossRef CAS PubMed.
- V. V. Apyari, V. V. Arkhipova, A. I. Isachenko, P. A. Volkov, S. G. Dmitrienko and I. I. Torocheshnikova, Sens. Actuators, B, 2018, 260, 953–961 CrossRef CAS.
- K. Kim, Y. S. Nam, Y. Lee and K. B. Lee, J. Anal. Methods Chem., 2017, 2017, 3648564 Search PubMed.
- J. Turkevich, P. C. Stevenson and J. Hillier, Discuss. Faraday Soc., 1951, 11, 55 RSC.
- G. Frens, Nat. Phys. Sci., 1973, 241, 20–22 CrossRef CAS.
- M. Wuithschick, A. Birnbaum, S. Witte, M. Sztucki, U. Vainio, N. Pinna, K. Rademann, F. Emmerling, R. Kraehnert and J. Polte, ACS Nano, 2015, 9, 7052–7071 CrossRef CAS PubMed.
- X. Ji, X. Song, J. Li, Y. Bai, W. Yang and X. Peng, J. Am. Chem. Soc., 2007, 129, 13939–13948 CrossRef CAS PubMed.
- K. Zabetakis, W. E. Ghann, S. Kumar and M.-C. Daniel, Gold Bull., 2012, 45, 203–211 CrossRef CAS.
- B.-K. Pong, H. I. Elim, J.-X. Chong, W. Ji, B. L. Trout and J.-Y. Lee, J. Phys. Chem. C, 2007, 111, 6281–6287 CrossRef CAS.
- S. Krishnamurthy, A. Esterle, N. C. Sharma and S. V. Sahi, Nanoscale Res. Lett., 2014, 9, 627 CrossRef PubMed.
- P. N. Njoki, I. I. S. Lim, D. Mott, H.-Y. Park, B. Khan, S. Mishra, R. Sujakumar, J. Luo and C.-J. Zhong, J. Phys. Chem. C, 2007, 111, 14664–14669 CrossRef CAS.
- I. I. S. Lim and C.-J. Zhong, Gold Bull., 2007, 40, 59–66 CrossRef CAS.
- L. Li and B. Li, Analyst, 2009, 134, 1361–1365 RSC.
- J. W. Park and J. S. Shumaker-Parry, J. Am. Chem. Soc., 2014, 136, 1907–1921 CrossRef CAS PubMed.
- Z. Zhong, S. Patskovskyy, P. Bouvrette, J. H. T. Luong and A. Gedanken, J. Phys. Chem. B, 2004, 108, 4046–4052 CrossRef CAS.
- G. Dodero, L. De Michieli, O. Cavalleri, R. Rolandi, L. Oliveri, A. Daccà and R. Parodi, Colloids Surf., A, 2000, 175, 121–128 CrossRef CAS.
- S. Aryal, B. K. C. Remant, N. Dharmaraj, N. Bhattarai, C. H. Kim and H. Y. Kim, Spectrochim. Acta, Part A, 2006, 63, 160–163 CrossRef PubMed.
- U. Kreibig and L. Genzel, Surf. Sci., 1985, 156, 678–700 CrossRef CAS.
- M. N. Holme, S. Rana, H. M. G. Barriga, U. Kauscher, N. J. Brooks and M. M. Stevens, ACS Nano, 2018, 12, 8197–8207 CrossRef CAS.
- H. Irving and R. J. P. Williams, J. Chem. Soc., 1953, 3192, 10.1039/jr9530003192.
- E. Iglesias and R. Prado-Gotor, Phys. Chem. Chem. Phys., 2015, 17, 644–654 RSC.
- M. Annadhasan, T. Muthukumarasamyvel, V. R. Sankar Babu and N. Rajendiran, ACS Sustainable Chem. Eng., 2014, 2, 887–896 CrossRef CAS.
- J. Bhamore, K. A. Rawat, H. Basu, R. K. Singhal and S. K. Kailasa, Sens. Actuators, B, 2015, 212, 526–535 CrossRef CAS.
- H. N. Umh and Y. Kim, J. Ind. Eng. Chem., 2014, 20, 3175–3178 CrossRef CAS.
- Q. Qian, J. Deng, D. Wang, L. Yang, P. Yu and L. Mao, Anal. Chem., 2012, 84, 9579–9584 CrossRef CAS PubMed.
Footnote |
| † Electronic supplementary information (ESI) available. See DOI: 10.1039/d1ra00013f |
| This journal is © The Royal Society of Chemistry 2021 |

