 Open Access Article
Mechanistic effects of blending formic acid with ethanol on Pd activity towards formic acid oxidation in acidic media†
Taher Al Najjar ,
Nashaat Ahmed and
Ehab N. El Sawy
 *
*
Department of Chemistry, School of Science and Engineering, The American University in Cairo, Cairo, Egypt 11835. E-mail: ehab.elsawy@aucegypt.edu
First published on 29th June 2021
Abstract
The direct formic acid fuel cell (DFAFC) is one of the most promising direct liquid fuel cells. Pd is the most active catalyst towards formic oxidation, however, it suffers from CO-like poisoning and instability in acidic media. Blending formic acid with ethanol is known to synergistically enhance the Pt catalytic activity of Pt. However, it has not been studied in the case of Pd. In this study, ethanol/formic acid blends were tested, aiming at understanding the effect of ethanol on the formic acid oxidation mechanism at Pd and how the direct and indirect pathways could be affected. The blends consisted of different formic acid (up to 4 M) and ethanol (up to 0.5 M) concentrations. The catalytic activity of a 40% Pd/C catalyst was tested in 0.1 M H2SO4 + XFA + YEtOH using cyclic voltammetry, while the catalyst resistance to poisoning in the presence and absence of ethanol was tested using chronopotentiometry. The use of these blends is found to not only eliminate the indirect pathway but also slowly decrease the direct pathway activity too. That is believed to be due to the different ethanol adsorption orientations at different potentials. This study should open the door for further studying the oxidation of FA/ethanol blends using different pHs and different Pd-based catalysts.
Introduction
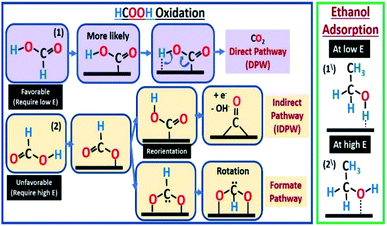
Low-temperature proton exchange membrane fuel cells (PEMFCs) are known to work with hydrogen as fuel. However, hydrogen safe storage and transportation are among the main factors limiting its use on a commercial scale. Therefore, liquid fuels such as methanol,1 ethanol,2 and ethylene glycol3 were suggested as a source of hydrogen that could be easily stored and transported. One of the most promising fuels to be used is formic acid (FA). FA has higher open circuit potential, high energy conversion efficiency, and fast kinetics, besides low toxicity and fuel crossover through the membrane.4 However, one of the major problems associated with the direct formic acid fuel cell (DFAFC) is the tendency of the used catalyst to be poisoned by carbon monoxide (CO). Formic acid oxidation (FAO) happens in one of two main pathways (Scheme 1), direct (eqn (1) or (4)) and indirect (eqn (2) plus (3)).5,6| HCOOH → COOHads → CO2 + 2H+ + 2e− | (1) |
| HCOOH → COads + H2O | (2) |
| COads + H2O → CO2 + 2H+ + 2e− | (3) |
| HCOOH → HCOOads → CO2 + 2H+ + 2e− | (4) |
In the indirect pathway (IDPW), FA chemically dissociates at the catalyst surface resulting in the formation of CO which transforms into CO2 at potentials positive enough to dissociate water (Scheme 1). The step of eqn (3) is problematic because as CO forms, at low potentials, it accumulates on the surface of the catalyst lowering the overall efficiency of the fuel cell (FC). While the direct pathway (DPW) (eqn (1)) skip this step and result in CO2 formation directly making this pathway much more favorable. Another form of the DPW is called the formate pathway,7,8 where the adsorbed intermedia is HCOO. Even though both eqn (1) and (4) do not include the formation of CO, the DPW through eqn (1) is more favorable. Computational calculations showed that the formate pathway in eqn (4) needs more energy than the DPW in eqn (1), based on the order in which the bonds to be broken.7,8
The IDPW could be reduced/eliminated by fuel or catalyst modifications among other methods.9,10 Platinum11,12 and palladium13 are the most commonly used catalysts in DFAFC and they have been used in many different combinations and morphologies (Pd/Pt, Pt/Ru, etc.).14–20 Palladium is the most active towards FAO in acidic media,21,22 but it could be easily poisoned by adsorbed CO especially at high FA concentrations, which are needed to get high energy densities.13 The adsorbed CO could be removed/oxidized, but at high overpotentials.23 On the other hand, fuel modifications were included, using organic materials, to initially prevent the CO formation pathway.9 FA blends with methanol and other alcohols were studied using platinum-based catalysts,24 that had catalytic activity to oxidize these alcohols as well,25 showing synergistic enhancement towards the oxidation of the blend components. The effect of the blend on the presence/absence of the FA IDPW was not clear since the formic acid concentration was low (0.3 M). Pallidum is one of the most active metals towards (EOR) in alkaline medium,26–29 however it is inactive towards ethanol oxidation reaction (EOR) in acidic medium.30–33 As shown in (Scheme 1). Ethanol is expected to competitively adsorb against FA molecules which may affect the FA mechanism.
In this paper, we tested the Pd/C catalytic activity towards FAO using different FA concentrations up to 4 M in the absence and presence of ethanol, aiming to investigate the effect of ethanol on the FAO mechanism at Pd and the Pd resistance to poisoning. While, in this study, the acidic media was selected to eliminate the overlap between EOR and FAO-related activities.
Experimental
Formic acid 68% (Sigma-Aldrich), sulphuric acid (98%, Sigma-Aldrich), absolute ethanol (Sigma-Aldrich), and Pd/C (40% Pd) catalyst (Fuel cell store) were employed. The as-received Pd/C catalyst was activated via annealing, under a flow of H2/N2 gas mixture for 1 hour at 200 °C. The as received and the annealed catalysts were characterized using X-ray powder diffraction (XRD) and transmission electron microscopy (TEM) to verify the size and distribution of palladium nanoparticles.The annealed sample is used for all the electrochemical tests. Cyclic voltammetry (CV), with a scan rate of (20 mV s−1), is used to investigate the electrode performance towards FAO in the presence of different ethanol/formic acid fuel bends in deaerated 0.1 M H2SO4 solution. Formic acid concentrations were (0.5; 1; 2 and 4 M) while ethanol concentrations ranged from 2 × 10⁻³ to 0.5 M. For the Pd stability in acidic media, 100 CVs with 20 mV s−1 scan rate were performed in 0.1 M H2SO4 using different upper potentials of 0.39, 0.05, and −0.3 V. To test the Pd resistance to poisoning, chronopotentiometry (CP) experiments at different currents and FA concentrations in presence and absence of ethanol were performed. A three-electrode cell system is used in which a glassy carbon electrode (7 mm dia.) coated with a catalyst layer, Hg/HgSO4(Sat. K2SO4) mercury sulfate electrode (MSE), and gold mesh are used as the working, reference, and counter electrodes, respectively. The catalyst layer is formed by depositing 10 μL of the Pd/C catalyst ink (5 mg Pd/C, 600 μL IPA, 150 μL 1% Nafion, 150 μL EtOH, and 100 μL H2O) on the surface of the GC electrode.
Results and discussion
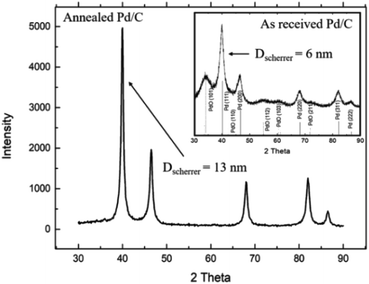
Fig. 1 shows the XRD patterns for the as-received and the annealed Pd/C catalyst. As seen Fig. 1 inset, the XRD spectrum for the as-received Pd/C catalyst exhibits different diffraction peaks at 2θ of 39.58°, 46.03°, 67.14°, 80.84°, and 85.25°, corresponding to the (111), (200), (220), (311), and (222) plans with interplaying distances (d) of 2.274, 1.97, 1.39, 1.188, and 1.137 Å, respectively, characteristic of cubic Pd metal (JPCDF card no. 46-1043). Besides, the characteristic peaks for PdO at 2θ of 33.9°, 55.10°, and 62.6° corresponding to the (101), (112), and (103) were observed.The XRD spectrum for the annealed Pd/C catalyst shows the disappearance of the PdO characteristic peaks, while the characteristic peaks of Pd became sharper. Based on the full width at half maximum (FWHM) of the (111) XRD peak, the average crystal size (D) of Pd nanoparticles was calculated to be 6, and 13 nm, using Scherer's equation,34 for the as-received and annealed Pd/C, respectively.
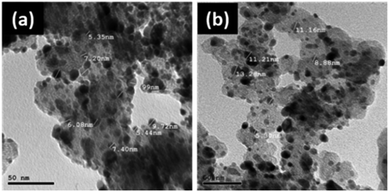
TEM images of the catalyst in (Fig. 2) show that the Pd NPs are well distributed on the carbon support, showing an increase in the average particle size from 5 nm to 17 nm after annealing, as supported by the XRD results. This increase in the size of the Pd nanoparticles is caused by sintering during annealing.
CVs were collected in absence of FA and EtOH to assure that the same catalyst layer is used. CVs, in presence of EtOH only, were collected to examine the Pd catalytic activity towards ethanol oxidation reaction (EOR). Also, the catalyst was tested in presence of only FA to test the effect of adding EtOH to the fuel blends on the Pd activity towards FAO.
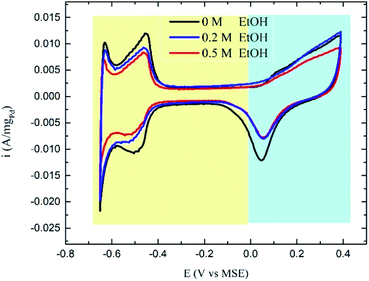
The CVs in ethanol + H2SO4 solutions showed no apparent peaks for ethanol oxidation (Fig. 3), which proves that the Pd/C catalyst has no activity towards EOR in the acidic medium as stated above. However, a slight decrease in the hydrogen underpotential deposition (HUPD) and the PdO formation peaks' current was noticed in presence of ethanol caused by the competitive adsorption of ethanol and hydrogen at the catalyst surface at low potentials, while competing with water molecules at high potentials (Scheme 1).
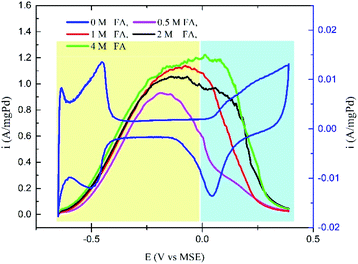
Fig. 4 shows the effect of increasing the FA concentration on the selectivity of the Pd/C catalyst towards the DPW and IDPW of the FAO. All the CV curves for FAO in 0.1 M H2SO4 solution showed two distinct peaks corresponding to the direct (E < 0.0 vs. MSE) and indirect (E > 0.0 V vs. MSE) pathways.35 A slight increase in the DPW and a significant increase in the IDPW currents were observed with increasing the FA concentration. The increase in the IDPW current is due to the CO accumulation on the catalyst surface as the FA concentration increases, which in turn means an increase in the poisoning possibility during the run at low potentials. However, that poisoning effect on the DPW is hard to be observed using CV due to the dynamic nature of the CV, giving insufficient time for poisoning species to accumulate.
In the first fuel blend, an FA concentration of 0.5 M (FA-0.5) is used. At low FA concentration, the DPW of FAO is shown to be favorable (Fig. S1†), and hence the addition of ethanol at concentrations as low as 2 mM was enough to induce the DPW even more. The continuous increase in ethanol concentration, up to 20 mM, finally led to an overall decrease in the FAO current due to the ethanol molecule occupation of the catalyst sites.24 In the second fuel blend, a 1 M FA (FA-1) solution is used. As shown in Fig. 4, the IDPW current for FA-1 is higher than the case of FA-0.5. The addition of ethanol at small amounts (2 mM) led to the same enhancing effect while the continuous addition led to the overall decrease in FAO activity similar to what has been noticed in FA-0.5 (Fig. S2†). In the case of the FA-2 (2 M FA) solution, the addition of ethanol suppressed the FAO IDPW but higher amounts of ethanol were needed to have the same influence noticed in FA-0.5 and FA-1 (Fig. S3†).
Fig. 5a shows the CV curves for the FA-4 fuel blends in which the addition of ethanol inhibited the current related to the IDPW with a minimum effect on the DPW current. Fig. 5b represents the relation between the concentrations of ethanol in the FA-4 fuel blend with the direct/indirect oxidation current ratio. The addition of ethanol increased the ratio in all cases with the FA-4 fuel blend with 0.05 M EtOH having the highest ratio.
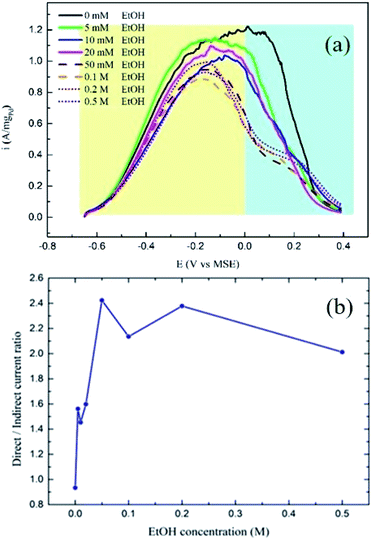 | ||
| Fig. 5 (a) CV curves for FA-4 fuel blends with different ethanol concentrations, and (b) demonstrates the EtOH concentration effect on the direct/indirect currents for FA-4 fuel blends. | ||
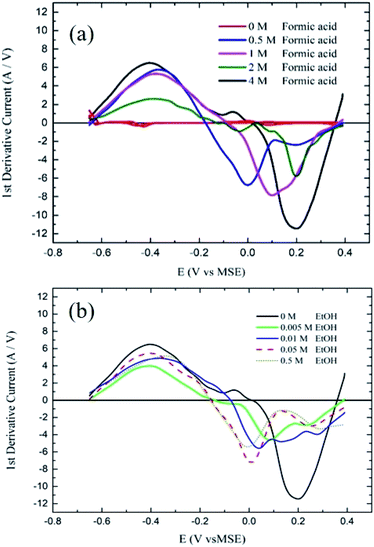
The first derivatives (FD) of the cyclic voltammetry data were drawn to get a clearer look into the activity with less background interference and to easily distinguish between the FA oxidation DPW and IDPW peaks. Fig. 6a shows the first derivative of the cyclic voltammetry data reported in Fig. 4. The two peaks related to the DPW and IDPWof FA oxidation overlap in the CV curve. The deconvolution of the CV curve gives two distinct curves for each pathway, and the first derivative for each curve should give a harmonic curve (Fig. S4†). Therefore, the first derivative of the CV curve for FA oxidation is a combination of the two harmonic curves of the direct and indirect oxidation pathway.
It can be seen from Fig. 6a that the 0.5 M FA starts with normal harmonic behavior showing a peak maxima at ≈−0.4 V that are related to the FA oxidation DPW, intercepts the zero lines which represent Ep (from the CV, Fig. 4), and starts to move in the negative direction. However, a change in the shape was observed due to the overlap with the IDPW curve, showing another minimum at 0.2 V for the IDPW curve. With increasing the FA concentration the point of intercept with the zero-line shifts towards the position of the indirect oxidation region and the contribution of the IDPW curve becomes much higher. When the line starts to move in the negative direction, the COads continue to be oxidized to CO2. However, at the same time, OH groups start to form on the Pd surface as shown in Fig. 4, with the lowest point of the curve reflects the point at which half of the surface is occupied by OH groups. The line starts to move in a less negative direction with further surface coverage by OH groups until of intercept with the zero-line again. At high concentrations of FA, many COads species are present, causing more intense peaks as demonstrated in Fig. 6a.
When ethanol and FA-4 fuel blends were used, Fig. 6b shows that the addition of the smallest amount of ethanol reduced the intensity of the 0.2 V-minimum associated with the IDPW and shifted the curve shape towards a more normal harmonic DPW curve. When the amount of ethanol reached 50 mM, the intensity of the peak and the shape of the derivative curve were almost identical to the shape of the 0.5 M FA solution. This means that the addition of small amounts of ethanol could greatly reduce the IDPW. Further addition of ethanol up to 0.5 M did not cause any further enhancement on the catalyst activity.
According to the previous CV results, adding ethanol is suggested to affect FAO reactions by only inhibiting the IDPW up to an optimum ethanol concentration then starts to inhibit the DPW also. As shown in Scheme 1, ethanol molecules at high potential could adsorb in a specific orientation that is believed to compete and lower the possibility of FA adsorption orientation that leads to CO or formate adsorption36–39 and allowing the FA orientation that leads to the DPW for FAO. However, after a certain limit depending on the FA concentration, ethanol molecules will occupy more catalyst active sites lowering both DPW and IDPW currents.
In this study, we showed that the presence of ethanol could change the FAO oxidation mechanism and inhibits the IDPW. However, the long-term instability of Pd/C catalyst in acidic media29,40,41 makes it difficult to differentiate between the catalyst poisoning versus catalyst instability as a reason behind the Pd catalyst deactivation with cycling, using CV technique. Fig. S5† shows a comparison between the 1st and the 100th CV (20 mV s−1) for Pd/C catalyst in 0.1 M H2SO4 using different upper potentials of 0.39, 0.05, and −0.3 V vs. MSE. The Pd catalyst is found to lose 58.5, 33.3, and 16.5% of its surface area after 100 cycles when the 0.39, 0.05, and −0.3 V were used as upper potential, respectively. That indicates the instability of the Pd in acidic media during CV, depending greatly on the upper potential and hence the Pd oxidation state. Therefore, we believe that cyclic voltammetry is not suitable to differentiate between catalyst poisoning versus catalyst instability. To test the catalyst poisoning at low potentials in which the DPW is dominant, with a minimum contribution from the catalyst instability, the chronopotentiometry (CP) method was used.42
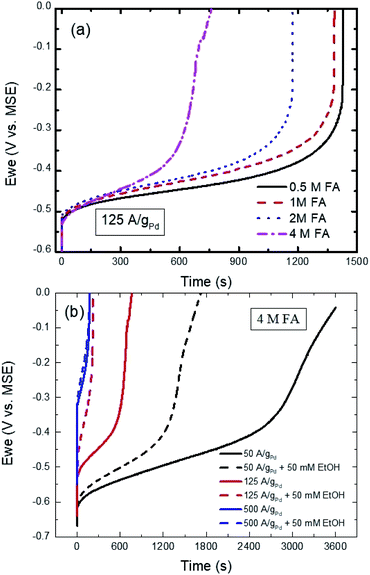
Since the FAO, in the concentration range understudy, is not concentration dependant as seen in Fig. 4, the transition time of the CP curve should not reflect the FA surface concentration but the point at which the number of active sites available for FAO starts to decrease dramatically due to poisoning and/or the competitive adsorption with ethanol that reduces the number of active sites and forces the potential to move to a higher value to fulfill the applied current.43,44
Fig. 7a shows the effect of changing the FA concentration on the CP curves of Pd/C at 125 A gPd−1 in 0.1 M H2SO4. As could be seen the initial potential for all the concentrations is almost the same as observed in the CV response (Fig. 4). However, as the FA concentration increases the transition time starts to shorten due to the poisoning IDPW, which is known to increase with increasing the FA concentration as confirmed with Fig. 4. In addition, the transition time is found to inversely depend on the applied current as shown in Fig. 7b, indicating that with applying a higher current the potential shifts to a higher potential causing even a higher contribution of the poisoning IDPW.
In the presence of ethanol, even at low current (50 A gPd−1), adding ethanol to 4 M FA solution caused a decrease in the transition time (Fig. S6†) due to the competitive adsorption between ethanol and DPW ethanol and FA molecules with similar orientations at low potentials (Scheme 1). Even though EtOH is shown to adsorb at the surface of Pd in this potential range according to Fig. 3. However, that did not show any inhibiting effect on the DPW according to the CV results (Fig. 5 and 6). This contradiction between the CV and CP results indicates that, at this potential range, EtOH adsorps slowly on the surface, and hence its effect was not captured using CV. As the applied current increased to 500 A gPd−1 the competitive adoption between ethanol and FA decreased to a minimum showing almost an identical response (Fig. 7b). These results indicate that ethanol adsorption at low potentials is week and needs time to affect the DPW, while at high potentials it is strong and could cause a complete suppression of the IDPW.
Conclusions
It was found that the addition of ethanol in all fuel blends inhibits the FA indirect oxidation pathway and the amount of ethanol was dependent on the FA concentration. According to the CV results, the FA-4 fuel blend with 0.05 M ethanol showed the highest direct oxidation current with a minimum IDPW related current. However, the use of too high concentrations of ethanol leads to an overall decrease in the catalyst activity towards FA oxidation. The use of the first derivate method allowed for a better demonstration of the peaks associated with the direct and indirect oxidation pathway even when it was not very clear in the cyclic voltammetry curves and it showed that this method could be used for a better understanding of the mechanism of FA oxidation. In addition to cyclic voltammetry, using chronopotentiometry added a deeper understanding of the competitive adsorption between FA and ethanol at low potentials, showing that the presence of ethanol will inhibited also the DPW but needs a longer time to do so. This work should open the door and lead to a better design for studying the oxidation of FA/ethanol blends using different pHs and different Pd-based catalysts.Conflicts of interest
The authors declare that they have no conflict of interest.Acknowledgements
The authors are thankful to the American University in Cairo for supporting this work.References
- H. Zhang, J. He, C. Zhai and M. Zhu, 2D Bi2WO6/MoS2 as a New Photo-Activated Carrier for Boosting Electrocatalytic Methanol Oxidation with Visible Light Illumination, Chin. Chem. Lett., 2019, 30(12), 2338–2342, DOI:10.1016/j.cclet.2019.07.021.
- J. Hu, C. Zhai and M. Zhu, Photo-Responsive Metal/Semiconductor Hybrid Nanostructure: A Promising Electrocatalyst for Solar Light Enhanced Fuel Cell Reaction, Chin. Chem. Lett., 2021, 32(4), 1348–1358, DOI:10.1016/j.cclet.2020.09.049.
- X. Wang, H. Gao, C. Zhai, Z. He, C. Yuan and M. Zhu, Newly-Found Photoactivated Pt Anchored on Three-Dimensional Layered WS2/Carbon Cloth for Highly Efficient Ethylene Glycol Electro-Oxidation, Ind. Eng. Chem. Res., 2020, 59(43), 19252–19259, DOI:10.1021/acs.iecr.0c03436.
- J. Sun, X. Luo, W. Cai, J. Li, Z. Liu, J. Xiong and Z. Yang, Ionic-Exchange Immobilization of Ultra-Low Loading Palladium on an RGO Electro-Catalyst for High Activity Formic Acid Oxidation, RSC Adv., 2018, 8(33), 18619–18625, 10.1039/c8ra03043j.
- K. Jiang, H.-X. Zhang, S. Zou and W.-B. Cai, Electrocatalysis of Formic Acid on Palladium and Platinum Surfaces: From Fundamental Mechanisms to Fuel Cell Applications, Phys. Chem. Chem. Phys., 2014, 16(38), 20360–20376, 10.1039/c4cp03151b.
- T. Gunji and F. Matsumoto, Electrocatalytic Activities towards the Electrochemical Oxidation of Formic Acid and Oxygen Reduction Reactions over Bimetallic, Trimetallic, and Core–Shell-Structured Pd-Based Materials, Inorganics, 2019, 7(3), 36, DOI:10.3390/inorganics7030036.
- M. Neurock, M. Janik and A. Wieckowski, A First-Principles Comparison of the Mechanism and Site Requirements for the Electrocatalytic Oxidation of Methanol and Formic Acid over Pt, Faraday Discuss., 2009, 140, 363–378, 10.1039/b804591g.
- J. Xu, D. Yuan, F. Yang, D. Mei, Z. Zhang and Y.-X. Chen, On the Mechanism of the Direct Pathway for Formic Acid Oxidation at a Pt(111) Electrode, Phys. Chem. Chem. Phys., 2013, 15(12), 4367, 10.1039/c3cp44074e.
- V. Briega-Martos, J. Solla-Gullón, M. T. M. Koper, E. Herrero and J. M. Feliu, Electrocatalytic Enhancement of Formic Acid Oxidation Reaction by Acetonitrile on Well-Defined Platinum Surfaces, Electrochim. Acta, 2019, 295, 835–845, DOI:10.1016/j.electacta.2018.11.016.
- J. Song, H. Zhong, H. Wu, Z. Xiao, H. Song, T. Shu and J. Zeng, Robust and Efficient Pd–Cu Bimetallic Catalysts with Porous Structure for Formic Acid Oxidation and a Mechanistic Study of Electrochemical Dealloying, Electrocatalysis, 2021, 12(2), 117–126, DOI:10.1007/s12678-020-00632-9.
- K. A. Schwarz, R. Sundararaman, T. P. Moffat and T. C. Allison, Formic Acid Oxidation on Platinum: A Simple Mechanistic Study, Phys. Chem. Chem. Phys., 2015, 17(32), 20805–20813, 10.1039/c5cp03045e.
- Y. Yang, H. Huang, B. Shen, L. Jin, Q. Jiang, L. Yang and H. He, Anchoring Nanosized Pd on Three-Dimensional Boron- and Nitrogen-Codoped Graphene Aerogels as a Highly Active Multifunctional Electrocatalyst for Formic Acid and Methanol Oxidation Reactions, Inorg. Chem. Front., 2020, 7(3), 700–708, 10.1039/c9qi01448a.
- N. Uwitonze and Y. X. Chen, The Study of Pt and Pd Based Anode Catalysis for Formic Acid Fuel Cell, Chem. Sci. J., 2017, 8(3), 167 Search PubMed.
- E. N. E. Sawy, M. A. Khan and P. G. Pickup, Factors Affecting the Spontaneous Adsorption of Bi(III) onto Pt and PtRu Nanoparticles, Appl. Surf. Sci., 2016, 364, 308–314, DOI:10.1016/j.apsusc.2015.12.168.
- E. N. El Sawy and P. G. Pickup, Carbon Monoxide and Formic Acid Oxidation at Rh@Pt Nanoparticles, Electrochim. Acta, 2019, 302, 234–240, DOI:10.1016/j.electacta.2019.02.047.
- C. McKeown and F. M. F. Rhen, Pt-Au Film Catalyst for Formic Acid Oxidation, Procedia Eng., 2017, 215, 211–218, DOI:10.1016/j.proeng.2017.11.011.
- G. A. El-Nagar, F. Muench and C. Roth, Tailored Dendritic Platinum Nanostructures as a Robust and Efficient Direct Formic Acid Fuel Cell Anode, New J. Chem., 2019, 43(10), 4100–4105, 10.1039/c8nj06172f.
- B. Pramanick, T. Kumar, A. Halder and P. F. Siril, Engineering the Morphology of Palladium Nanostructures to Tune Their Electrocatalytic Activity in Formic Acid Oxidation Reactions, Nanoscale Adv., 2020, 2(12), 5810–5820, 10.1039/d0na00798f.
- M. Tang, W. Chen, S. Luo, X. Wu, X. Fan, Y. Liao, X. Song, Y. Cheng, L. Li, L. Tan, Y. Liu and Z. Quan, Trace Pd Modified Intermetallic PtBi Nanoplates towards Efficient Formic Acid Electrocatalysis, J. Mater. Chem. A, 2021, 9(15), 9602–9608, 10.1039/d1ta01123e.
- B. Ulas, A. Caglar, A. Kivrak, N. Aktas and H. Kivrak, Tailoring the Metallic Composition of Pd, Pt, and Au Containing Novel Trimetallic Catalysts to Achieve Enhanced Formic Acid Electrooxidation Activity, Ionics, 2020, 26(6), 3109–3121, DOI:10.1007/s11581-020-03444-5.
- C. Rettenmaier, R. M. Arán-Ais, J. Timoshenko, R. Rizo, H. S. Jeon, S. Kühl, S. W. Chee, A. Bergmann and B. Roldan Cuenya, Enhanced Formic Acid Oxidation over SnO 2 -Decorated Pd Nanocubes, ACS Catal., 2020, 10(24), 14540–14551, DOI:10.1021/acscatal.0c03212.
- A. Gharib and A. Arab, Improved Formic Acid Oxidation Using Electrodeposited Pd–Cd Electrocatalysts in Sulfuric Acid Solution, Int. J. Hydrogen Energy, 2021, 46(5), 3865–3875, DOI:10.1016/j.ijhydene.2020.10.202.
- A. Ferre-Vilaplana, J. V. Perales-Rondón, C. Buso-Rogero, J. M. Feliu and E. Herrero, Formic Acid Oxidation on Platinum Electrodes: A Detailed Mechanism Supported by Experiments and Calculations on Well-Defined Surfaces, J. Mater. Chem. A, 2017, 5(41), 21773–21784, 10.1039/c7ta07116g.
- G. A. El-Nagar, A. M. Mohammad, M. S. El-Deab and B. E. El-Anadouli, Novel Fuel Blends Facilitating the Electro-Oxidation of Formic Acid at a Nano-Pt/GC Electrode, RSC Adv., 2016, 6(35), 29099–29105, 10.1039/c6ra00118a.
- V. S. Menshikov, I. N. Novomlinsky, S. V. Belenov, A. A. Alekseenko, O. I. Safronenko and V. E. Guterman, Methanol, Ethanol, and Formic Acid Oxidation on New Platinum-Containing Catalysts, Catalysts, 2021, 11(2), 158, DOI:10.3390/catal11020158.
- J. Liu, J. Ye, C. Xu, S. P. Jiang and Y. Tong, Kinetics of Ethanol Electrooxidation at Pd Electrodeposited on Ti, Electrochem. Commun., 2007, 9(9), 2334–2339, DOI:10.1016/j.elecom.2007.06.036.
- M. D. Obradović, Z. M. Stančić, U. Č. Lačnjevac, V. V. Radmilović, A. Gavrilović-Wohlmuther, V. R. Radmilović and S. L. Gojković, Electrochemical Oxidation of Ethanol on Palladium-Nickel Nanocatalyst in Alkaline Media, Appl. Catal., B, 2016, 189, 110–118, DOI:10.1016/j.apcatb.2016.02.039.
- L. M. Palma, T. S. Almeida and A. R. de Andrade, Comparative Study of Catalyst Effect on Ethanol Electrooxidation in Alkaline Medium: Pt- and Pd-Based Catalysts Containing Sn and Ru, J. Electroanal. Chem., 2020, 878, 114592, DOI:10.1016/j.jelechem.2020.114592.
- B. Cermenek, B. Genorio, T. Winter, S. Wolf, J. G. Connell, M. Roschger, I. Letofsky-Papst, N. Kienzl, B. Bitschnau and V. Hacker, Alkaline Ethanol Oxidation Reaction on Carbon Supported Ternary PdNiBi Nanocatalyst Using Modified Instant Reduction Synthesis Method, Electrocatalysis, 2020, 11(2), 203–214, DOI:10.1007/s12678-019-00577-8.
- L. L. Carvalho, A. A. Tanaka and F. Colmati, Palladium-Platinum Electrocatalysts for the Ethanol Oxidation Reaction: Comparison of Electrochemical Activities in Acid and Alkaline Media, J. Solid State Electrochem., 2018, 22(5), 1471–1481, DOI:10.1007/s10008-017-3856-0.
- Y. Wang, S. Zou and W.-B. Cai, Recent Advances on Electro-Oxidation of Ethanol on Pt- and Pd-Based Catalysts: From Reaction Mechanisms to Catalytic Materials, Catalysts, 2015, 5(3), 1507–1534, DOI:10.3390/catal5031507.
- A. N. Geraldes, Pd/MWCNT and PdAuSn/MWCNT Electrocatalysts, São Paulo, 2015, p. 9 Search PubMed.
- Q. Zhang, T. Chen, R. Jiang and F. Jiang, Comparison of Electrocatalytic Activity of Pt 1−x Pd x/C Catalysts for Ethanol Electro-Oxidation in Acidic and Alkaline Media, RSC Adv., 2020, 10(17), 10134–10143, 10.1039/d0ra00483a.
- B. D. Cullity and R. Smoluchowski, Elements of X-Ray Diffraction, Phys. Today, 1957, 10(3), 50, DOI:10.1063/1.3060306.
- M. Rezaei, S. H. Tabaian and D. F. Haghshenas, The Role of Electrodeposited Pd Catalyst Loading on the Mechanisms of Formic Acid Electro-Oxidation, Electrocatalysis, 2014, 5(2), 193–203, DOI:10.1007/s12678-013-0181-y.
- E. Leiva, T. Iwasita, E. Herrero and J. M. Feliu, Effect of Adatoms in the Electrocatalysis of HCOOH Oxidation. A Theoretical Model, Langmuir, 1997, 13(23), 6287–6293, DOI:10.1021/la970535e.
- A. Cuesta, G. Cabello, C. Gutiérrez and M. Osawa, Adsorbed Formate: The Key Intermediate in the Oxidation of Formic Acid on Platinum Electrodes, Phys. Chem. Chem. Phys., 2011, 13(45), 20091, 10.1039/c1cp22498k.
- C. Busó-Rogero, J. V. Perales-Rondón, M. J. S. Farias, F. J. Vidal-Iglesias, J. Solla-Gullon, E. Herrero and J. M. Feliu, Formic Acid Electrooxidation on Thallium-Decorated Shape-Controlled Platinum Nanoparticles: An Improvement in Electrocatalytic Activity, Phys. Chem. Chem. Phys., 2014, 16(27), 13616–13624, 10.1039/c4cp00304g.
- G. A. El-Nagar, A. M. Mohammad, M. S. El-Deab and B. E. El-Anadouli, Novel Fuel Blends Facilitating the Electro-Oxidation of Formic Acid at a Nano-Pt/GC Electrode, RSC Adv., 2016, 6(35), 29099–29105, 10.1039/c6ra00118a.
- S. Liu, Z. Wang, H. Zhang, S. Yin, Y. Xu, X. Li, L. Wang and H. Wang, B-Doped PdRu Nanopillar Assemblies for Enhanced Formic Acid Oxidation Electrocatalysis, Nanoscale, 2020, 12(37), 19159–19164, 10.1039/d0nr05464j.
- M. Soszko, M. Łukaszewski and A. Czerwiński, Electrochemical Dissolution of Pt-Pd-Ru Alloys, J. Electroanal. Chem., 2020, 877, 114547, DOI:10.1016/j.jelechem.2020.114547.
- L. Y. Zhang, Z. L. Zhao and C. M. Li, Formic Acid-Reduced Ultrasmall Pd Nanocrystals on Graphene to Provide Superior Electrocatalytic Activity and Stability toward Formic Acid Oxidation, Nano Energy, 2015, 11, 71–77, DOI:10.1016/j.nanoen.2014.10.008.
- H. A. El-Sayed, A. Weiß, L. F. Olbrich, G. P. Putro and H. A. Gasteiger, OER Catalyst Stability Investigation Using RDE Technique: A Stability Measure or an Artifact?, J. Electrochem. Soc., 2019, 166(8), F458, DOI:10.1149/2.0301908jes.
- M. Fathi Tovini, A. Hartig-Weiß, H. A. Gasteiger and H. A. El-Sayed, The Discrepancy in Oxygen Evolution Reaction Catalyst Lifetime Explained: RDE vs. MEA - Dynamicity within the Catalyst Layer Matters, J. Electrochem. Soc., 2021, 168(1), 014512, DOI:10.1149/1945-7111/abdcc9.
Footnote |
| † Electronic supplementary information (ESI) available. See DOI: 10.1039/d1ra01209f |
| This journal is © The Royal Society of Chemistry 2021 |

