 Open Access Article
AuNP array coated substrate for sensitive and homogeneous SERS-immunoassay detection of human immunoglobulin G†
Qi Qu‡
a,
Jing Wang‡a,
Chuan Zengd,
Mengfan Wang *ac,
Wei Qiabc and
Zhimin Hea
aSchool of Chemical Engineering and Technology, State Key Laboratory of Chemical Engineering, Tianjin University, Tianjin 300350, P. R. China. E-mail: mwang@tju.edu.cn
bThe Co-Innovation Centre of Chemistry and Chemical Engineering of Tianjin, Tianjin 300072, P. R. China
cTianjin Key Laboratory of Membrane Science and Desalination Technology, Tianjin 300350, P. R. China
dTechnical Center of Zhuhai Entry-Exit Inspection and Quarantine Bureau, Zhuhai, P. R. China
First published on 28th June 2021
Abstract
Owing to the high sensitivity, fast responsiveness and high specificity, immunoassays using surface-enhanced Raman scattering (SERS) as the readout signal displayed great potential in disease diagnosis. In this study, we developed a SERS-immunoassay method for the detection of human immunoglobulin G (HIgG). Upon involving well-ordered AuA on a SERSIA substrate, the LSPR effect was further enhanced to generate a strong and uniform Raman signal through the formation of sandwich structure with the addition of target HIgG and SERSIA tag. Optimization of the assay provided a wide linear range (0.1–200 μg mL−1) and low limit of detection (0.1 μg mL−1). In addition, the SERS-immunoassay method displayed excellent specificity and was homogeneous, which guaranteed the practical use of this method in the quantitative detection of HIgG. To validate this assay, human serum was analysed, which demonstrated the potential advantages of SERS-immunoassay technology in clinical diagnostics.
1 Introduction
Human immunoglobulin G (HIgG) is the main antibody component in human serum, which plays an important role in defending against various destructive substances, such as viruses or bacteria.1–4 The HIgG level in healthy adults ranges from 7 mg mL−1 to 18 mg mL−1, but this value is usually altered associated with some diseases, such as rheumatoid arthritis, infectious, humoral immune deficiency, and liver and metabolic diseases.5–7 Therefore, the detection of HIgG in human serum is important for the early diagnosis and effective treatment of related diseases.8Immunoassay based on the specific interaction between an antigen and antibody is a powerful analytical method, which has become a popular tool for clinical diagnosis.9–12 Based on different labelling techniques, many immunoassay methods have been developed for the detection of biomarkers in human serum, such as fluorescence immunoassay (FIA),13 enzyme-linked immunosorbent assay (ELISA)14 and chemiluminescence immunoassay (CLIA). Although effective, these methods still have some limitations. For example, the fluorescent signal is often disturbed by environment and suffered from undesirable photobleaching or self-fluorescence,15 while the enzyme or chemiluminescence reactions usually time consuming, require special substrates and have certain harm to environment.16–18
Surface enhanced Raman scattering (SERS) is a fast, stable and highly sensitive spectroscopic technology, which has led to great achievements in environmental monitoring, food safety supervision and biological imaging.19–21 Upon coupling SERS with immunoassay, the developed SERS-immunoassay method expanded the analyte scope, and thus attracted growing interest in medicine diagnosis.22,23 Due to the significant localized surface plasmon resonance (LSPR) effect of molecules on or near the surface of noble metal nanostructures,24 antibodies are usually labelled with AgNPs or AuNPs embedded with Raman probe to achieve the sensitive detection of immune binding compounds. Based on different physical platforms, SERS-immunoassay methods can be established on solid substrates, liquid microbeads, papers, microfluidic chips, optical waveguides, etc.25–29 Among these platforms, solid substrates are well-adopted due to the convenient operation in biomolecular capture, target analyte separation, and signal transduction. For example, Huang et al. constructed a sandwich structure for the SERS-immunoassay detection of albumin. The anti-albumin capture antibodies were encapsulated on a polydopamine functionalized glass chip, and the detection antibodies were labeled by AuNPs probed with 4-mercaptopyridine. The immunoaffinity was highly maintained to form the sandwich structure with the addition of target microalbuminuria.16 Villa et al. presented a SERS-immunoassay biosensor based on an Au-sputtered glass slide. Compared with the ordinary glass slide, the Au-sputtered solid substrate provided additional signal enhancement via coupling with SERS tags.9
In this study, we developed a SERS-immunoassay method for the detection of HIgG. The method includes the preparation of the SERSIA tag with 4-aminothiophenol (4-ATP) as Raman prober (Scheme 1A) and the AuNP array (AuA)-coated solid SERSIA substrate (Scheme 1B). Generally, metallic substrates are fabricated by microelectronics technology. In our previous study, we reported the fabrication of well-organized AuA through hexane/water interface self-assembly, which is easy and convenient for the construction of SERS sensors.30 Herein, the AuA was further employed to fabricate the solid SERSIA substrate. The coupled LSPR effect between the AuA and AuNPs in SERSIA tags enhances the local electromagnetic field, which is favorable for improving the sensitive and homogeneous detection of disease-related biomarkers based on the SERS-immunoassay platform (Scheme 1C). Eventually, the developed SERS-immunoassay method was proved to be effective for HIgG detection in human serum, confirming its potential for application in real sample analysis.
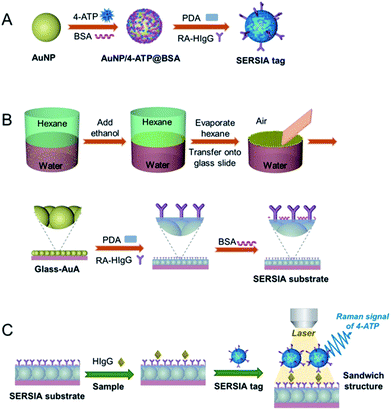 | ||
| Scheme 1 Schematic illustration of the synthesis of SERSIA tag (A), the fabrication of SERSIA substrate (B), and the SERS-immunoassay method for the detection of HIgG (C). | ||
2 Experimental
2.1 Chemicals and materials
Dopamine hydrochloride, hydrogen tetrachloroaurate (HAuCl4·3H2O), trisodium citrate, bovine serum albumin (BSA), tris(hydroxymethyl)aminoethane (Tris) were purchased from Aladdin (Shanghai, China). Human hemoglobin (Hgb) and human serum albumin (HSA) were purchased from Sigma-Aldrich. 4-ATP was purchased from Macklin (Shanghai, China). HIgG and rabbit anti-human IgG (RA-HIgG) were provided by Haosai Technology Co. Ltd (Beijing, China). Human serum samples were obtained from Hospital of Tianjin University. Other chemicals were obtained from commercial sources and used as provided.2.2 Synthesis of AuNPs
AuNPs were synthesized according to Frens' method with some improvement.30,31 1 mL of 1% HAuCl4 solution was dissolved into 99 mL of ultrapure water, and then heated up to the boiling temperature under intense stirring. Then, 2 mL of 1% trisodium citrate solution was rapidly added. After 30 minutes, the solution color changed from light yellow to purplish red, indicating that the reaction was accomplished. Then, 8 mL of the obtained AuNP solution was centrifuged at 10![[thin space (1/6-em)]](https://www.rsc.org/images/entities/char_2009.gif) 000 rpm for 10 min to collect the AuNPs. The AuNPs were then dispersed into 1 mL ultra-pure water by ultrasonic method to obtain the final AuNP solution.
000 rpm for 10 min to collect the AuNPs. The AuNPs were then dispersed into 1 mL ultra-pure water by ultrasonic method to obtain the final AuNP solution.
2.3 Fabrication of the SERSIA tag
4-ATP was dissolved into ethanol to a concentration of 1 mM. BSA was dissolved in PBS buffer (10 mM, pH 7.4) to a concentration of 1% (w/v). 60 μL of 4-ATP solution was added into 600 μL of the AuNP solution obtained in 2.2. After stirring for 45 min at room temperature, 200 μL of BSA solution were added into the solution. After stirring for 45 min at room temperature, the mixture was centrifuged at 6000 rpm for 15 min to remove the supernatant, and the precipitate was dispersed in 500 μL Tris–HCl buffer (10 mM, pH 8.8). Then, 100 μL of dopamine hydrochloride solution (5 mg mL−1) was added. After stirring for 45 min, 100 μL of RA-HIgG antibody solution (50 μg mL−1) were added. After the reaction at room temperature for 1 h, the supernatant was removed by centrifugation at 6000 rpm for 15 min, and the precipitate was repeatedly washed by Tris–HCl buffer (10 mM, pH 8.8) and finally dispersed into 500 μL of the buffer. The fabrication of SERSIA tag was shown in Fig. S1A.† The enhancement factor (EF) for SERSIA tag was calculated using the Raman peak of 4-ATP at 1080 cm−1 according to eqn (1):
 | (1) |
2.4 Fabrication of the SERSIA substrate
AuA was obtained according to our previously reported method.30 2 mL of the AuNP solution obtained in 2.2 were further diluted to 4 mL with ultra-pure water, and added into a Petri dish with a diameter of 35 mm. Then, 2 mL of hexane was successively added to form an oil/water interface. Upon the addition of 2 mL of ethanol, AuNPs were self-assembled to form an array at the interface. After 1 h, hexane was completely evaporated, an AuA was formed at the air/water interface. A glass slide was dealt with piranha solution (98% H2SO4![[thin space (1/6-em)]](https://www.rsc.org/images/entities/char_2009.gif) :
:![[thin space (1/6-em)]](https://www.rsc.org/images/entities/char_2009.gif) 30% H2O2 = 7
30% H2O2 = 7![[thin space (1/6-em)]](https://www.rsc.org/images/entities/char_2009.gif) :
:![[thin space (1/6-em)]](https://www.rsc.org/images/entities/char_2009.gif) 3 v/v) for 12 h, washed with ultra-pure water and blow-dried with nitrogen. Then, the clean glass slide was inserted below the interface of the AuA at an inclination of 45°, and was lifted quickly to obtain an AuA-covered glass slide (Glass-AuA).
3 v/v) for 12 h, washed with ultra-pure water and blow-dried with nitrogen. Then, the clean glass slide was inserted below the interface of the AuA at an inclination of 45°, and was lifted quickly to obtain an AuA-covered glass slide (Glass-AuA).
5 mg mL−1 dopamine hydrochloric solution was prepared by adding dopamine hydrochloric in Tris–HCl buffer (10 mM, pH 8.8). The as-prepared Glass-AuA slide was then incubated in the dopamine hydrochloric solution for 1 h to form a polydopamine (PDA) layer on the AuA surface. After washing with ultra-pure water, the slide was immersed into a mixture containing 8 mL Tris–HCl buffer (10 mM, pH 8.8) and 240 μL of RA-HIgG (50 μg mL−1), and reacted for 1 h. After washing with ultra-pure water, the slide was blocked in BSA solution for 1 h, and finally washed with ultra-pure water. The fabrication of SERSIA substrate was shown in Fig. S1B.†
2.5 SERS-immunoassay detection of HIgG
HIgG was dissolved in PBS buffer (10 mM, pH 7.4) to a certain concentration. Then, 10 μL of HIgG solution was dropped on the SERSIA substrate. After incubation at 37 °C for 0.5 h, the substrate was washed with PBS buffer (10 mM, pH 7.4) and ultra-pure water, respectively. Then, 10 μL of SERSIA tag solution was added to the substrate and incubated at 37 °C. After 0.5 h, the substrate was washed with PBS buffer (10 mM, pH 7.4) and ultra-pure water, respectively (Fig. S1C†).The Raman spectrum measurement was carried out on a NTEGRA Raman system (NT-MDT, Russia) with a 633 nm excitation wavelength under a power of 300 mW. Each spectrum was obtained by one accumulation and the acquisition time was set to be 5 s.
2.6 Characterization
The UV-vis spectrum was obtained using a TU-1900 UV-vis spectrophotometer (Persee, Beijing). Transmission electron microscopy (TEM) image was obtained on a transmission electron microscope (F2100F, Hitachi, Japan), and scanning electron microscopy (SEM) image was obtained on a field emission scanning electron microscope (S-4800, Hitachi, Japan).2.7 Serum sample detection
Human serum samples were 1000-fold diluted with PBS buffer (10 mM, pH 7.4). Then, 10 μL of diluted sample was dropped on the SERSIA substrate, followed the standard process for the SERS-immunoassay detection of HIgG in buffer. In addition, human serum samples with a certain amount of spiked HIgG were also detected.3 Results and discussion
3.1 The preparation of SERSIA tag
The SERSIA tag particle consists of three components: (i) a metal core that provides LSPR effect, (ii) the prober molecule (4-ATP) that produces the detectable Raman signal, and (iii) the surficial detect antibodies for the specific binding of HIgG. Herein, AuNPs were synthesized as the plasmonic core due to their outstanding ability in enhancing SERS signal. As shown in Fig. 1A, the synthesized AuNPs are uniform spheres with an average diameter of 36 nm. To indicate the immune binding of HIgG by Raman signal, 4-ATP was embedded into the SERSIA tag due to its well-defined Raman spectrum and large Raman scattering cross section.32 4-ATP can be adsorbed on the surface of AuNPs via mercaptan–metal interactions. Then, BSA was used to form a bio-layer on the metal surface, which prohibited the interference to the metal core from environment and prevented the aggregation of the AuNPs. As shown in Fig. 1B, the obtained AuNPs/4-ATP@BSA nanoparticles were covered by a thin layer. Subsequently, PDA layer was formed through the self-polymerization of dopamine under weakly alkaline condition. Since the amine groups in proteins can be incorporated onto the PDA surface through Schiff base reaction and Michael addition,33 antibodies can be easily connected onto the nanoparticles, finally forming a SERSIA tag. TEM image revealed that after the conjunction, the outer layer thickness of the nanoparticles has grown into 5 nm (Fig. 1C), which demonstrated that PDA and RA-HIgG were connected to the AuNPs/4-ATP@BSA nanoparticles. Fig. 1D shows the UV-vis profiles of the AuNPs, AuNPs/4-ATP@BSA and the SERSIA tag, respectively. AuNPs solution displayed a characteristic absorption peak at 524 nm. Upon biological modification, the color of the solution changed from red to dark purple (Fig. S1A†), together with a red shift of the absorption peak from 524 nm to 532 nm, probably due to the change of local dielectric environment induced by the biolayer.34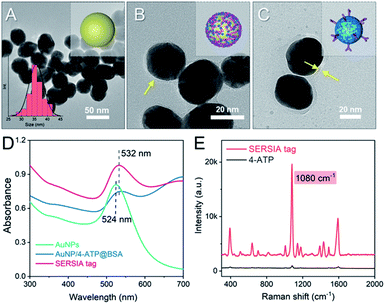 | ||
| Fig. 1 TEM images of AuNPs (A), AuNPs/4-ATP@BSA (B), SERSIA tag (C) and their UV-vis spectra (D). Raman spectra of SERSIA tag and 4-ATP solution (E). | ||
Fig. 1D displayed the Raman spectra of the SERSIA tag solution. It was found that the SERSIA tag produced a typical Raman peak of 4-ATP: the strong peaks at 392, 1080 and 1587 cm−1 assigned to the C–S bending vibration, the C–S stretching vibration and the C–C stretching vibration, respectively.35 This result indicated that the prober molecules were embedded within SERSIA tag. Enhancement factor (EF) is often used to evaluate the enhanced effect of a SERS tag. For the obtained SERSIA tag solution, the concentration of embedded 4-ATP in SERSIA tag is 1.2 × 10⁻⁴ M (assuming that all 4-ATP molecules were absorbed on the AuNPs surface). As a comparison, we also detected the Raman spectrum of a free 4-ATP solution (10 M). As shown in Fig. 1E, although the concentration of 4-ATP in the SERSIA tag solution is 8.3 × 10⁴ times lower than that in free solution, the Raman spectrum of SERSIA tag is much more intensive. Herein, the strongest characteristic peak at 1080 cm−1 was used for the quantitative analysis. According to eqn (1), the EF of SERSIA tag was 3.2 × 10⁶, which displayed superior SERS activity.
3.2 The preparation of SERSIA substrate
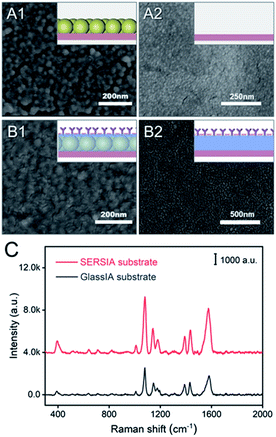
To further enhance the LSPR effect of solid substrate, a well-organized AuA was fabricated at a hexane/water interface and then transferred onto the surface of a glass. When hexane was added into the AuNP solution, an oil–water interface was immediately formed. Then, the addition of ethanol reduced the surface charge density of the AuNPs and promoted the one-layer assembly of the AuNPs at the oil–water interface. When hexane was completely evaporated, an AuA layer was formed at the air–water interface, and the solution displayed a golden luster at the surface. To transfer the AuA onto a solid support, a glass slide was carefully inserted below the interface at an inclination of 45°, and then lifted out of the solution quickly (Fig. S1B†). Fig. 2A1 shows the SEM image of the obtained Glass-AuA slide. Compared with the bare glass slide (Fig. 2A2), the surface of Glass-AuA was covered by closely arranged AuNPs, which provided intensive electromagnetic field when SERSIA tag combined.Then, for the linking of capture antibodies, a Glass-AuA slide was incubated in a dopamine solution (pH 8.8). Under this alkaline environment, dopamine is oxidized into dopamine quinone, thereafter, into 5,6-dihydroxyindole (DHI), followed by the deprotonation and intermolecular Michael addition to afford cross-linked PDA. The resulting PDA is abundant in active functional groups, such as primary amine, secondary amine and catechol. The existence of these functional groups allows PDA to attach to the surface of Glass-AuA slide. The color change from colorless to brown of dopamine solution confirmed the formation of PDA layer. The formed PDA layer can serve as a “bridge” to further react with protein through secondary reactions.36 The nucleophilic groups in RA-HIgG, such as thiol and amine, could be incorporated onto the PDA surface through Schiff base reaction or Michael addition. As a result, the capture antibody was linked on the substrate. After the conjunction of RA-HIgG, BSA was further modified on the surface to block the non-specific adsorption area of the SERSIA substrate.
The SEM image in Fig. 2B1 revealed that the AuA surface was completely covered by the biolayer after modification. To confirm the Raman enhanced effect of the AuA layer for the SERS-immunoassay detection, a bare glass slide that successively treated by PDA, RA-HIgG and BSA was also prepared (GlassIA substrate, Fig. 2B2). As shown in Fig. 2C, when the same amount of HIgG-combined SERSIA tag was added, the SERSIA substrate showed a stronger Raman signal.
To optimize the preparation of the SERSIA substrate, the amount of capture antibody and BSA modified on the substrate was investigated. As shown in Fig. S2,† the Raman intensity increased gradually with the increase adding of RA-HIgG. When the amount of RA-HIgG reached 240 μL, the peak intensity at 1080 cm−1 reached the maximum, and then the signal declined with the adding of RA-HIgG. This might be due to the decreasing of the binding site with the over loading of the antibody. The optimization of the BSA concentration was shown in Fig. S3.† The maximum Raman signal appeared when 2% of the BSA solution was applied to block the substrate. Therefore, the BSA solution with the concentration of 2% was finally selected for the fabrication of SERSIA substrate.
3.3 SERS-immunoassay detection of HIgG
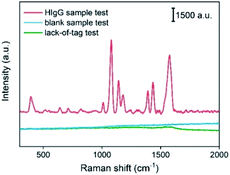
The optimized SERSIA tag and SERSIA substrate were used to establish a SERS-immunoassay method for the detection of HIgG based on the sandwich structure. In the typical process, 10 μL sample solution was added on the SERSIA substrate. After 30 min incubation at 37 °C, the substrate was successively rinsed with PBS buffer (10 mM, pH 7.4) and ultra-pure water. Then, 10 μL of SERSIA tag solution was added to the substrate and incubated at 37 °C for 30 min. The substrate was respectively washed by PBS buffer (10 mM, pH 7.4) and ultra-pure water to remove the non-bonded SERSIA tag, and then air-dried for Raman detection.To verify the feasibility of this method, 10 μL PBS solution containing 500 ng HIgG was used as the HIgG sample. As shown in Fig. 3, a significant Raman spectrum of 4-ATP was detected in the HIgG sample test. The Raman signal comes from the embedded 4-ATP in SERSIA tag, which indicated SERSIA tags were bonded onto the SERSIA substrate owing to the immune binding of HIgG. As a control, similar process using blank solution instead of HIgG sample was executed. Obviously, no Raman signal was detected in the blank sample test. In addition, the lack-of-tag test was also performed through replacing the SERSIA tag solution with a blank solution. The result confirmed the indispensable function of SERSIA tag as a prober in Raman detection.
Subsequently, the quantitative analysis was investigated based on this SERS-immunoassay method. Fig. 4 displayed the Raman spectra of HIgG samples with different concentrations (0.1–200 μg mL−1). It is found that the peak intensity at 1080 cm−1 gradually increased with the increasing of HIgG concentration. The result indicated that the amount of bonded SERSIA tags was closely related to the concentration of HIgG in buffer. Then, a linear relationship between the intensity at 1080 cm−1 and the concentration of HIgG (μg mL−1) was established with the linear regression value (R2) is of 0.9915 and the limit of detection is 0.1 μg mL−1.
| Intensity = 183.12 × [HIgG] + 649.42 | (2) |
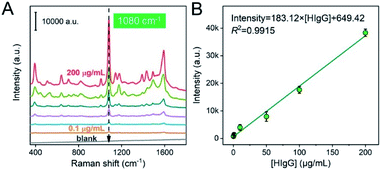 | ||
| Fig. 4 Raman spectra for the detection of HIgG samples with different concentrations (A). The relationship between the peak intensity at 1080 cm−1 and the concentration of HIgG (B). | ||
Compared with the direct analysis of Raman characteristic peaks of IgG, the SERS-immunoassay method is more sensitive for the detection of IgG with a lower limit of detection.37
3.4 Homogeneity and specificity studies
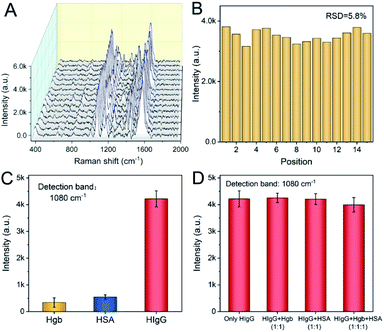
The homogeneity of SERS substrates is essential for Raman detection. An uneven substrate usually leads to heterogeneous electromagnetic field and produces heterogeneous Raman signal at different spots, which is inconvenient for the practical use of Raman detection. To investigate the homogeneity of the substrate in the SERS-immunoassay detection, 15 different spots were randomly selected over the area where the HIgG sample was dropped on, and the Raman spectra of these spots were examined. As shown in Fig. 5A, the Raman spectra of these spots displayed few differences. The intensity at 1080 cm−1 of each spectrum was shown in Fig. 5B, with the relative standard deviation (RSD) of 5.8%, indicating the favorable signal homogeneity of the substrate for HIgG detection. This is owing to the structural homogeneity of the AuA on the SERSIA substrate.In order to evaluate the specificity of the SERS-immunoassay in HIgG detection, HSA and Hgb were chosen as the interference species since they usually exist in human serum. Similar process was carried out to detect the PBS solutions containing Hgb or HSA. The obtained Raman intensities at 1080 cm−1 were shown in Fig. 5C. As we expected, the Raman intensities of HSA and Hgb samples were very weak due to their weak binding with SERSIA substrate. As shown in Fig. 5D, for the samples containing equal concentrations of HIgG and interference species (HIgG + Hgb, HIgG + HSA, HIgG + Hgb + HSA), the peak intensity at 1080 cm−1 did not significantly changed compared to the sample containing only HIgG, and the relative standard deviation was only 2.5%. This reflected the SERS-immunoassay method exhibited excellent anti-interference for HIgG detection, owing to the specific recognition between HIgG and RA-HIgG. These results also indicated the potential application of this method in real sample detection.
3.5 Real serum sample detection
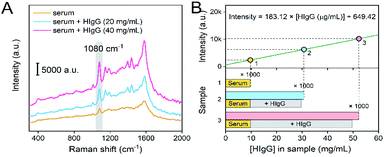
To investigate the practical use of SERS-immunoassay, real serum sample was measured. HIgG is the well-adopted serum marker to diagnose rheumatoid arthritis, liver disease and infectious diseases. Since the HIgG level in healthy human serum is usually in the range of 7–18 mg mL−1,7 the sample was 1000-fold diluted with PBS buffer (10 mM, pH 7.4) to match the quantitative detection range of this method (0.1–200 μg mL−1). Herein, the standard SERS-immunoassay process was performed to detect the diluted samples. The Raman spectrum of healthy serum sample displayed weak signal of 4-ATP (Fig. 6A), and 9.7 μg mL−1 HIgG was detected according to the linear equation (intensity = 183.12 × [HIgG] + 649.42), indicating that the inherent concentration of HIgG in the fresh serum was 9.7 mg mL−1 (Fig. 6B). Then, a certain amount of HIgG was added into the fresh serum sample to obtain the spiked samples containing higher concentration of HIgG. For the samples containing 29.7 mg mL−1 HIgG (9.7 mg mL−1 in initial sample and 20 mg mL−1 spiked), and 49.7 mg mL−1 HIgG (9.7 mg mL−1 in initial sample and 40 mg mL−1 spiked), the quantitative recovery was 103.6 and 105.3%, respectively (Table 1). Compared with previously reported methods, the SERS-immunoassay method had comparable recovery and RSD, which is beneficial to the practical detection of HIgG (Table S1†).| Sample | HIgG added (mg mL−1) | Total found HIgG (mg mL−1) | Recovery (%) | RSD (%) |
|---|---|---|---|---|
| a Fresh human serum and the spiked samples were 1000-fold diluted before detection. The values are the average of three measurements. | ||||
| Human serum | 0 | 9.7 | — | — |
| 20 | 30.77 | 103.6 | 4.66 | |
| 40 | 52.32 | 105.3 | 4.55 | |
4 Conclusions
In this study, we described a SERS-immunoassay method for the detection of HIgG in human serum. Upon the combining of well-ordered AuA on SERSIA substrate, LSPR effect was further enhanced by coupling with SERSIA tag to generate strong and homogeneous Raman signal. High specificity for HIgG detection was also demonstrated by comparing the Raman performance of HIgG with those of Hgb and HSA. The wide linear range and low LOD guarantee the practical use of this method in clinical detection. Finally, the SERS-immunoassay method was verified owning a good quantitative ability for the detection of HIgG in real human serum samples. This study presents a promising method to achieve disease-related biomarkers detection on a Raman platform.Author contributions
Q. Q. and J. W. contributed equally to this work.Conflicts of interest
There are no conflicts to declare.Acknowledgements
The project is supported by the Natural Science Foundation of China (21621004, 21676191) and the Technology Research Program of Zhuhai Entry-Exit Inspection and Quarantine Bureau (ZH2017-28).Notes and references
- A. Balzerova, A. Fargasova, Z. Markova, V. Ranc and R. Zboril, Anal. Chem., 2014, 86, 11107–11114 CrossRef CAS PubMed.
- R. Akter, C. K. Rhee and M. A. Rahman, Biosens. Bioelectron., 2015, 66, 539–546 CrossRef CAS PubMed.
- H. Zhang, D. Ning and J. Zheng, RSC Adv., 2015, 5, 106607–106612 RSC.
- M. A. Slatter and A. R. Gennery, Clin. Exp. Immunol., 2008, 152, 389–396 CrossRef CAS PubMed.
- S. Zhang, N. Huang, Q. Lu, M. Liu, H. Li, Y. Zhang and S. Yao, Biosens. Bioelectron., 2016, 77, 1078–1085 CrossRef CAS PubMed.
- R. Li, K. Wu, C. Liu, Y. Huang, Y. Wang, H. Fang, H. Zhang and C. Li, Anal. Chem., 2014, 86, 5300–5307 CrossRef CAS PubMed.
- I. I. Ramos, L. M. Magalhães, L. Barreiros, S. Reis, J. L. F. C. Lima and M. A. Segundo, Anal. Bioanal. Chem., 2017, 410, 981–988 CrossRef PubMed.
- N. Wang, C. Gao, Y. Han, X. Huang, Y. Xu and X. Cao, J. Mater. Chem. B, 2015, 3, 3254–3259 RSC.
- J. E. L. Villa, I. Garcia, D. Jimenez de Aberasturi, V. Pavlov, M. Sotomayor and L. M. Liz-Marzan, Biosens. Bioelectron., 2020, 165, 112418 CrossRef CAS PubMed.
- L. Wu, Z. Wang, S. Zong, Z. Huang, P. Zhang and Y. Cui, Biosens. Bioelectron., 2012, 38, 94–99 CrossRef CAS PubMed.
- P. Sandbhor Gaikwad and R. Banerjee, Analyst, 2018, 143, 1326–1348 RSC.
- Y. Fu and Q. Ma, Nanoscale, 2020, 12, 13879–13898 RSC.
- X. Hu, J. Yao, F. Wang, M. Yin, Y. Sun, M. Hu, Q. Shi and G. Zhang, J. Sci. Food Agric., 2018, 98, 674–680 CrossRef CAS PubMed.
- J. Atosuo, O. Karhuvaara, E. Suominen, L. Vilen, J. Nuutila and T. Putus, Sci. Total Environ., 2020, 698, 134335 CrossRef CAS PubMed.
- Y. Qiu, D. Deng, Q. Deng, P. Wu, H. Zhang and C. Cai, J. Mater. Chem. B, 2015, 3, 4487–4495 RSC.
- Z. Huang, R. Zhang, H. Chen, W. Weng, Q. Lin, D. Deng, Z. Li and J. Kong, Biosens. Bioelectron., 2019, 142, 111542 CrossRef CAS PubMed.
- T. Nakao, K. Mawatari, Y. Kazoe, E. Mori, H. Shimizu and T. Kitamori, Analyst, 2019, 144, 6625–6634 RSC.
- M. Yang, J. Huang, J. Fan, J. Du, K. Pu and X. Peng, Chem. Soc. Rev., 2020, 49, 6800–6815 RSC.
- G. C. Phan-Quang, N. Yang, H. K. Lee, H. Y. F. Sim, C. S. L. Koh, Y.-C. Kao, Z. C. Wong, E. K. M. Tan, Y.-E. Miao, W. Fan, T. Liu, I. Y. Phang and X. Y. Ling, ACS Nano, 2019, 13, 12090–12099 CrossRef CAS PubMed.
- J. Cai, C. Hao, M. Sun, W. Ma, C. Xu and H. Kuang, Small, 2018, 14, 1703931 CrossRef PubMed.
- F. Xu, F. Ma, Z. Ding, L. Xiao, X. Zhang, Q. Lu, G. Lu and D. L. Kaplan, ACS Appl. Mater. Interfaces, 2019, 11, 42896–42903 CrossRef CAS PubMed.
- Z. Wang, S. Zong, L. Wu, D. Zhu and Y. Cui, Chem. Rev., 2017, 117, 7910–7963 CrossRef CAS PubMed.
- A. Ghasemi, N. Rabiee, S. Ahmadi, S. Hashemzadeh, F. Lolasi, M. Bozorgomid, A. Kalbasi, B. Nasseri, A. S. Dezfuli, A. R. Aref, M. Karimi and M. R. Hamblin, Analyst, 2018, 143, 3249–3283 RSC.
- Y.-C. Kao, X. Han, Y. H. Lee, H. K. Lee, G. C. Phan-Quang, C. L. Lay, H. Y. F. Sim, V. J. X. Phua, L. S. Ng, C. W. Ku, T. C. Tan, I. Y. Phang, N. S. Tan and X. Y. Ling, ACS Nano, 2020, 14, 2542–2552 CrossRef CAS PubMed.
- K. Karn-orachai, K. Sakamoto, R. Laocharoensuk, S. Bamrungsap, T. Dharakul and K. Miki, RSC Adv., 2017, 7, 14099–14106 RSC.
- C. Wang, C. Wang, X. Wang, K. Wang, Y. Zhu, Z. Rong, W. Wang, R. Xiao and S. Wang, ACS Appl. Mater. Interfaces, 2019, 11, 19495–19505 CrossRef CAS PubMed.
- A. Abbas, A. Brimer, J. M. Slocik, L. Tian, R. R. Naik and S. Singamaneni, Anal. Chem., 2013, 85, 3977–3983 CrossRef CAS PubMed.
- I. Freitag, C. Beleites, S. Dochow, J. H. Clement, C. Krafft and J. Popp, Analyst, 2016, 141, 5986–5989 RSC.
- X. Yang, C. Gu, F. Qian, Y. Li and J. Z. Zhang, Anal. Chem., 2011, 83, 5888–5894 CrossRef CAS PubMed.
- J. Wang, J. Li, C. Zeng, Q. Qu, M. Wang, W. Qi, R. Su and Z. He, ACS Appl. Mater. Interfaces, 2020, 12, 4699–4706 CrossRef CAS PubMed.
- G. Frens, Nat. Phys. Sci., 1973, 241, 20–22 CrossRef CAS.
- J. Cao, D. Zhao and Q. Mao, Analyst, 2017, 142, 596–602 RSC.
- C. Zhang, B. Wu, Y. Zhou, F. Zhou, W. Liu and Z. Wang, Chem. Soc. Rev., 2020, 49, 3605–3637 RSC.
- C. Song, L. Min, N. Zhou, Y. Yang, S. Su, W. Huang and L. Wang, ACS Appl. Mater. Interfaces, 2014, 6, 21842–21850 CrossRef CAS PubMed.
- M. C. C. G. Carneiro, A. Sousa-Castillo, M. A. Correa-Duarte and M. G. F. Sales, Biosens. Bioelectron., 2019, 146, 111761 CrossRef CAS PubMed.
- W. Cheng, X. Zeng, H. Chen, Z. Li, W. Zeng, L. Mei and Y. Zhao, ACS Nano, 2019, 13, 8537–8565 CrossRef CAS PubMed.
- A. Ortiz-Dosal, E. Loredo-García, A. G. Álvarez-Contreras, J. M. Núñez-Leyva, L. C. Ortiz-Dosal, E. S. Kolosovas-Machuca and S.-J. Young, J. Nanomater., 2021, 2021, 1–6 CrossRef.
Footnotes |
| † Electronic supplementary information (ESI) available: The fabrication of SERSIA tag and SERSIA substrate, the SERS-immunoassay process for the detection of HIgG, optimization of the amount of RA-HIgG and BSA modified on the SERSIA substrate, comparison of the practical detection ability with references. See DOI: 10.1039/d1ra02404c |
| ‡ These authors contributed equally to this work. |
| This journal is © The Royal Society of Chemistry 2021 |

