DOI:
10.1039/D1RA03890G
(Paper)
RSC Adv., 2021,
11, 28535-28541
Electrochemical conversion of CO2 into value-added carbon with desirable structures via molten carbonates electrolysis
Received
18th May 2021
, Accepted 16th August 2021
First published on 24th August 2021
Abstract
Direct conversion of CO2 to high value-added carbon products based on molten salt electrochemistry has been proven to be a feasible approach to solve the climate problem and achieve carbon neutrality. In this work, carbon nanotubes (CNTs), carbon spheres (CSs) and honeycomb carbon are synthesized by electrolysis of a single or multiple alkali metal carbonate electrolyte. The elemental composition, morphology and structure, crystallinity and graphitization degree of carbon products are characterized by electron dispersive spectroscopy (EDS), scanning electron microscopy (SEM), transmission electron microscope (TEM), X-ray diffraction (XRD) and Raman microspectroscopy (RAM). The results demonstrate that a high yield of CNTs is obtained in Li2CO3 electrolyte by regulating the electrolysis temperature and current density. Compared to pure Li2CO3, Li–Na carbonate electrolyte with 1 wt% stannic oxide/cerium oxide (SnO2/GeO2) favors CS formation rather than CNT formation. Additionally, honeycomb carbon products are generated in Li–Na–K electrolyte, when the electrolysis temperature is lower than 600 °C. Overall, this work provides a novel carbon neutral strategy where high value-added carbon products are synthesized using CO2 as a carbon source.
1. Introduction
Restraining the continuous increase of CO2 concentration in the atmosphere has attracted significant attention due to the problems caused by global climate change, such as melting glaciers and rising sea levels.1–3 As the most oxidized state of carbon, CO2 is a highly stable, noncombustible molecule, and its kinetic stability previously had made its transformation into an economic, stable, non-greenhouse material a challenge.4 At present, distinct CO2 splitting strategies have been proposed, and the quantity of researches in this field has still grown rapidly.5–10 Recent studies on photocatalysis using metal complexes11–13 and metal oxide based photoelectrodes14–16 demonstrate CO2 reduction performance. However, the catalytic selectivity and activity of these photocatalysts have not yet reached their optimal performance. Over the years, CO2 captured17 and subsequently converted into carbon monoxide (CO),18 solid carbon and even CNTs,19,20 CSs21 or honeycomb carbon22 through the aid of carbonate electrolytes23 have been proposed. As an example, Wang et al. introduced the significant influence of electrolysis temperature and voltage on the morphology of carbon products in Li–Na–K ternary carbonate mixtures and obtained nano-carbon particles and nano-carbon flakes when the voltage and temperature were 3–6 V and 450–650 °C, respectively.24 As another example, Ijije et al. studied a Li2CO3–K2CO3 binary system under CO2 or CO2/N2 atmosphere and observed a carbon deposition on a mild steel cathode when the voltage and temperature were 3.0–5.0 V and 540–700 °C, respectively.25 However, in these publications, the cathode products from molten salt electrolysis tend to be an uncontrolled mixture of graphite and amorphous carbon, and therefore, the cost of operation versus the perceived economic value of carbon products becomes critical for the feasibility and practicability of this method. In addition to conversion to amorphous carbon materials, it has been recognized in recent years that CO2 can be reduced in carbonate electrolyte to carbon products with desirable structures.21,26–30 In 2015, controllable synthesis of CNTs was achieved in Li2CO3 electrolyte, in which, the Ni nanoparticles originating from anodic corrosion and redepositing at cathodic surface acted as nucleating sites for following CNTs growth,31 which further set off a research boom in this field. Subsequently, researches on high value-added carbon nanomaterials prepared via molten carbonates electrolysis have been widely reported.32–34 In summary, the technology for preparing carbon products by molten salt electrochemistry is becoming more and more mature. Compared with methods such as chemical vapor deposition (CVD) and arc discharge, the technology can also reduce costs by using renewable raw materials rather than conventional chemicals from the natural gas or petroleum industry.
In this paper, in addition to the use of pure Li2CO3 to produce CNTs, low-cost Li–Na binary carbonate and Li–Na–K ternary carbonate are used to produce CSs and honeycomb carbon, respectively. To the best of our knowledge, this is the first time to synthesize CSs from electrochemical conversion of CO2 by adding SnO2 or GeO2 additives to the carbonate electrolyte. This study is helpful to mitigate global climate change and promote the reduction of CO2 into high value-added solid carbon products (CNT, CS and honeycomb carbon), which is of great significance to the realization of sustainable development of human beings.
2. Materials and methods
2.1. Preparation
Li2CO3, Na2CO3 and K2CO3 that were supplied by BA Chemical Reagent Factory of Tianjin China were of analytical purity. Galvanized Fe wire (active area = 5 cm2) and Ni wire (active area = 10 cm2) were used as the cathode and anode, respectively. SnO2 and GeO2 were purchased from Aladdin Chemical Reagent. All the wires were rolled into a spiral for electrolysis experiments. A corundum crucible (Al2O3, 99%) with a 50 mL volume was used to contain the molten salt elec-trolytes and was provided by the Tangshan KS Porcelain Chemistry Factory.
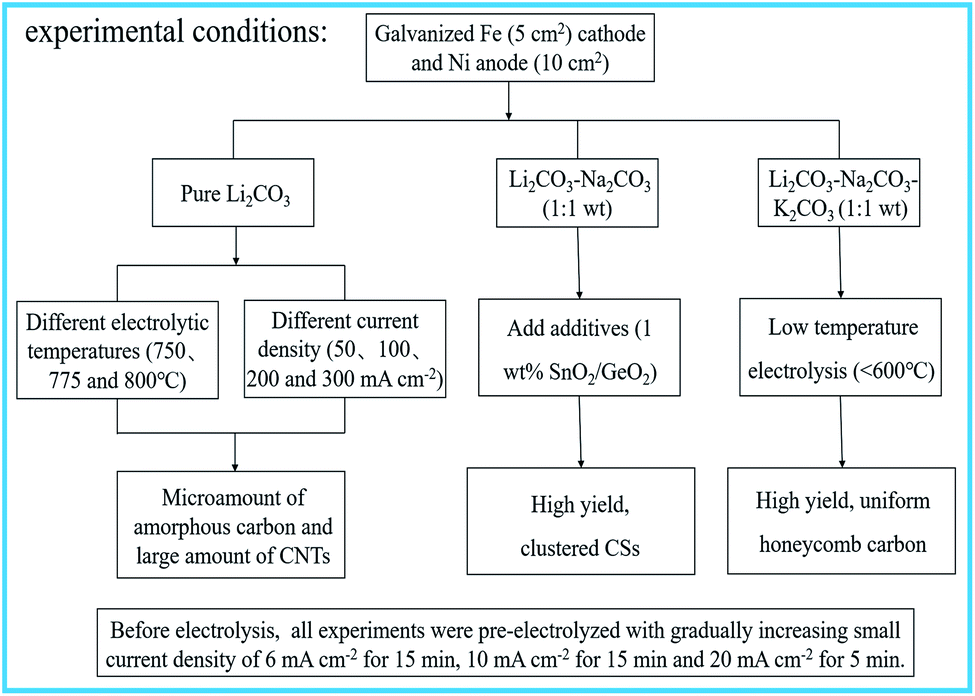
The corundum crucible was filled with the carbonate mixture at the desired ratio and placed into a pit heating furnace. After heating up to the presupposed temperature, the system was supplied with a constant direct-current within the desired time. Fig. 1 depicts the experimental conditions in detail. All experiments in this paper were carried out under air atmospheric unless otherwise indicated.
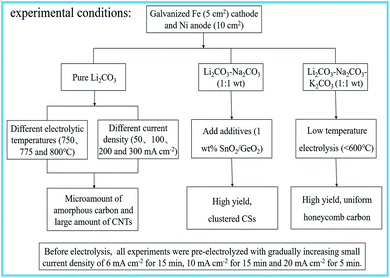 |
| | Fig. 1 Specific experimental conditions. | |
2.2. Purification and characterization of the carbon materials
After electrolysis, the electrodes were pulled out from the carbonates-melt and the carbon-products remained on the cathode. After cooling to room temperature, carbon products fell off when the cathode was unrolled. We used 3 M HCI pickling carbon products for 24 h to remove the cooled electrolyte adherent on the carbon product surface. Subsequently, post-treatments including ultrasonic (10 min), filtration (0.4 μm filter membrane) and drying (80 °C for 4 h) were carried out to obtain the purified carbon products. The elemental composition of the purified cathode carbon product was identified by using an energy dispersive spectrometer (EDS, X-Max, the British Oxford Instruments Co., Ltd). The micromorphology and microstructure of the carbon products were analyzed by scanning electron microscopy (SEM, SIGMA, Zeiss Company) and transmission electron microscope (TEM, JEM-2100, JEOL) at a beam voltage of 200 kV. The crystal form of the carbon products were determined by X-ray diffraction (XRD, D/MAX-2200, Rigaku) with a sweep rate of 0.12 degree per minute and a 0.01 degree slit width. The graphitization degree of the carbon products were revealed by Raman spectroscopy (Raman, DXR, Thermo Fisher Scientific) with a 532 nm−1 laser excitation, 10 s exposure time, and 10% laser power analysis.
3. Results and discussion
3.1. Reaction mechanism
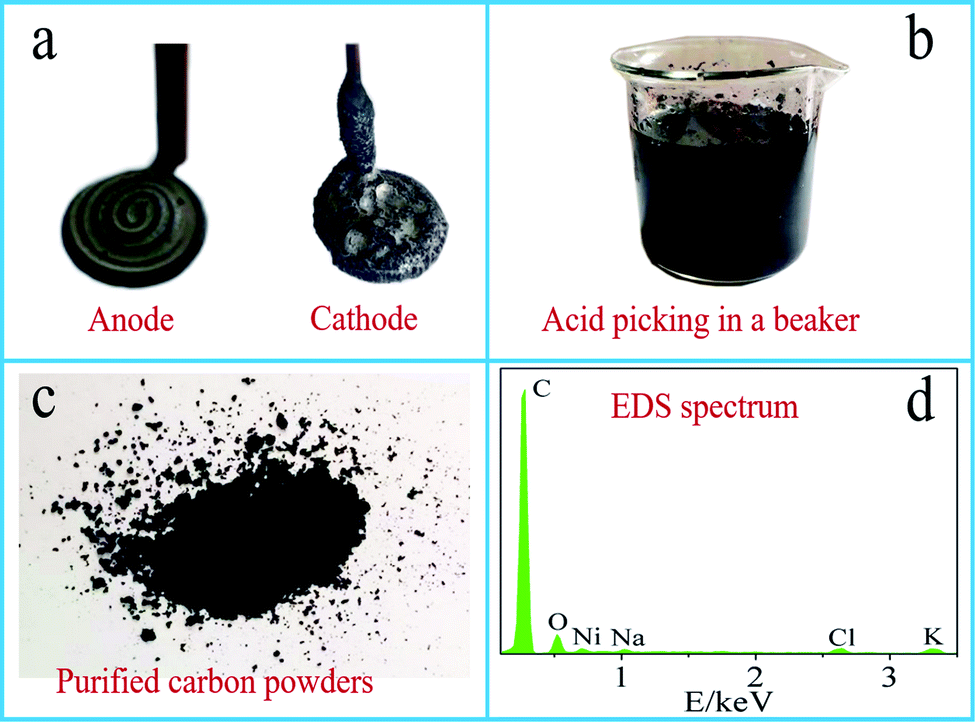
Fig. 2a–d respectively show electrode images after electrolytic reaction, the pickling of the resultant carbon powders, purification of carbon powder and energy spectrum analysis.
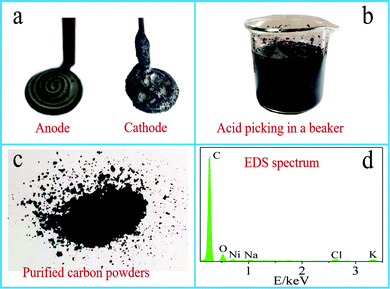 |
| | Fig. 2 (a) Electrodes after the electrolysis in the Li–Na–K carbonate electrolyte, (b) acid leaching of the cathodically generated carbon products in a beaker, (c) purified carbon powders, (d) EDS analysis of the obtained powders. | |
The picture of electrodes (Ni anode and Fe cathode) after electrolysis is shown in Fig. 2a. Ni anode excepts for some condensed electrolyte, no obvious changes are observed, while a thick layer of black carbon product is deposited on the surface of Fe cathode while some condensed electrolyte adhered to the carbon products. Therefore, the post-treatments of the carbon products purification are proved to be necessary. Cathodically generated carbon products are pickled (Fig. 2b), filtered and dried, the carbon powder obtained is shown in Fig. 2c for subsequent characterization and analysis. Fig. 2d shows the EDS analysis results of the carbon powder obtained in Li–Na–K (1![[thin space (1/6-em)]](https://www.rsc.org/images/entities/char_2009.gif) :1:1 wt) system. Besides the main C element accounting for ∼90% of the mole fraction, trace amount of O, Ni, Na, Cl and K are presented. After electrolysis, the molten transparent electrolyte becomes green due to the corrosion of Ni anode, so Ni is observed in the elemental analysis of the carbon products. Presumably, Na K and Cl are detected due to the incomplete acid leaching step and residual acid. The presence of O, as reported by Tang et al., may be ascribed to the existence of oxygen-containing functional groups in the carbon products.24 In the infrared spectrum, the obvious visible peaks at 3450 cm−1 and 1110 cm−1 can be attributed to the stretching vibration of –OH and C–C–O, respectively, which indicates the presence of oxygen-containing functional groups in carbon products. It is generally acknowledged and believed that these observed oxygen-containing functional groups are common for active carbons and preferable for capacitance performance.35
:1:1 wt) system. Besides the main C element accounting for ∼90% of the mole fraction, trace amount of O, Ni, Na, Cl and K are presented. After electrolysis, the molten transparent electrolyte becomes green due to the corrosion of Ni anode, so Ni is observed in the elemental analysis of the carbon products. Presumably, Na K and Cl are detected due to the incomplete acid leaching step and residual acid. The presence of O, as reported by Tang et al., may be ascribed to the existence of oxygen-containing functional groups in the carbon products.24 In the infrared spectrum, the obvious visible peaks at 3450 cm−1 and 1110 cm−1 can be attributed to the stretching vibration of –OH and C–C–O, respectively, which indicates the presence of oxygen-containing functional groups in carbon products. It is generally acknowledged and believed that these observed oxygen-containing functional groups are common for active carbons and preferable for capacitance performance.35
Scheme 1 is a schematic diagram of molten carbonate electrolysis carbon generation. CO2 is indirectly converted to solid carbon through CO32− reduced to C and O2− on the surface of the cathode (eqn (1)). A part of the generated O2− that is transported to the anode side through the molten salt electrolyte, loses electrons on the anode and oxidizes into O2 (eqn (2)), while the other part reacts with CO2 to generate CO32− to achieve electrolyte regeneration (eqn (3)). Therefore, the total net reaction (eqn (4)) is the electrolysis of CO2 into C and O2.
| | |
CO32− + 4e− = C + 3O2−
| (1) |
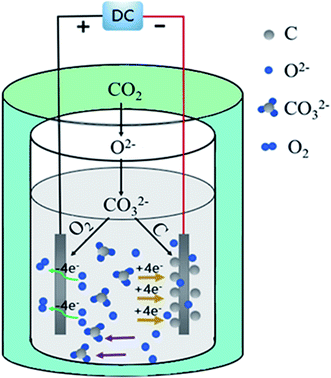 |
| | Scheme 1 Schematic diagram of the experimental process. | |
The theoretical potential values of Li2CO3, Na2CO3, and K2CO3 decomposing at different temperatures to produce corresponding decomposition products, as listed by Table 1. From the perspective of thermodynamics, the more positive the reduction potential is for the cathode reduction process, the easier the reduction process is. With the increase of temperatures, the electrolysis potential moves in the positive direction, that is, the activation energy required for the reaction is reduced, and the reaction is more likely to occur. Compared with Na2CO3 and K2CO3, the absolute value of the potential required for the de-composition of Li2CO3 to produce carbon (EC) is lower than the absolute value of the potential for the decomposition of CO (ECO) and Li metal (EM) at the same temperature, indicating that the carbon generation reaction proceeds preferentially in Li2CO3 electrolyte. However, the absolute value of the electric potential required by Na2CO3 and K2CO3 to deposit the corresponding alkali metal (EM) is lower than the electrolytic potential required to form carbon (EC), so the reduction of alkali metals has more advantages in thermodynamics. Therefore, the electrolyte system used in this article contains Li2CO3.
Table 1 Required standard potentials by converting alkali carbonates into solid carbon (EC), carbon monoxide (ECO) and corresponding alkali metal (EM)
| T/K |
Carbonate |
EC/V |
ECO/V |
EM/V |
| 400 |
Li2CO3 |
−2.26 |
−2.94 |
−3.67 |
| Na2CO3 |
−3.04 |
−3.97 |
−3.24 |
| K2CO3 |
−3.61 |
−4.73 |
−3.32 |
| 800 |
Li2CO3 |
−1.79 |
−2.12 |
−3.07 |
| Na2CO3 |
−2.60 |
−3.21 |
−2.65 |
| K2CO3 |
−3.13 |
−3.91 |
−2.70 |
| 1200 |
Li2CO3 |
−1.45 |
−1.49 |
−2.56 |
| Na2CO3 |
−2.22 |
−2.52 |
−2.09 |
| K2CO3 |
−2.68 |
−3.13 |
−2.01 |
3.2. Morphology controlled synthesis of carbon products
CNTs formation in pure Li2CO3 electrolyte—we established pure Li2CO3 electrolyzer with galvanized Fe as cathode and Ni as anode. By regulating electrolytic temperature and current density, a large number of CNTs were found in cathode products.
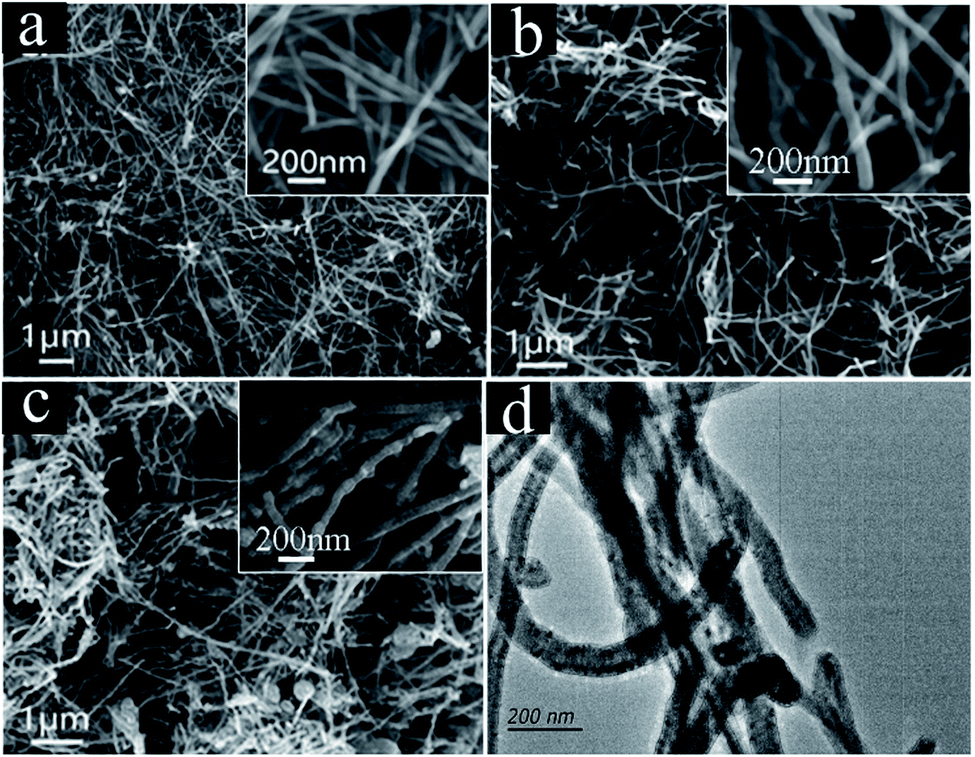
After pre-electrolysis nucleation at a current density of 6–10–20 mA cm−2, carbon is produced by constant current electrolysis at 200 mA cm−2. The morphology and structure of carbon products obtained at diverse temperature are shown in Fig. 3. It can be observed that the carbon products are mainly CNTs, but the micromorphology is still slightly different. CNTs (>80%) obtained by electrolysis at 750 °C (Fig. 3a and b) are in a curly shape, with diameters ranging from 34–80 nm. With the increase of temperature, the tubes changed from a curly shape to a long straight shape. When the electrolysis temperature rises to 775 °C (Fig. 3c and d) and 800 °C (Fig. 3e and f), the straight CNTs with smaller diameter exhibit a smooth-surfaced tube wall, and no obvious defects are observed. In addition, a yield of amorphous carbon in carbon products increases, due to the increase of side reactions with increasing temperature which affects the carbon deposition process. During the process of electrolysis, the NiO from Ni anode corrosion is reduced to the Ni metal in cathode surface, which acts as the nucleating agent to promote the growth of CNTs. At low temperature, the Ni anode corrodes severely, which increases the concentration of NiO in the electrolyte, leading to an increase in Ni metal clusters and enlargement the diameter of the CNTs. The carbon atoms in CNTs are dominated by sp2 hybridization, accompanied by a small amount of sp3 hybridization,36 so the CNTs have high modulus and high strength, and the tensile strength reaches 50–200 GPa. In Li2CO3 electrolyte, the bending degree of CNTs is obviously enhanced at low temperature, that is, the content of sp3 increases. This kind of CNTs with more defects have higher electric capacity and can be used as electrode materials for lithium-ion batteries.37–39
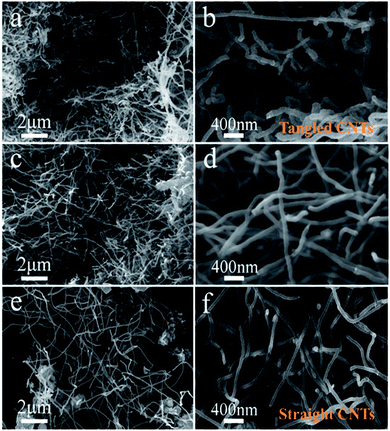 |
| | Fig. 3 Micromorphology of the carbon products generated in Li2CO3 electrolyte at (a and b) 750 °C, (c and d) 775 °C, and (e and f) 800 °C. | |
In order to further reveal the influence of applied current on the morphology of CNTs, pure Li2CO3 electrolyte is electrolyzed with different current densities at 750 °C, and the morphology of carbon products obtained after the reaction is observed, as shown in Fig. 4a–c. When the current densities are 50 mA cm−2 and 100 mA cm−2, the SEM images (Fig. 4a and b) shows that carbon deposits contain >90% fraction of CNTs and trace amount of carbon particles. In the upper right corner of Fig. 4a and b, the high-magnification SEM images of CNTs obtained at 50 mA cm−2 and 100 mA cm−2, respectively, show that the morphology of CNTs is slender, with smooth tube walls and no obvious defects. When the current density increases to 300 mA cm−2 (Fig. 4c), a yield of 80% CNTs with larger diameter is presented, commixing with irregular carbon particles. TEM is used to further characterize the CNTs prepared at 100 mA cm−2, as shown in Fig. 4d. The obvious hollow structure was observed, and the thickness of the tube wall is 50–100 nm. Today's CNTs (90% purity, industrial grade) produced by traditional CVD methods are valued at ∼$300000 per ton.40 Due to high price and high synthesis cost, CNTs' application has been limited. The production of CNTs through molten salt electrochemistry is only limited by the cost of electricity. Here, without considering the power consumption of molten salt pretreatment and heating, according to the calculation of electric power and carbon product quality, the energy consumptions required for electrolysis are calculated. In the Li2CO3, the control electrolysis power is 1 A h at 50–300 mA cm−2, and the energy consumption is 12800–20500 kW h per ton. Using an electricity cost of $0.10 per kW h, the electrosynthesis of CO2 to CNTs suggests an equivalent $640 to $1025 per ton of CNTs. In addition, due to the low cost of Ni anode, Fe cathode and auxiliary equipment during the electrolysis process, it is estimated that the upper limit of the cost is $2000 per ton of CNTs. Compared to today's conventional CVD production costs of $100000–200000 per ton of CNTs (90% industrial grade),41 CNTs are synthesized at a 50–100 fold price reduction. The low cost of CNT (from CO2 conversion) production increases revenue, while providing significant incentives for CO2 removal.
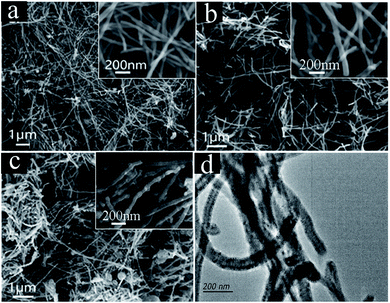 |
| | Fig. 4 SEM images of carbon products obtained in 750 °C Li2CO3 electrolyte: (a) 50 mA cm−2, (b) 100 mA cm−2, (c) 300 mA cm−2, (d) TEM of CNTs prepared at 100 mA cm−2. | |
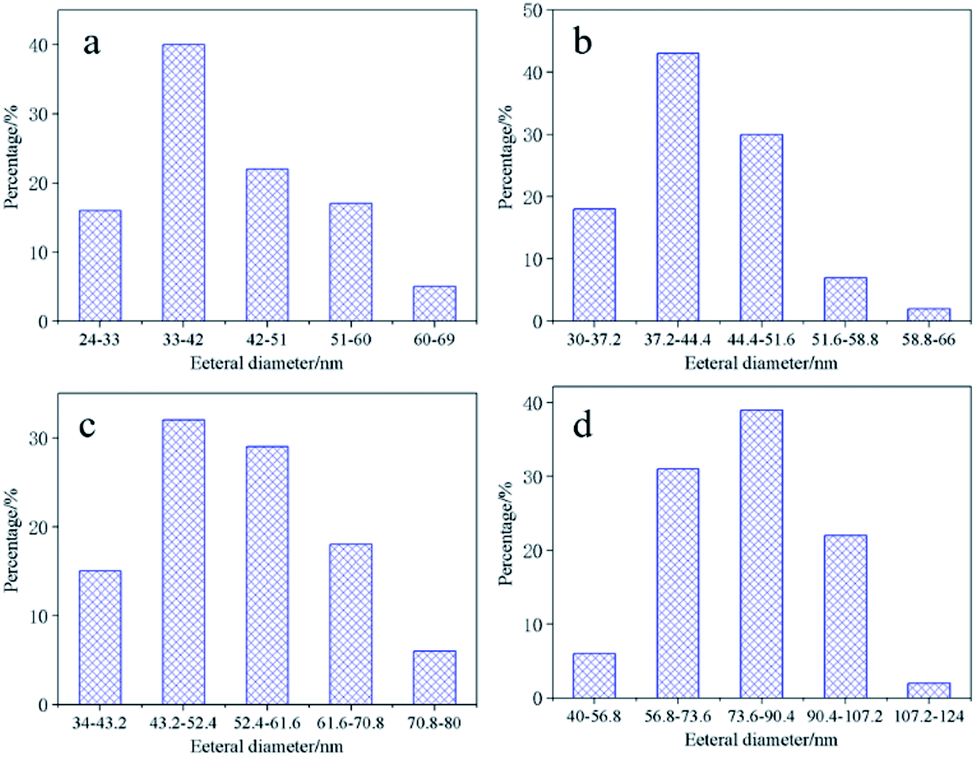
The Nano Measurer 1.2 software is used to calculate the outer diameter size distribution of CNTs under different current densities of Li2CO3 electrolyte, as shown in Fig. 5. The diameter distributions follow lognormal distributions with a diameter distribution shifting with the current density during electrolysis. We observed the general trend that the smaller the current density yielding CNTs with smaller and tighter diameter distributions. At 50 mA cm−2 (Fig. 5a), the diameter of the CNTs ranges from 24 to 69 nm with an average diameter of about 42 nm. Current density of 300 mA cm−2 (Fig. 5d) results in the widest and largest diameter distribution ranging from 40 to 124 nm with a mean diameter around 79 nm. The raw data of the diameter distribution of 100 mA cm−2 and 200 mA cm−2 are shown in Fig. 5b and c. The diameter distributions are 30–66 nm and 34–80 nm, respectively. The results further demonstrate the trend of increasing CNT diameter from increased current density. The reason might be that the high current density promotes the dissolution behavior of NiO, so it is easier to form large-sized Ni nanoparticles, making the diameter of the catalytically grown CNTs larger.42
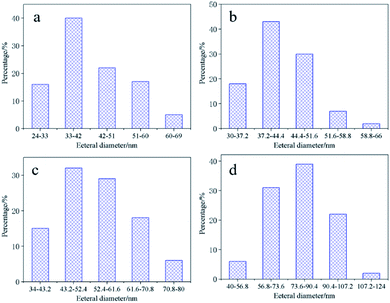 |
| | Fig. 5 The outer diameter distribution of CNTs obtained under different current densities in 750 °C Li2CO3 electrolyte (a) 50 mA cm−2, (b) 100 mA cm−2, (c) 200 mA cm−2, (d) 300 mA cm−2. | |
CSs generated in binary carbonate electrolyte—herein, add SnO2 and GeO2 to Li–Na (1:1 wt) eutectic for electrolysis and the corresponding carbon structures are presented in Fig. 6. During the process of electrolysis, a small current density is applied to the system to deposit Ni particles on the cathode surface, and then the carbon deposition reaction begins at 200 mA cm−2. For carbon products of adding 1 wt% SnO2 or GeO2 in Li–Na eutectic (Fig. 6a–d), CSs rather than CNTs previously reported42 become the preferable morphology. Formation of CSs might be related to the Na+ induced interference effect and trace amount of SnO2/GeO2 to adequately modify the interface between the electrolyte and cathodic surface, facilitating CSs deposition. Another observation is that the diameter and degree of bending of the CNTs formed in the Li–Na system (Fig. 6a and b) have slightly increased. It may be due to the addition of Na2CO3 which increases the alkalinity of the electrolyte, thereby increasing the solubility of NiO, which results in an increase in Ni metal clusters and expands the diameter of CNTs.
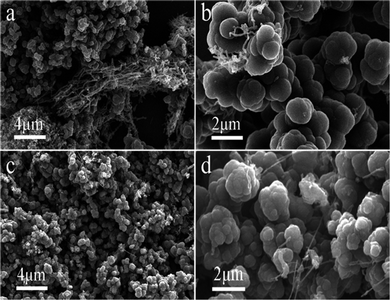 |
| | Fig. 6 SEM images of the carbon products generated in 750 °C Li–Na (1:1 wt) eutectic: (a and b) 1 wt% SnO2, (c and d) 1 wt% GeO2. | |
Honeycomb-structured carbon production generated in ternary carbonate electrolyte—during this process, initial low current step is still utilized to activate the Ni nucleating sites formation, which may lead to carbon materials with desirable structures deposition at cathode.
At Li–Na–K (1:1:1 wt) ternary carbonates, a mixture of carbon flakes and 10% CNTs is observed when electrolytic temperature is over 600 °C. Interestingly, when the temperature is lower than 600 °C degrees, honeycomb carbon becomes the preferred product, as shown in the Fig. 7. The honeycomb carbon material obtained is different from the disordered butterfly wing carbon flake, and shows a higher regularity, and the yield is more than 80%. Notably, in Fig. 7b and d, the SEM images of higher magnification show a honeycomb-like structure with nano-sized cells, and simultaneously, a little graphite impurities are observed to disperse on the surface of the honeycomb-like structure. Unlike nanoflakes formed in molten salts reported by other researchers,24 this honeycomb-like structure is composed of densely packed carbon flakes, rather than dispersedly distributed, endowing a compressed panel with minimal weight and excellent rigidity. At Li–Na–K (1:1:1 wt) electrolyte, electrolysis temperature has a significant influence on morphology evolution of carbon products. When the electrolysis temperature is 500 °C, the cell voltage is 2.85–2.95 V, which is much higher than the reduction potential of Na+ and K+ at this temperature. Therefore, the carbon deposition process is accompanied by the deposition reaction of alkali metals, inferring that the honeycomb structure is caused by the co-deposition of alkali metals.
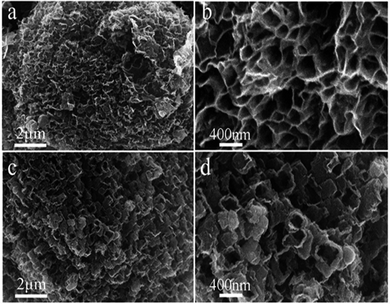 |
| | Fig. 7 SEM images of the carbon products generated from Li–Na–K (1:1:1 wt) carbonates eutectic at (a and b) 500 °C, (c and d) 550 °C. | |
3.3. Characterization of the carbon materials
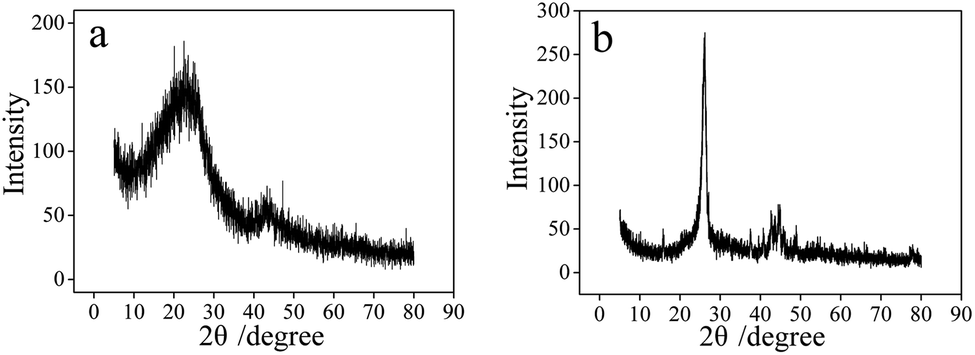
The crystallinity of carbon products is characterized and analyzed by X-ray diffractometer, and the results are shown in Fig. 8. The XRD spectrum of CNTs obtained in 750 °C Li2CO3 electrolyte is shown by Fig. 8b. The CNTs have a significantly enhanced characteristic peak at 26° (002), and the peak width is relatively narrow, indicating that the graphite hexagonal crystals in CNTs are relatively regular and have a high degree of crystallinity. Fig. 8a shows the XRD spectrum of CSs prepared by adding 1 wt% SnO2 to 750 °C Li–Na eutectic. The intensity of characteristic carbon peak at 26° is lower than the CNTs, indicating that the crystallinity of CSs is less than that of CNTs. Additionally, the diffraction peaks at 43° and 44° are observed in Fig. 8b, which proves that the CNTs formed by electrolysis have exceptional uniformity.43
 |
| | Fig. 8 XRD diffraction patterns of the carbon materials: (a) CSs prepared in Li–Na eutectic with 1 wt% SnO2, (b) CNTs prepared in 750 °C Li2CO3 electrolyte. | |
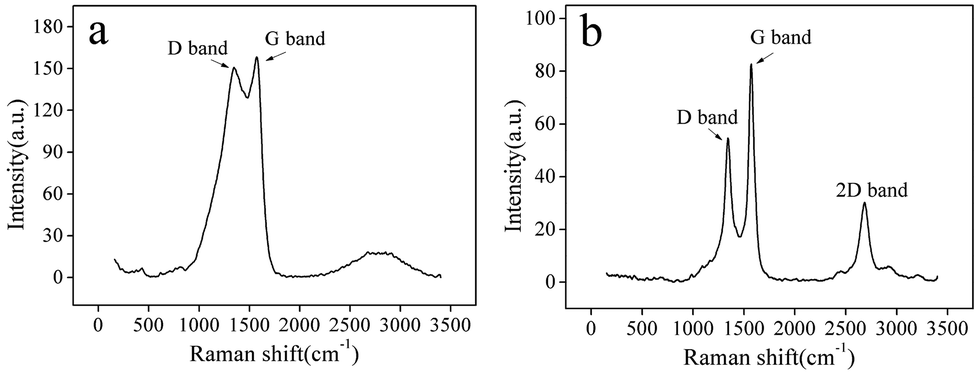
Raman spectroscopy is utilized to measure and evaluate the graphitization degree of CSs and CNTs, as shown in the Fig. 9a and b, respectively. Two characteristic peaks are observed at 1350 cm−1 and 1580 cm−1, corresponding to the characteristic disorder peak (D band) and graphitization peak (G band) of carbon products, respectively. The intensity ratio of D band and G band (ID/IG) as an indicator reflects the degree of graphitization of carbon products, and the higher ID/IG ratio, the higher the disorder and defect density of carbon products will be. For CSs of the Li–Na eutectic with 1 wt% SnO2 (Fig. 9a), the ratio of ID/IG falls in the range of 0.9 to 1.0. Compared with the Raman spectrum of CNTs prepared by electrolytic Li2CO3 system, it can be clearly observed that the ID/IG value has greatly increased, indicating that the disorder of the graphite crystal arrangement has increased and the degree of graphitization has decreased. The higher surface disorder is caused by the Na+-induced interference and the SnO2 and other oxides-induced interface modification.
 |
| | Fig. 9 Raman spectrum of the carbon materials: (a) CSs prepared in Li–Na eutectic with 1 wt% SnO2, (b) CNTs prepared in Li2CO3 electrolyte. | |
4. Conclusion
In this paper, CNTs, CSs and honeycomb carbon value-added carbon materials are prepared by molten carbonate electrolysis and greenhouse gas CO2 as a carbon source. It is proved that current density in Li2CO3 electrolyte exhibits stronger interference with the yield of CNTs as only 80% CNTs are observed at 300 mA cm−2, lower than >90% CNTs at 50 mA cm−2. Besides, the diameter of CNTs generated at 50 mA cm−2 decreases to merely 24–69 nm due to form small-sized Ni nanoparticles on cathode surface. Binary eutectic Li–Na (1:1 wt) carbonates with 1 wt% SnO2 or GeO2 favor the CS structure formation presumably due to the presence of Na+ as well as the interface modification of SnO2/GeO2. The Li–Na eutectic provides a chemical environment for the larger diameter of CNT production as well, 100–200 nm, where the degree of curling of CNTs is greater than that of pure Li2CO3. For Li–Na–K (1:1:1 wt) ternary eutectic, surpass 80% honeycomb-like carbons become the preferred carbon products at 500 °C. In conclusion, CNTs, CSs and honeycomb-like carbon with varying structural parameters are prepared by regulating the composition of alkali metal carbonate and adding additives. Further researches on preparing CNTs, CSs and honeycomb carbon material with desirable size and exploring their application prospects in diverse fields are expected. The electrochemical conversion of CO2 into value-added carbon products via molten salt electrolyzer provides a practical method for solving energy shortages and climate change issues.
Conflicts of interest
There are no conflicts to declare.
Notes and references
- Y. Hao, H. Chen, Y. M. Wei and Y. M. Li, J. Clean. Prod., 2016, 131, 667–677 CrossRef.
- M. Hashemi and A. A. Sabziparvar, Global Change Biol., 2019, 25, 1119–1132 CrossRef PubMed.
- G. D’Amato and C. A. Akdis, Allergy, 2020, 75, 2158–2160 CrossRef PubMed.
- S. Licht, B. Wang, S. Ghosh, H. Ayub, D. Jiang and J. Ganley, J. Phys. Chem. Lett., 2010, 1, 2363–2368 CrossRef CAS.
- W. H. A. Peelen, K. Hemmes and J. H. W. Dewit, Electrochim. Acta, 1998, 43, 763–769 CrossRef CAS.
- W. Lin and H. Frei, J. Am. Chem. Soc., 2005, 127, 1610–1611 CrossRef CAS.
- M. Cassir, S. J. Mcphail and A. Moreno, Int. J. Hydrogen Energy, 2012, 37, 19345–19350 CrossRef CAS.
- D. Peeters, D. Moyaux and P. Claes, Eur. J. Inorg. Chem., 1999, 1999, 583–588 CrossRef.
- W. Gao, X. Bai, Y. Gao, J. Liu, H. He, Y. Yang, Q. Han, X. Wang, X. Wu, J. Wang, F. Fan, Y. Zhou, C. Li and Z. Zhou, Chem. Commun., 2020, 56, 7777–7780 RSC.
- L. Kleiminger, G. H. Kelsall, T. Li and K. Li, ECS Trans., 2015, 68, 3449–3458 CrossRef CAS.
- H. Fei, M. Sampson, Y. Lee, C. P. Kubiak and S. M. Cohen, Inorg. Chem., 2015, 54, 6821–6828 CrossRef CAS PubMed.
- Z. Chen, Y. Hu, J. Wang, Q. Shen and N. Gaponik, Chem. Mater., 2020, 32, 1517–1525 CrossRef CAS.
- Y. H. Luo, L. Z. Dong, J. Liu, S. L. Li and Y. Q. Lan, Coord. Chem. Rev., 2019, 390, 86–126 CrossRef CAS.
- J. Wang, Y. Guan, X. Yu, Y. Cao, J. Chen, Y. Wang, B. Hu and H. Jing, iScience, 2020, 23, 100768 CrossRef CAS PubMed.
- I. A. Rutkowska and P. J. Kulesza, ECS Meet. Abstr., 2020, 60, 3204–3204 CrossRef.
- K. Sivula, J. Phys. Chem. Lett., 2013, 4, 1624–1633 CrossRef CAS PubMed.
- W. Weng, L. Tang and W. Xiao, J. Energy Chem., 2018, 28, 128–143 CrossRef.
- V. Kaplan, E. Wachtel, K. Gartsman, Y. Feldman and I. Lubomirsky, J. Electrochem. Soc., 2015, 157, B552–B556 CrossRef.
- X. Wang, G. Licht, X. Liu and S. Licht, Sci. Rep., 2020, 10, 21518 CrossRef CAS PubMed.
- X. Wang, X. Liu, G. Licht, B. Wang and S. Licht, J. CO2 Util., 2019, 34, 303–312 CrossRef CAS.
- B. Deng, X. Mao, W. Xiao and D. Wang, J. Mater. Chem. A, 2017, 5, 12822–12827 RSC.
- M. Jiang, Z. Li, Y. Yu, H. Wu, W. Li, D. Ji, Y. Liu, Z. He and Z. Zhang, J. Electrochem. Soc., 2017, 164, D1022–D1027 CrossRef CAS.
- Y. K. Delimarskii, A. V. Gorodyskii and V. F. Grishchenko, Dokl. Akad. Nauk SSSR, 1964, 156, 650 CAS.
- D. Tang, H. Yin, X. Mao, W. Xiao and D. H. Wang, Electrochim. Acta, 2013, 114, 567–573 CrossRef CAS.
- H. V. Ijije, C. Sun and G. Z. Chen, Carbon, 2014, 73, 163–174 CrossRef CAS.
- L. Hu, B. Deng, K. Du, R. Jiang, Y. Dou and D. Wang, iScience, 2020, 23, 101607–101618 CrossRef CAS PubMed.
- Z. Li, G. Wang, W. Zhang, Z. Qiao and H. Wu, J. Electrochem. Soc., 2019, 166, D415–D420 CrossRef CAS.
- A. Douglas, R. Carter, M. Li and C. L. Pint, ACS Appl. Mater. Interfaces, 2018, 10, 19010–19018 CrossRef CAS PubMed.
- A. Douglas, R. Carter, N. Muralidharan, L. Oakes and C. L. Pint, Carbon, 2017, 116, 572–578 CrossRef CAS.
- J. Ren, M. Johnson, R. Singhal and S. Licht, J. CO2 Util., 2017, 18, 335–344 CrossRef CAS.
- G.-U. Luis, L. Fang-Fang, R. Jiawen, L. Jason and L. Stuart, Nano Lett., 2015, 15, 6142–6148 CrossRef.
- R. Jiang, M. Gao, X. Mao and D. Wang, Curr. Opin. Electrochem., 2019, 17, 38–46 CrossRef CAS.
- Y. Chen, M. Wang, S. Lu, J. Tu and S. Jiao, Electrochim. Acta, 2020, 331, 135461 CrossRef CAS.
- X. Chen, H. Zhao, H. Xie, J. Qu and H. Yin, Electrochim. Acta, 2019, 324, 134852 CrossRef CAS.
- F. Gao, X. Guo, J. Yin, D. Zhao, M. Li and L. Wang, RSC Adv., 2011, 1, 1301–1309 RSC.
- G. Dey, J. Ren, T. El-Ghazawi and S. Licht, RSC Adv., 2016, 6, 27191–27196 RSC.
- S. Yang, H. Song, X. Chen, A. V. Okotrub and L. G. Bulusheva, Electrochim. Acta, 2009, 52, 5286–5293 CrossRef.
- C. Zhai, N. Du, H. Zhang, J. Yu and D. Yang, ACS Appl. Mater. Interfaces, 2011, 3, 4067–4074 CrossRef CAS PubMed.
- W. Huang, Q. Cheng and Q. Xue, Russ. J. Electrochem., 2010, 46, 175–179 CrossRef CAS.
- J. M. Beér, Prog. Energy Combust. Sci., 2007, 33, 107–134 CrossRef.
- S. Licht, A. Douglas, J. Ren, R. Carter, M. Lefler and C. L. Pint, ACS Comb. Sci., 2016, 2, 162–168 CrossRef CAS PubMed.
- H. Wu, Z. Li, D. Ji, Y. Liu, L. Li, D. Yuan, Z. Zhang, J. Ren, M. Lefler, B. Wang and S. Licht, Carbon, 2016, 106, 208–217 CrossRef CAS.
- Z. Li, D. Yuan, H. Wu, W. Li and D. Gu, Inorg. Chem. Front., 2018, 5, 208–216 RSC.
|
| This journal is © The Royal Society of Chemistry 2021 |
Click here to see how this site uses Cookies. View our privacy policy here. 
 Open Access Article
 This Open Access Article is licensed under a Creative Commons Attribution-Non Commercial 3.0 Unported Licence
 *,
Mingzhi Wang
*,
Mingzhi Wang