 Open Access Article
Creative Commons Attribution 3.0 Unported Licence
Ho2Pd1.3Ge2.7 – a ternary AlB2-type cluster glass system†
Leszek S. Litzbarski*,
Tomasz Klimczuk and
Michał J. Winiarski
Faculty of Applied Physics and Mathematics, Advanced Materials Center, Gdansk University of Technology, Narutowicza 11/12, 80-232 Gdansk, Poland. E-mail: leszek.litzbarski@pg.edu.pl
First published on 21st July 2021
Abstract
We report a successful synthesis of a ternary AlB2-type intermetallic compound. The phase purity was obtained by fine-tuning the Pd![[thin space (1/6-em)]](https://www.rsc.org/images/entities/char_2009.gif) :
:![[thin space (1/6-em)]](https://www.rsc.org/images/entities/char_2009.gif) Ge ratio out of the idealized 1
Ge ratio out of the idealized 1![[thin space (1/6-em)]](https://www.rsc.org/images/entities/char_2009.gif) :
:![[thin space (1/6-em)]](https://www.rsc.org/images/entities/char_2009.gif) 3. Attempts to synthesize an Er analogue were not successful. We discuss the instability of the Er analogue based on the atomic size ratio and also suggest that the increased stability of Ho2Pd1+xGe3−x in the Pd-rich range likely stems from a combination of atomic size ratio, electronic, and entropic factors. The new Ho2Pd1.3Ge2.7 compound is found to exhibit cluster glass behavior with a freezing temperature of T ≈ 2.3 K.
3. Attempts to synthesize an Er analogue were not successful. We discuss the instability of the Er analogue based on the atomic size ratio and also suggest that the increased stability of Ho2Pd1+xGe3−x in the Pd-rich range likely stems from a combination of atomic size ratio, electronic, and entropic factors. The new Ho2Pd1.3Ge2.7 compound is found to exhibit cluster glass behavior with a freezing temperature of T ≈ 2.3 K.
Introduction
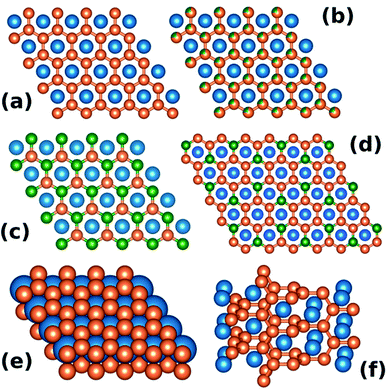
The hexagonal AlB2-type (space group P6/mmm, no. 191) is one of the simplest binary structure types. It consists of alternating hexagonal and honeycomb (graphite-like) layers formed by atoms occupying the 1a and 2d Wyckoff sites, respectively (see Fig. 1(a) and (e)). About 200 individual compounds1 are reported to crystallize in the AlB2-type structure, with more than 1500 intermetallics belonging to one of the 46 types that are related to the AlB2 aristotype.2 Fig. 1(b–d) shows sample ternary variants of the AlB2-type structure.Interesting physical properties are observed in many AlB2-type intermetallics, with the most notable example being high-Tc superconductivity (Tc = 39 K) in MgB2. Among the ternary compounds, Y2PdGe3, Y2PtGe3, and La2NiGe3 show superconductivity with Tc = 3.0, 3.3, and 0.45 K, respectively.3–5 Many members of the RE2TX3 family exhibit spin-glass-like behaviour e.g. Tm2Ni0.93Si2.94,6 Tb2Pd1.25Ge3, Dy2Pd1.25Ge2.75,7 Nd2PtGe3 (ref. 8) and Gd2NiSi3.9 However, Gd2CuGe3 is reported as an antiferromagnetic compound with the Neel temperature TN = 12 K.10 Another example worth noting is Pr2NiGe3, which shows two subsequent magnetic transitions at T = 12 K and T = 5.5 K.5
Two general factors are important for the stability of the AlB2-type structure: the relative sizes of atoms at the 1a and 2d sites and the valence electron count. As discussed by Chen et al.,11 the ratio of the unit cell parameters c/a, defined by the relative atomic radii of the constituent elements, governs the packing efficiency in the AlB2-type structure. For c/a < 1.074 the honeycomb layer is compressed due to loose packing within the hexagonal layer, and for c/a > 1.074 the honeycomb is stretched.
The importance of the valence electron count was illustrated in the case of the dimorphic ThSi2 compound by Zheng and Hoffmann.12 Depending on the parameters of the synthesis procedure (most notably the temperature) the ThSi2 can crystallize in one of the two structurally related allotropic variants: the tetragonal α-ThSi2 (Fig. 1(f)) or the AlB2-type hexagonal β-ThSi2 (Fig. 1(a and e)). As Zheng and Hoffmann show, the tetragonal, “twisted” α structure (see Fig. 1(e)) is stable for the electron count of >4.5 e− per Si atom.12 In case of ThSi2 the formal electron count is 6 (Th4+(Si2)4−) and in fact the β variant is found to be metastable.
Compounds within the ternary RE2TX3 family (RE – rare earth metal, T – transition metal, X – Si and Ge), which has been a subject of extensive research interest (see e.g. ref. 7, 9 and 13–19 and references therein), usually crystallize either in the disordered hexagonal AlB2-type or a variant of the tetragonal α-ThSi2 structure, depending both on the composition and preparation method.
Here we report the synthesis of a AlB2-type compound Ho2Pd1.3Ge2.7 which has previously been suggested to form in the Ho–Pd–Ge system.20 The phase is found to show spin-glass behaviour due to the presence of geometrical frustration and crystal lattice disorder. Our attempts to synthesize the analogous Er2Pd1+xGe3−x were not successful, yielding a heterogeneous material. We show that the instability of the Er analogue is caused by the geometrical (packing) factors, which also likely exclude the possibility of synthesizing Tm and Lu analogues, at least under ambient pressure.
Materials and methods
Polycrystalline samples of RE2Pd1+xGe3−x (RE = Ho, Er; x = 0–0.35) were prepared by melting appropriate amounts of high purity chemical elements i.e. germanium (99.999%, Alfa Aesar), palladium (99.95%, Alfa Aesar) and holmium (99.9%, Onyxmet) or erbium (99.9%, Onyxmet). Due to volatility of rare earth metals, these chemical elements were used in 2% molar excess. Samples were synthetized in arc furnace (MAM-1 GmbH Edmund Bühler) under purified (Zr-gettered) argon atmosphere. The ingots were re-melted several times by flipping every time to improve reaction among the constituent and promote volume homogeneity. Weight losses after melting process did not exceed 0.5%. Powder X-ray diffraction (pXRD) experiments were performed at room temperature on the powdered as-cast samples using Cu Kα radiation on Bruker D2 Phaser diffractometer equipped with XE-T detector. The crystal structure and phase purity were checked by Le Bail analysis of pXRD data using the FullProf software.13 Magnetic measurements were performed in temperature range 1.9–300 K in magnetic fields up to 9 T using a Quantum Design Physical Properties Measurement System (PPMS) equipped with AC Measurement System (ACMS). Magnetization measurements were performed for various magnetic fields after field cooling (FC) as well as zero field cooling (ZFC). The heat capacity data were collected in PPMS system by using standard thermal relaxation technique in the temperature range 1.9 K < T < 300 K.Electronic structure calculations were performed on a hypothetical nonmagnetic analogue Y2Pd1+xGe3−x by means of the density functional theory. The Korringa–Kohn–Rostoker method combined with the coherent potential approximation (KKR-CPA)21 was used as implemented in the Munich SPR-KKR 7.7 package and the xband 6.3 graphical user interface.
Results and discussion
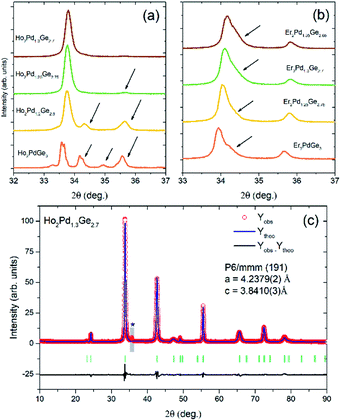
The room-temperature pXRD patterns for RE2Pd1+xGe3−x samples (Fig. 2) reveal the presence of additional impurity phase for fully stoichiometric Ho2PdGe3 and Er2PdGe3. These parasitic phase were identified as HoPd2Ge2 (ThCr2Si2-type structure) or ErPdGe2 (YIrGe2-type structure) and cannot be removed by thermal annealing. However, single-phase compounds can be synthetized by deliberately tweaking the proportion of initial stoichiometry by changing ratio Pd to Ge. Adjusting the Pd![[thin space (1/6-em)]](https://www.rsc.org/images/entities/char_2009.gif) :
:![[thin space (1/6-em)]](https://www.rsc.org/images/entities/char_2009.gif) Ge ratio has an effect both on the effective atomic size ratio and the electronic structure, as will be discussed later. No superstructure reflections were observed, in agreement with the assumed disordered AlB2-type structure.
Ge ratio has an effect both on the effective atomic size ratio and the electronic structure, as will be discussed later. No superstructure reflections were observed, in agreement with the assumed disordered AlB2-type structure.
The highest phase purity was obtained for x = 0.3 in Ho2Pd1.3Ge2.7. In case of Er2Pd1.3Ge2.7, the Bragg peaks were found to be strongly asymmetric, suggesting distortion from the AlB2-type structure and/or sample inhomogeneity. Similar effect is observed e.g. in solid solutions above the solubility limit. The only impurity peak observed in Ho2Pd1.3Ge2.7 appears at 2Θ ≈ 35.5° and likely arises from a trace amount of a tetragonal ternary Er–Pd–Ge ThSi2-type phase.
In Ho2Pd1.3G2.7 the 00l reflections are much more broadened than others, which suggest a presence of stacking faults in the structure, the anisotropic strain distribution, or a combination of both. In order to improve the Rietveld fit, the effect was modelled using the quartic model of anisotropic strain implemented in FullProf.22,23 A similar anisotropic broadening was also observed in Tb2Pd1+xGe3−x and Dy2Pd1+xGe3−x.7
Results of the Rietveld refinement are presented in Table S1 of the ESI.† The c/a ratio derived from the Rietveld fit for Ho2Pd1.3Ge2.7 is 0.91, suggesting that the PdGe3 honeycomb network is under a compressive strain. Reported cell parameters of RE2PdX3 (RE = rare-earth elements, X = Si, Ge) compounds are gathered in Table 1. The estimated c/a ≈ 0.88 for Er2Pd1+xGe2−x phase is lower than any of the reported values, suggesting the strongest compression within the ab plane leading to structural instability.
| Compound | a (Å) | c (Å) | c/a |
|---|---|---|---|
| Ni-bearing | |||
| Y2NiGe3 (ref. 24) | 4.066 | 4.025 | 0.99 |
| La2NiGe3 (ref. 24) | 4.180 | 4.334 | 1.04 |
| Ce2NiGe3 (ref. 25) | 4.164 | 4.243 | 1.02 |
| Nd2NiGe3 (ref. 26) | 4.145 | 4.182 | 1.01 |
| Gd2NiGe3 (ref. 5) | 4.085 | 4.119 | 1.01 |
| Ho2NiGe3 (ref. 5) | 4.060 | 3.970 | 0.98 |
![[thin space (1/6-em)]](https://www.rsc.org/images/entities/char_2009.gif) |
|||
| Pd-bearing | |||
| Y2PdGe3 (ref. 27) | 4.192 | 4.000 | 0.95 |
| Nd2PdGe3 (ref. 27) | 4.241 | 4.193 | 0.99 |
| Gd2PdGe3 (ref. 28) | 4.215 | 4.049 | 0.96 |
| Tb2Pd1.25Ge2.75 (ref. 7) | 4.229 | 3.943 | 0.93 |
| Dy2Pd1.25Ge2.75 (ref. 7) | 4.230 | 3.944 | 0.93 |
| Ho2Pd1.3Ge2.7 | 4.238 | 3.841 | 0.91 |
| Er2Pd1.3Ge2.7 | 4.256 | 3.732 | 0.88 |
![[thin space (1/6-em)]](https://www.rsc.org/images/entities/char_2009.gif) |
|||
| Pt-bearing | |||
| Y2PtGe3 (ref. 4) | 4.196 | 3.994 | 0.95 |
| Nd2PtGe3 (ref. 8) | 4.246 | 4.193 | 0.99 |
The stabilizing effect of adjusting the Pd![[thin space (1/6-em)]](https://www.rsc.org/images/entities/char_2009.gif) :
:![[thin space (1/6-em)]](https://www.rsc.org/images/entities/char_2009.gif) Ge ratio may stem from combination of a number of factors, including (a) change in the effective relative atomic radii of the honeycomb and hexagonal layer atoms, (b) change in the electronic structure, as introducing additional Pd atoms changes the valence electron count, and (c) entropic stabilization.
Ge ratio may stem from combination of a number of factors, including (a) change in the effective relative atomic radii of the honeycomb and hexagonal layer atoms, (b) change in the electronic structure, as introducing additional Pd atoms changes the valence electron count, and (c) entropic stabilization.
The latter is rather a subtle effect in case of Ho2Pd1+xGe3−x as the relative difference in mixing entropy  (with ci standing for fractional atomic concentrations of Pd and Ge) between the 1
![[thin space (1/6-em)]](https://www.rsc.org/images/entities/char_2009.gif) :
:![[thin space (1/6-em)]](https://www.rsc.org/images/entities/char_2009.gif) 3 and 1.3
3 and 1.3![[thin space (1/6-em)]](https://www.rsc.org/images/entities/char_2009.gif) :
:![[thin space (1/6-em)]](https://www.rsc.org/images/entities/char_2009.gif) 2.7 ratio is only ca. 12%. This might be, however, an important contribution in case of systems that are on the edge of instability.29,30
2.7 ratio is only ca. 12%. This might be, however, an important contribution in case of systems that are on the edge of instability.29,30
The problem of estimation of the effective atomic size is rather complicated in the Ho2Pd1+xGe3−x. Depending on the type of atomic size measure (atomic, covalent, or ionic radius) and the specific way it is estimated, the relative size of Pd with respect to Ge can vary substantially. If the covalent radii are taken, as tabulated by Cordero et al.,31 Pd is about 16% larger than Ge (1.39(6) pm vs. 1.20(4) pm, respectively). In case of Slater's atomic radii,32 Pd is 12% larger than Ge. Since the Pd–Ge honeycomb layer is under a compressive stress in Ho2Pd1+xGe3−x, the stabilizing effect of introducing a larger atom is rather surprising, suggesting that the electronic structure factors might be important in this case. It is worth noting, however, that if one considers the electronic density-based atomic radii by Rahm, Hoffmann and Ashcroft,33,34 the Pd is smaller by ca. 8% than Ge. The atomic size ratio effect is also consistent with the fact that the RE2PdGe3 compounds with larger RE lanthanides seem to be stable with the nominal Pd![[thin space (1/6-em)]](https://www.rsc.org/images/entities/char_2009.gif) :
:![[thin space (1/6-em)]](https://www.rsc.org/images/entities/char_2009.gif) Ge ratio 1
Ge ratio 1![[thin space (1/6-em)]](https://www.rsc.org/images/entities/char_2009.gif) :
:![[thin space (1/6-em)]](https://www.rsc.org/images/entities/char_2009.gif) 3.
3.
The results of electronic structure calculations on a hypothetical Y2Pd1+xGe3−x system with lattice parameters set to the values obtained for Ho2Pd1.3Ge2.7, show that the introduction of additional Pd only weakly affects the electronic density of states (Fig. S1 of the ESI†) and band structure in a manner that cannot be easily described within a rigid band approximation (simple shifting of the Fermi level EF with changing the number of valence electrons). The DOS peak centered at around −3 eV is slightly broadened and increased in height in case of “Y2Pd1.3Ge2.7” compared to the nominal 1![[thin space (1/6-em)]](https://www.rsc.org/images/entities/char_2009.gif) :
:![[thin space (1/6-em)]](https://www.rsc.org/images/entities/char_2009.gif) 3 stoichiometry.
3 stoichiometry.
Thus, the stabilizing effect of increased Pd cannot be simply ascribed to any particular factor. Moreover, since the samples are synthesized by arc-melting the constituent elements, changing of the Pd![[thin space (1/6-em)]](https://www.rsc.org/images/entities/char_2009.gif) :
:![[thin space (1/6-em)]](https://www.rsc.org/images/entities/char_2009.gif) Ge ratio may also influence the synthetic conditions (the liquidus temperature of 13
Ge ratio may also influence the synthetic conditions (the liquidus temperature of 13![[thin space (1/6-em)]](https://www.rsc.org/images/entities/char_2009.gif) :
:![[thin space (1/6-em)]](https://www.rsc.org/images/entities/char_2009.gif) 27 Pd–Ge alloy is about 60 °C lower than of 1
27 Pd–Ge alloy is about 60 °C lower than of 1![[thin space (1/6-em)]](https://www.rsc.org/images/entities/char_2009.gif) :
:![[thin space (1/6-em)]](https://www.rsc.org/images/entities/char_2009.gif) 3,35 resulting in an easier melting of the metallic button).
3,35 resulting in an easier melting of the metallic button).
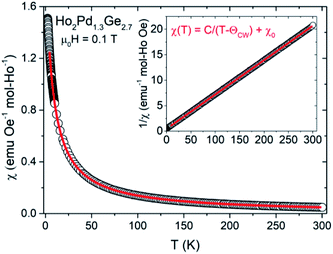
The DC magnetic susceptibility (χ = M/H) as a function of temperature were made under an applied magnetic field 0.01, 0.1 and 1 T for Ho2Pd1.3Ge2.7 As shown in Fig. 3, χ(T) increases with decreasing temperature, which is typical behavior for Curie–Weiss paramagnets. This dependence can be described by the formula:
| χ = χ0 + C/(T − θCW) |
where kB is the Boltzmann constant, μB is the Bohr magneton and NA is the Avogadro number. Obtained values are found to close to the theoretical free ion value of Ho3+.
| Freezing temp., Tf (K) | 2.3 |
| Frustration index, f | 3.3 |
| Weiss temp., θCW (K) | −7.5 |
| Effective magnetic moment, μeff (μB) | 10.94 |
| Activation energy, Ea/kB (K) | 23 |
| T0 (K) | 1.5 |
| Tholence parameter, δTTh | 0.32 |
| M0 (emu g−1) | 0.44 |
| Magnetic viscosity, S (emu g−1) | 0.0024 |
Results of low-temperature χDC(T) measurements in zero field cooling (ZFC) as well as field cooling (FC) conditions for different applied magnetic fields are shown in Fig. 4. For Ho2Pd1.3Ge2.7 in both measurement modes a maxima is observed around T = 2 K. Low field (100 Oe) curves deviate below this temperature, which suggests the presence of irreversibility associated with magnetic metastability in this compound.12 The transition temperature TT = 2.3 K (defined as the position of the maximum of d(χT)/dT). Moreover TT is strongly suppressed by an applied magnetic field. The transition temperature is over three times smaller than |θCW|. The empirical measure of frustration, defined as f = |θCW|/TT, is f = 3.3, which implies strong magnetic frustration and suggests formation of a glassy state rather than an antiferromagnetic order. This hypothesis may be confirmed by the field dependence of isothermal (T = 2 K) magnetization depicted in the inset of Fig. 4. No magnetic hysteresis is observed down to 2 K and a “S”-shape behavior of M(H) can be seen. Despite the application of strong magnetic field (μ0H = 9 T) the magnetization curves do not saturate, which is probably due to lack of long-range magnetic ordering. The same phenomenon was observed in case Tb2Pd1.25Ge2.75 and Dy2Pd1.25Ge2.75.9 For that reason a peak of magnetization around TT may be interpreted as a result of spin-freezing transition.
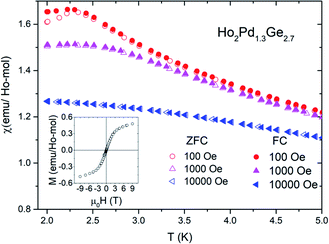 | ||
| Fig. 4 The difference between ZFC and FC magnetic susceptibility of Ho2Pd1.3Ge2.7 at different applied magnetic field. Insets shows M(H) curves for Ho2Pd1.3Ge2.7 at T = 2 K. | ||
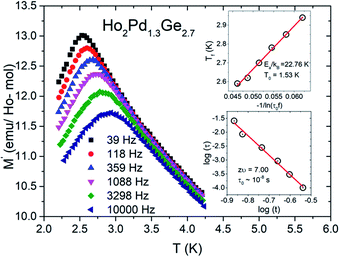
To confirm spin/cluster-glass behavior, AC susceptibility measurements were carried out in an excitation field 3 Oe for frequencies ν = 39, 118, 359, 1088, 3298 and 10![[thin space (1/6-em)]](https://www.rsc.org/images/entities/char_2009.gif) 000 Hz (logarithmic spacing). The real part of AC magnetization (M′) as a function of temperature for various frequencies is plotted for Ho2Pd1.3Ge2.7 in Fig. 5. The maximum of M′ appears close to the irreversibility temperature obtained from χDC(T). Moreover this peak is very sensitive to the applied frequency and shifts to higher temperature region with increase in AC frequency, which reveals glassy formation in this compound.7,12,16,17 In a typical glassy systems the relative shift in freezing temperature can be described by the δTf parameter:7
000 Hz (logarithmic spacing). The real part of AC magnetization (M′) as a function of temperature for various frequencies is plotted for Ho2Pd1.3Ge2.7 in Fig. 5. The maximum of M′ appears close to the irreversibility temperature obtained from χDC(T). Moreover this peak is very sensitive to the applied frequency and shifts to higher temperature region with increase in AC frequency, which reveals glassy formation in this compound.7,12,16,17 In a typical glassy systems the relative shift in freezing temperature can be described by the δTf parameter:7
For a glassy systems spin freezing state can be modeled by the power law:7,8
The second plausible interpretation of the freezing process can be expressed by empirical Vogel–Fulcher law:16,17
which is fitted to data shown in the inset of Fig. 5. The best estimated values of T0 and Ea for Ho2Pd1.3Ge2.7 are gathered in Table 2. The Ea/(kBT0) ratio is much greater than 1, which indicates a weak coupling between the magnetic entities and is typically observed for cluster-glass systems.36 Another evidence of formation spin-glass like state in Ho2Pd1.3Ge2.7 is Tholence criterion:37 δTTh = (Tf − T0)/Tf = 0.32, which is in agreement with the cluster glass scenario.
The time evolution of magnetization resulting from slow relaxation is shown in Fig. S2 in ESI† and was studied through ZFC measurements at different temperatures (T = 1.8, 2.5 and 5 K). Samples were cooled under zero applied magnetic field to required temperature and after waiting for a certain time small amount of magnetic field (Hdc = 1000 Oe) was applied to measure the time dependence of magnetization. This phenomenon, called also an ageing effect, is caused by non-equilibrium dynamical state below freezing temperature and is characteristic behavior for different types of glassy systems.7,12,19–21 The relaxation process are commonly described by equation: M(t) = M0 + S![[thin space (1/6-em)]](https://www.rsc.org/images/entities/char_2009.gif) ln(t/t0 + 1), where M0 is magnetization at t = 0 and S is the magnetic viscosity.20,21 Both these parameters are depending on temperature in contrast to t0, which depends on the measuring conditions and have only limited physical relevance and is typically orders of magnitude larger than intrinsic relaxation time.21 The red solid line in Fig. S2† show the best fitting results obtained by the last-squares method. Estimated values of M0 and S for compounds with Ho and Er are collected in Table 2 and are in good agreement with data found in literature.19–21 It is worth to note that the absence of magnetic relaxation behavior for measurements above Tf is expected as the aging effect exist only in glassy-state.
ln(t/t0 + 1), where M0 is magnetization at t = 0 and S is the magnetic viscosity.20,21 Both these parameters are depending on temperature in contrast to t0, which depends on the measuring conditions and have only limited physical relevance and is typically orders of magnitude larger than intrinsic relaxation time.21 The red solid line in Fig. S2† show the best fitting results obtained by the last-squares method. Estimated values of M0 and S for compounds with Ho and Er are collected in Table 2 and are in good agreement with data found in literature.19–21 It is worth to note that the absence of magnetic relaxation behavior for measurements above Tf is expected as the aging effect exist only in glassy-state.
The main panel of Fig. S3 of ESI† depicts zero-field heat capacity Cp as a function of temperature for Ho2Pd1.3Ge2.7 The Cp saturates value at room temperature near the classical Dulong–Petit value, Cp = 3nR ≈ 150 J mol−1 K−1, where n is the number of atoms per formula unit (n = 6) and R is the gas constant (R = 8.314 J mol−1 K−1). The inset of Fig. S2† exhibit dependence of Cp/T at low temperatures. The broad peak around Tf can indicate a magnetic phase transition and is in a good agreement with magnetization measurements data. The shape of this peak may suggest the absence of long range antiferromagnetic order and is similar to that observed for other glassy magnetic materials.7–9,12
Magnetization and heat capacity results suggest a glassy transition in contrast to long-range AFM order observed in Ho2PdSi3 single crystals.38 The difference of magnetic properties between Ge- and Si-bearing compound likely stems from the higher degree of lattice disorder present in the former which manifests itself in rather broad XRD peaks with strong anisotropic broadening found in Ho2Pd1.3Ge2.7. In Ho2PdSi3 single crystals the presence of a long-range superstructure along the c direction is possible, as it was observed in Gd2PdSi3.39
Conclusions
A polycrystalline sample of a new AlB2-type intermetallic compound Ho2Pd1.3Ge2.7 was synthesized by an arc-melting technique. We have shown that the phase stability is improved by tuning the Pd![[thin space (1/6-em)]](https://www.rsc.org/images/entities/char_2009.gif) :
:![[thin space (1/6-em)]](https://www.rsc.org/images/entities/char_2009.gif) Ga ratio out of the ideal 1
Ga ratio out of the ideal 1![[thin space (1/6-em)]](https://www.rsc.org/images/entities/char_2009.gif) :
:![[thin space (1/6-em)]](https://www.rsc.org/images/entities/char_2009.gif) 3.
3.
Attempts to synthesize an Er analogue resulted in heterogeneous materials. Its instability can be understood in terms of atomic packing factor. Obtained magnetization and heat capacity results suggest that Ho2Pd1.3Ge2.7 exhibits a spin-glass like behavior with freezing temperature Tf = 2.3 K.
Conflicts of interest
There are no conflicts to declare.Acknowledgements
This work was supported by Ministry of Science and Higher Education (Poland) under project 0142/DIA/2018/47 (“Diamentowy Grant”).Notes and references
- J. Dshemuchadse and W. Steurer, Some Statistics on Intermetallic Compounds, Inorg. Chem., 2015, 54, 1120–1128 CrossRef CAS PubMed.
- R.-D. Hoffmann and R. Pöttgen, AlB2-related intermetallic compounds – a comprehensive view based on group-subgroup relations, Z. Kristallogr. - Cryst. Mater., 2001, 216, 127–145 CrossRef CAS.
- E. V. Sampathkumaran, S. Majumdar, W. Schneider, S. L. Molodtsov and C. Laubschat, Superconductivity in Y2PdGe3, Phys. B, 2002, 312–313, 152–154 CrossRef.
- H. Kitô, Y. Takano and K. Togano, Superconductivity in ternary germanide Y(Pt0.5Ge1.5) with the AlB2-type structure, Phys. C, 2002, 377, 185–189 CrossRef.
- J. Chen, S. Guan and C. Wang, Electrical and Magnetic Properties of the Ni based Ternary Compounds R2NiGe3 (R = Rare Earth Ions), J. Phys.: Conf. Ser., 2011, 266, 012006 CrossRef.
- S. Pakhira, C. Mazumdar and R. Ranganathan, Low-field induced large magnetocaloric effect in Tm2Ni0.93Si2.93: influence of short-range magnetic correlation, J. Phys.: Condens. Matter, 2017, 29, 505801 CrossRef PubMed.
- L. S. Litzbarski, T. Klimczuk and M. J. Winiarski, Synthesis, structure and physical properties of new intermetallic spin glass-like compounds RE2PdGe3 (RE = Tb and Dy), J. Phys.: Condens. Matter, 2020, 32, 225706 CrossRef CAS PubMed.
- L. S. Litzbarski, M. J. Winiarski, P. Skokowski, T. Klimczuk and B. Andrzejewski, Investigation of magnetic order in a new intermetallic compound Nd2PtGe3, J. Magn. Magn. Mater., 2020, 521, 167494 CrossRef.
- S. Pakhira, C. Mazumdar, R. Ranganathan, S. Giri and M. Avdeev, Large magnetic cooling power involving frustrated antiferromagnetic spin-glass state in R2NiSi3 (R = Gd, Er), Phys. Rev. B, 2016, 94, 104414 CrossRef.
- S. Majumdar and E. V. Sampathkumaran, Magnetic behavior of Gd2CuGe3 Electrical resistance minimum above the Neel temperature, Phys. Rev. B: Condens. Matter Mater. Phys., 2000, 61, 43–45 CrossRef CAS.
- X. L. Chen, Q. Y. Tu, L. Dai and Y. P. Xu, A note on the AlB2 type structure, Mod. Phys. Lett. B, 2002, 16, 73–77 CrossRef CAS.
- C. Zheng and R. Hoffmann, Conjugation in the 3-connected net: the aluminum diboride and thorium disilicide structures and their transition-metal derivatives, Inorg. Chem., 1989, 28, 1074–1080 CrossRef CAS.
- M. Szlawska, A. Pikul and D. Kaczorowski, Ferromagnetic and spin-glass properties of single-crystalline U2NiSi3, Mater. Sci.-Pol., 2007, 25, 1267–1273 CAS.
- M. Szlawska and D. Kaczorowski, Antiferromagnetic order and Kondo effect in single-crystalline Ce2IrSi3, Phys. Rev. B: Condens. Matter Mater. Phys., 2011, 84, 094430 CrossRef.
- M. Szlawska and D. Kaczorowski, Magnetic ordering and Kondo behavior in single-crystalline Ce2NiS3, Phys. Rev. B: Condens. Matter Mater. Phys., 2012, 85, 134423 CrossRef.
- M. Szlawska, M. Majewicz and D. Kaczorowski, Ferromagnetic ordering in single-crystalline U2RhSi3 with fully ordered crystal structure, J. Alloys Compd., 2016, 662, 208–212 CrossRef CAS.
- D. Li, S. Nimori, Y. Shiokawa, Y. Haga, E. Yamamoto and Y. Onuki, Ac susceptibility and magnetic relaxation of R2PdSi3 (R = Nd, Tb, and Dy), Phys. Rev. B: Condens. Matter Mater. Phys., 2003, 68, 012413 CrossRef.
- R. Baumbach, A. Gallagher, T. Besara, J. Sun, D. Singh, J. Thompson, F. Ronning and E. Bauer, Complex magnetism and strong electronic correlations in Ce2PdGe3, Phys. Rev. B: Condens. Matter Mater. Phys., 2015, 91, 035102 CrossRef.
- S. Sarkar and S. C. Peter, Structural Phase Transitions in a New Compound Eu2AgGe3, Inorg. Chem., 2013, 52, 9741–9748 CrossRef CAS PubMed.
- O. L. Sologub and P. S. Salamakha, Isothermal section of the ternary system Ho–Pd–Ge at 870 K, J. Alloys Compd., 1999, 291, 181–183 CrossRef CAS.
- A. Bansil, S. Kaprzyk, P. E. Mijnarends and J. Toboła, Electronic structure and magnetism of Fe3-xVxX (X = Si, Ga, and Al) alloys by the KKR-CPA method, Phys. Rev. B: Condens. Matter Mater. Phys., 1999, 60, 13396–13412 CrossRef CAS.
- J. Rodríguez-Carvajal, Recent advances in magnetic structure determination by neutron powder diffraction, Phys. B, 1993, 192, 55–69 CrossRef.
- J. Rodríquez-Carvajal and T. Roisnel, Line broadening analysis using FullProf*: determination of microstructural properties, Mater. Sci. Forum, 2004, 443, 123–126 Search PubMed.
- J. W. Chen, S. Y. Guan, C. H. Wang and S. P. Ho, Superconductivity of the Ni-based ternary compounds with AlB2-type structure Y2NiGe3 and La2NiGe3, Phys. C, 2012, 477, 63–65 CrossRef CAS.
- D. Huo, J. Sakurai, T. Kuwai, Y. Isikawa and Q. Lu, Electric, magnetic, and thermal properties of Ce2NiGe3: a Kondo lattice compound showing spin glass behavior, Phys. Rev. B: Condens. Matter Mater. Phys., 2001, 64, 224405 CrossRef.
- S. Sarkar, D. Kalsi, S. Rayaprol and S. C. Peter, Structural and magnetic properties of Nd2NiGe3, J. Alloys Compd., 2015, 632, 172–177 CrossRef CAS.
- S. Majumdar and E. V. Sampathkumaran, Observation of enhanced magnetic transition temperature in Nd2PdGe3 and superconductivity in Y2PdGe3, Phys. Rev. B: Condens. Matter Mater. Phys., 2001, 63, 172407 CrossRef.
- S. Majumdar, M. M. Kumar and E. V. Sampathkumaran, Magnetic behavior of a new compound, Gd2PdGe3, J. Alloys Compd., 1999, 288, 61–64 CrossRef CAS.
- M. J. Winiarski and T. M. McQueen, Stabilization of the pyrochlore phase of Mn2Sb2O7 by double substitution, J. Solid State Chem., 2019, 278, 120898 CrossRef CAS.
- L. A. Pressley, A. Torrejon, W. A. Phelan and T. M. McQueen, Discovery and Single Crystal Growth of High Entropy Pyrochlores, Inorg. Chem., 2020, 59, 17251–17258 CrossRef CAS PubMed.
- B. Cordero, V. Gómez, A. E. Platero-Prats, M. Revés, J. Echeverría, E. Cremades, F. Barragán and S. Alvarez, Covalent radii revisited, Dalton Trans., 2008, 2832–2838 RSC.
- J. C. Slater, Atomic Radii in Crystals, J. Chem. Phys., 1964, 41, 3199–3204 CrossRef CAS.
- M. Rahm, R. Hoffmann and N. W. Ashcroft, Atomic and Ionic Radii of Elements 1–96, Chem.–Eur. J., 2016, 22, 14625–14632 CrossRef CAS PubMed.
- M. Rahm, R. Hoffmann and N. W. Ashcroft, Corrigendum: Atomic and Ionic Radii of Elements 1–96, Chem.–Eur. J., 2017, 23, 4017 CrossRef CAS PubMed.
- H. Okamoto, The Ge-Pd system (germanium-palladium), J. Phase Equilib., 1992, 13, 410–413 CrossRef CAS.
- A. F. Gubkin, E. A. Sherstobitova, P. B. Terentyev, A. Hoser and N. V. Baranov, A cluster-glass magnetic state in R5Pd2 (R = Ho, Tb) compounds evidenced by AC-susceptibility and neutron scattering measurements, J. Phys.: Condens. Matter, 2013, 25, 236003 CrossRef CAS PubMed.
- J.-L. Tholence, Recent experiments about the spin-glass transition, Physica B+C, 1984, 126, 157–164 CrossRef CAS.
- F. Tang, P. Link, M. Frontzek, J.-M. Mignot, J.-U. Hoffmann, W. Löser and M. Loewenhaupt, Neutron diffraction study of magnetic structures in single crystal Ho2PdSi3 in magnetic fields up to 5 T, J. Phys.: Conf. Ser., 2010, 251, 012017 CrossRef CAS.
- T. Kurumaji, T. Nakajima, M. Hirschberger, A. Kikkawa, Y. Yamasaki, H. Sagayama, H. Nakao, Y. Taguchi, T. Arima and Y. Tokura, Skyrmion lattice with a giant topological Hall effect in a frustrated triangular-lattice magnet, Science, 2019, 365, 914–918 CrossRef CAS PubMed.
Footnote |
| † Electronic supplementary information (ESI) available. CCDC 2094797. For ESI and crystallographic data in CIF or other electronic format see DOI: 10.1039/d1ra04422b |
| This journal is © The Royal Society of Chemistry 2021 |

