 Open Access Article
Nano-silica extracted from rice husk and its application in acetic acid steam reforming
Wenwen Guoa,
Guoneng Lia,
Youqu Zheng *ab and
Ke Lia
aDepartment of Energy and Environment System Engineering, Zhejiang University of Science and Technology, Hangzhou 310023, China. E-mail: zyq888@zust.edu.cn
bCollege of Mechanical Engineering, Quzhou University, Quzhou 324000, China
First published on 28th October 2021
Abstract
Nano-silica extracted from rice husk and its application in acetic acid steam reforming was studied in the paper. A simple and efficient heat treatment method was used to extract high specific surface area silica from rice husk. It was found that the acid leaching process was beneficial for the removal of metal impurities and the decomposition of organic substances. The carbon residue decreased and sample purity increased with increasing temperature. At 600 °C, silica with the yield of 21.7% and the purity of 99.45% was obtained. The specific surface area was as high as 335 m2 g−1, and the corresponding average pore diameter was 4.95 nm. Nano-silica extracted from rice husk was applied as a support in the preparation of an acetic acid steam reforming catalyst (Ni/RH-SiO2). Ni/RH-SiO2 showed a better performance than Ni/SiO2, which may be due to the higher interaction between Ni and SiO2 in Ni/RH-SiO2. When the reforming temperature was 700 °C, carbon conversion of 95.3% and H2 yield of 2.38 mol mol−1 were obtained. Carbon deposition was found after a 6 h test, mainly in the form of filamentous carbon. The carbon deposition amount of spent-Ni/RH-SiO2 was lower than that of spent-Ni/SiO2.
1 Introduction
As agricultural waste, the annual output of rice husks is 120 million tons worldwide.1 Compared with other biomass, the main content of rice husk ash is silicon dioxide (20 wt%).2 It can be extracted and has a wide range of applications, for example, being used as filler,3 catalyst support,4 and lithium-ion battery material,5 etc. Hydrogen is recognized as a clean fuel. One of the hydrogen production methods is bio-oil steam reforming. Nano-silica can be extracted from rice husk and utilized as a catalyst support in acetic acid steam reforming, which seems attractive and worth studying.Methods of extracting silicon dioxide from rice husk include sol–gel method, lye method, precipitation method and heat treatment method. The sol–gel method involves low-temperature hydrolysis and polycondensation.6 SiO2 particles prepared by this method have an uniform particle size distribution. But the process has a long cycle of production, high pollution and high cost, which is not suitable for industrial production. The lye method is to mix alkaline solution and rice husk ash to dissolve the rice husk ash in silicon dioxide, which consumes a large amount of lye. Commonly used lyes include NaOH solution and K2CO3 solution. Cui7 et al. produced porous silica by NaOH extraction followed by sol–gel process.
The heat treatment method generally consumes less chemical reagent, which is environment friendly, simple and effective. It involved the elimination of metal impurities in the rice husk through a pretreatment process, and then calcination in an oxygen-containing atmosphere to obtain a high-purity ultra-fine silica product. Liou8 studied the effect of heating rates on the properties of rice husk-based nano-SiO2 prepared by heat treatment method. When the heating rate was 5 °C min−1, the specific surface area of the nano-SiO2 reached 235 m2 g−1, the average pore diameter and particle size was 5.4 and 60 nm, and the purity of SiO2 was 99.7%. Umeda9 et al. removed metal impurities in the rice husks by citric acid in the pretreatment, and then burned the rice husk in an air atmosphere at 1073–1273 K to obtain SiO2 with a purity of 99.5–99.8%.
The pyrolysis temperature may influence the SiO2 structure and purity. Gu10 et al. studied the effect of pyrolysis temperature and rice husk particle size on the purity of SiO2 prepared by heat treatment. It was found that the purity of SiO2 can reach 99.9% under optimal conditions. Javed11 et al. performed thermogravimetric experiments to compare the pyrolysis behavior of silicon-containing agricultural wastes, including rice husks, wheat husks and bagasse. It was found that SiO2 yield was closely related to the types of raw materials. Li12 et al. extracted nano-SiO2 from rice husk and applied it as supports for the preparation of nano-Au catalyst. The rice husk was refluxed with 5% HCl, and then calcined at 700 °C for 2 hours to obtain 60–70 nm SiO2. Abadi13 used an infrared technology to characterize the structure of SiO2 obtained at different heat treatment temperatures, and found that the Si–O–Si bonds of the samples had different infrared absorption characteristic peaks.
Catalysts for steam reforming of bio-oil for hydrogen production mainly include Ni-based catalysts,14–17 Co based catalysts,18–20 noble metal catalysts,21,22 etc. Among them, Ni-based catalyst has the ability to break C–C bond and promote water gas shift reaction,23 which is an efficient catalyst for bio-oil steam reforming. The active components are generally loaded onto carriers to obtain a higher specific surface area and to improve the catalytic efficiency. The steam reforming temperature is high, and the carriers have to be able to withstand high temperatures. It includes Al2O3,24–26 CeO2,27,28 SiO2.29–31 Al2O3 posses large specific surface area and a certain amount acid site which can promote the acetic acid dehydration. Many researchers have devoted to it. Zhang24 et al. studied the performance of acetic acid reforming over Ni/Al2O3 catalyst and found that the Ni loading amount would greatly affect the performance of the catalyst. There was an interaction between metal Ni and carrier Al2O3. In addition, the Ce–Zr–O carrier had oxygen storage capacity and did good performance in steam reforming. Guo28 et al. prepared Ni/Ce2–ZrO2 catalyst by co-precipitation method for ethanol reforming. When GHSV = 345 h−1, S/C = 9.2, T = 825 °C, ethanol conversion reached 100%. SiO2 is acidic oxides and generally possess a high specific surface area, which shows potential in bio-oil steam reforming. Thyssen30 et al. applied Ni/La2O3–SiO2 catalyst in glycerol steam reforming, and found that the addition of La2O3 in the Ni/SiO2 catalyst could inhibit the formation of carbon deposition. Wu31 et al. prepared nano-Ni/SiO2 catalyst for ethanol reforming. When the Ni loading amount of 20% and the catalyst mass of 0.3 g were set, H2 yield reached 0.24 g h−1.
The article aims to prepare high specific silica from rice husk by heat treatment method. The purity and particle size of silica can be obtained by adjusting the calcination temperature. And the prepared silica was utilized as catalyst support in the acetic steam reforming for the first time. The catalytic performance was explored and compared with Ni/SiO2 (SiO2 was provided by XFNANO technology Inc.).
2 Materials and methods
2.1 Materials
The chemical compositions of rice husk vary depending on the regions, climates and rice husk growing areas. The rice husk was bought from a rice processing plant in Jiangsu China. The proximate analysis and elemental analysis are shown in Table 1, the ash content of rice husk is 19.71% and the chemical composition of the ash is determined by XRF. As list in Table 2, it contains high amount of silica (96.203 wt%) and appears a good silica source for silica extraction.| Material | Proximate analysis wt% | Elemental analysis wt% | |||||
|---|---|---|---|---|---|---|---|
| Mad | Aad | Vad | FCad | C | H | N | |
| Rice husk | 6.81 | 19.71 | 59.8 | 13.68 | 40.71 | 4.97 | 0.49 |
| Component | Amount in ash (wt%) | Amount in rice husk (wt%) |
|---|---|---|
| SiO2 | 96.203 | 18.952 |
| K2O | 1.510 | 0.297 |
| SO3 | 0.855 | 0.168 |
| CaO | 0.797 | 0.157 |
| Fe2O3 | 0.422 | 0.083 |
| Cr2O3 | 0.067 | 0.013 |
| MnO | 0.058 | 0.011 |
| CuO | 0.048 | 0.009 |
| ZnO | 0.020 | 0.004 |
2.2 Experiment process
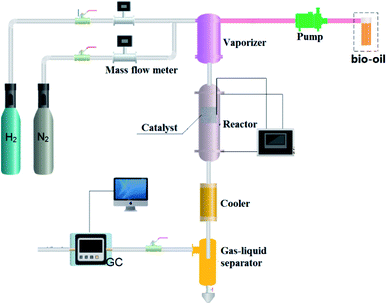
Steam reforming experiment: Ni/SiO2 was loaded in the quartz tube. Before the test, the catalyst was reduced at 700 °C for 2 h, and then cooled to the reaction temperature with N2 purging. In the experiment, N2 was used as the internal standard gas. The experimental flow chart is shown in Fig. 1. The liquid feed is sent to the vaporize by pump for vaporization. Carrier gas enters the vaporize through the mass flowmeter, and then it is fully mixed with the evaporated reactants and enters the fixed-bed reactor for reaction. After the reaction, the products are condensed in a gas–liquid separator. The gas products are analyzed by online gas chromatography, and the liquid products are collected and analyzed later.
Acetic acid conversion is defined as:
 | (1) |
H2 yield is defined as:
 | (2) |
2.3 Sample characterization
The specific surface area and pore structure of the samples were measured by ASAP2020 specific surface area and pore volume analyzer (Micromeritics, USA). Before the test, the sample was degassed at 150 °C for 4 hours. The element analysis of the sample was performed on the X-ray fluorescence spectrometer (EDX-7000, XRF) measuring instrument. The morphology of the sample was measured by S4800 cold field emission scanning electron microscope (SEM) produced in Japan. The thermogravimetric experiments of rice husk and spent catalyst were carried out on the SDT Q600 V20.9 Build 20 thermogravimetric analyzer. A 5 mg sample was put into a ceramic crucible, and heated from room temperature to 800 °C with a heating rate of 10 K min−1. The corresponding thermogravimetric (TG) curve and thermogravimetric derivative (DTG) curve were obtained. FTIR/FT-FIR spectrum analyzer (Thermo Fisher scientific) was used to analyze the product infrared spectrum diagram. The test conditions were set at resolution 4 cm−1 and wavelength range 400–4000 cm−1. H2 TPR was conducted on Autochem II 2920. The catalyst was load in a U-shape tube, and then heated from 50 to 800 °C at a rate of 10 °C min−1 under 10% H2/Ar. The H2 consumption amount was detected by TCD.3 Results and discussion
3.1 The effect of acid treatment on the rice husk pyrolysis behavior
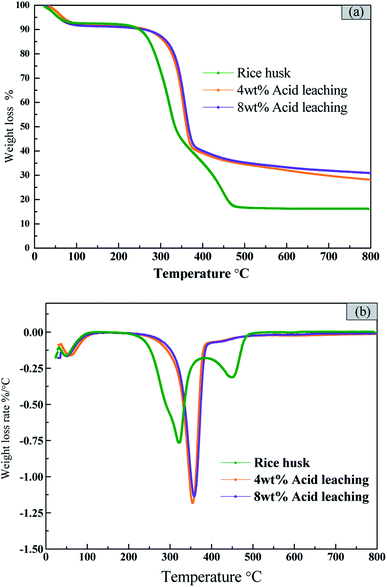
The acid concentration not only has an effect on the purity of the product, but also may affect the thermal decomposition behavior of rice husk. And the thermogravimetric analysis of the original rice husk and acid-treated rice husk was performed to analyze the effect of acid treatment on the pyrolysis of rice husk. It can be seen from Fig. 2(a) that the pyrolysis process of the original rice husk is roughly divided into three stages. The first stage is from room temperature to 100 °C, which is the dehydration and drying process of the rice husk. The second stage is 200–380 °C. The decomposition of cellulose and hemicellulose is mainly occurred at the stage. They are very active, and almost completely decomposed at 380 °C. The maximum weight loss rate of rice husk is −0.75%/°C with the corresponding temperature of 322 °C. The temperature higher than 380 °C corresponds to the third pyrolysis stage, in which the pyrolysis and carbonization of the residue and the pyrolysis of lignin mainly occur.For the rice husk pretreated with 4 wt% and 8 wt% acid, the shapes of TG curves and DTG curves are similar (Fig. 2(b)). The weight loss peak at stage I (from room temperature to 100 °C) is the same as that of original rice husk, which is the dehydration and drying process of the rice husk. After the acid leaching, the weight loss peak at stage II moves to the high temperature area and becomes sharper. The weight loss rate increases greatly after acid leaching. And the weight loss rate of 4 wt% acid pretreated rice husk is slightly higher than that of 8 wt% acid pretreated rice husk. Almost all the hemicellulose and part of cellulose and lignin are dissolved in the acid leaching process. The decomposition of hemicellulose destroys the integrity of the rice husk structure, which makes the decomposition of lignin become easier, and the decomposition temperature of lignin decreases. On the other hand, the sample was relatively more stable after hemicellulose was removed, which resulted in the pyrolysis temperature increase.32 The altitude of weight loss peak in the third stage is decreased, but the slow carbonization process is prolonged, which is possibly due to the fact that acid leaching process removes the alkali metals in the rice husk and their catalytic activity on the pyrolysis of the rice husk is weaken. Therefore, that acid leaching process is beneficial for the removal of metal impurities. The further decomposition of organic substances which increases the volatilization release rate. The maximum weight loss rate increases from 0.75 to 1.25%/°C.
3.2 Extraction of silica from rice husk by heat treatment
The acid-treated rice husk was placed in an atmosphere furnace for pyrolysis experiment to prepare nano-silica, and the pyrolysis temperature was set at 400–700 °C. The pyrolysis yield was defined as: the sample mass after pyrolysis/the sample mass before pyrolysis × 100%. At 600 °C, the pyrolysis performance of 4 wt% and 8 wt% acid pretreated rice husk were conducted and compared. In the product, there may be some metal impurities remaining. And XRF was used to analyze metal impurities content in samples. The results are shown in Table 3. The rice husk ash was prepared according to GBT28731-2012 (Proximate analysis of solid biofuels). First, weigh 1 g of rice husk with particle size less than 80 meshes and spread it evenly on a flat-bottomed crucible, then put the flat-bottomed crucible into a vacuum furnace, and then raise the temperature to 250 °C within 60 min and keep it at this temperature for 60 min. Next, continue to increase the temperature to 550 °C and burn the sample at the temperature for 2 h. Lastly, take the flat-bottomed crucible out the furnace, cool it to room temperature in a desiccator and weigh the sample.| Composition | Rice husk ash/% | 500 °C sample/% (8%) | 600 °C sample/% (8%) | 700 °C sample/% (8%) | 600 °C sample/% (4%) |
|---|---|---|---|---|---|
| SiO2 | 96.203 | 99.546 | 99.538 | 99.542 | 99.431 |
| SO3 | 0.855 | 0.440 | 0.446 | 0.445 | 0.491 |
| Fe2O3 | 0.422 | 0.008 | 0.010 | 0.007 | 0.008 |
| MnO | 0.058 | 0.006 | 0.007 | 0.006 | 0.006 |
| CuO | 0.048 | — | — | — | — |
| Cr2O3 | 0.067 | — | — | — | — |
| ZnO | 0.020 | — | — | — | — |
| K2O | 1.510 | — | — | — | 0.050 |
| CaO | 0.797 | — | — | — | 0.013 |
| SiO2 purity% | — | 99.357 | 99.448 | 99.532 | 99.331 |
As listed in Table 3, with respect to 8 wt% acid pretreated rice husk, CuO, Cr2O3, ZnO, and K2O in the rice husk are completely removed, SiO2 content is as high as 99.538%. While for 4 wt% acid pretreated rice husk, a small amount of K2O is still remained in the pyrolysis products. As reported,33 K+ had a catalytic effect on the silica dissolution. And the remaining K+ would dissolve SiO2 during the pyrolysis process. And in consideration of complete removal of K+, 8 wt% acid pretreated rice husk is adopted as pyrolysis material in the following study.
Then, 8 wt% acid pretreated rice husk was adopted as the material to study the impacts of temperature on pyrolysis performance. It can be seen from Fig. 3 that the yield decreases with the increase of temperature. The possible reason is that the pyrolysis of carbon-containing compounds in rice husks is incomplete at the lower temperature, and a large part of it is remained in the sample after pyrolysis. The yield of rice husk at 400 °C was 24.6%. When the temperature increased to 600 °C, the yield decreased to 21.5%. When the temperature continued to rise to 700 °C, the yield decreased slightly to 21.3%.
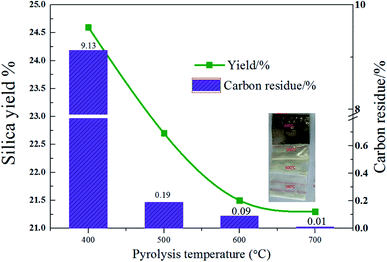 | ||
| Fig. 3 Silica yield and carbon residue content of rice husk (with 8 wt% acid leaching pretreatment) pyrolysis changes with temperature. | ||
As seen from the Fig. 3, it is obvious that the pyrolysis of organic matter is incomplete at low temperatures. An element analyzer was used to analyze the carbon residue in the product. Fig. 3 displays the change of rice husk pyrolysis residual carbon content with temperature. As the temperature increases, the residual carbon content decreases. When the temperature increases from 400 °C to 500 °C, the residual carbon content decreases sharply from 9.13% to 0.19%. When the temperature continues to rise, and the residual carbon reduction rate slows down. It indicates that the pyrolysis is insufficient at the temperature lower than 500 °C, leading to a large amount of remaining organic matter in the sample which appears black at 400 °C. When the pyrolysis temperature is 500 °C, the sample appears light yellow with a small amount of remaining organic matter. When the temperature rises to 600 °C, the residual carbon content reduces to 0.09% with the sample purity increase. The 600 °C sample appears white, indicating that the pyrolysis is sufficient at the temperature. When the pyrolysis temperature is continuously increased, the residual carbon content is further reduced to 0.01%.
The purity of silica = (1 − residual carbon content) × SiO2 content. The residual carbon content is 9.13% at 400 °C, and the purity of silicon dioxide is lower than 90.87%. When the temperature increases to 500 °C, the residual carbon content decreases rapidly. As the temperature continues to increase, the purity of silicon does not change much. Compared with the original rice husk ash content, residual carbon is the main factor which affects the silica purity. Taken together, 600 °C is used as the calcination temperature for the rice husk heat treatment to prepare SiO2. The yield of SiO2 obtained at this temperature is 21.5% and the purity is 99.45%.
3.3 Sample structure and morphology analysis
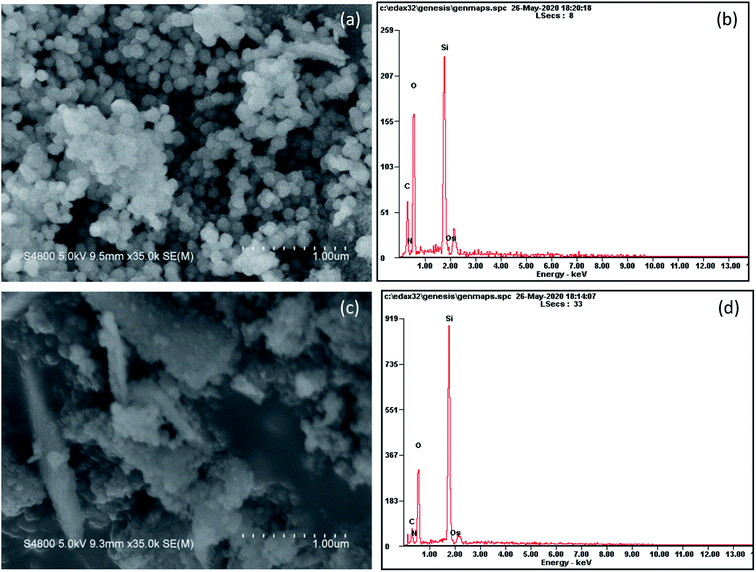
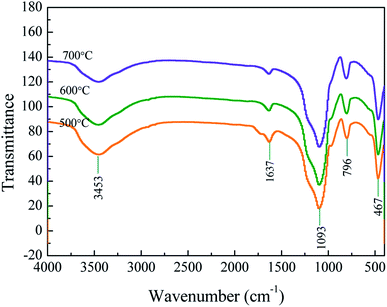
The morphology of samples pyrolyzed at 500 and 700 °C is shown in Fig. 4. At a pyrolysis temperature of 500 °C, the sample has spherical shape and uniform particle size (∼100 nm). At a pyrolysis temperature of 700 °C, the product tends to agglomerate and the shape is flocculent. It can be seen from the EDS surface scan results that the sample contains a certain amount of organic carbon at a low pyrolysis temperature of 500 °C. When the temperature rises to 700 °C, the content of organic carbon is greatly reduced, which is consistent with the results of elemental analysis.In order to get a deep understanding of the impact of pyrolysis temperature on product structure, FT-IR analysis at difference temperature was conducted and the results are displayed in Fig. 5. It can be seen from the figure that the infrared spectrum of the sample contains some specific absorption peaks, among which 467 cm−1, 796 cm−1 and 1093 cm−1 correspond to the stretching vibration of the Si–O bond in SiO4,34 which indicates the existence of silica in the sample.
The weak absorption peak at 1637 cm−1 corresponds to the H–O–H bending vibration peak of water, which is derived from a small amount of water adsorbed on the powder surface. The broad peak at 3100–3600 cm−1 corresponds to the stretching vibration peak of the –OH bond in the structure water.35 When the heat treatment temperature increases, the O–H peak intensity at 3453 cm−1 gradually weakens. Intermolecular dehydration makes Si–OH bonds gradually condense to form Si–O–Si bonds, and Si–O–Si bonds further condense to form spherical polymers.
The peak at 1200–1500 cm−1 corresponds to the vibration peaks of –CH2 and –CH3. As the temperature increases, the organic matter further decomposes and the peak intensity weakens. In the infrared spectrum of the sample obtained at 500 °C, a non-conjugated C![[double bond, length as m-dash]](https://www.rsc.org/images/entities/char_e001.gif) O bond appears at 1700 cm−1. The increase of the heat treatment temperature to 600 °C is accompanied by the gradual disappearance of the C
O bond appears at 1700 cm−1. The increase of the heat treatment temperature to 600 °C is accompanied by the gradual disappearance of the C![[double bond, length as m-dash]](https://www.rsc.org/images/entities/char_e001.gif) O bond at 1700 cm−1 for the cellulose complete decomposition.
O bond at 1700 cm−1 for the cellulose complete decomposition.
According to the above analysis, the pretreatment acid concentration of 8 wt% and pyrolysis temperature of 600 °C are adopted for silica extraction process. The structure of silica samples prepared is analyzed. The specific surface area of silica is as high as 335 m2 g−1. The pore volume of the sample is 0.410 cm3 g−1, almost all of which are mesoporous. The average pore diameter is 4.95 nm. It can be seen from Fig. 6 that the adsorption curve is of type II and H2(b) type hysteresis ring, indicating that the pore structure includes flat seaming, crack and wedge structure. The hysteresis loop is obvious in the middle and high pressure area, and the adsorption capacity increases significantly indicating that the sample contains mesopores. And the curve tends to go up in the high pressure area which indicates that the sample contains a few large pores. It can be seen from the pore size distribution curve that the pore size is mainly concentrated around 4.95 nm, and the pore size distribution is relatively concentrated.
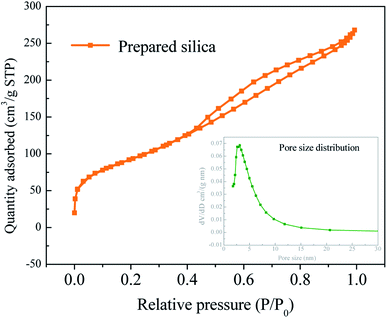 | ||
| Fig. 6 Silica pore size distribution (pretreatment acid concentration: 8 wt%, pyrolysis temperature: 600 °C). | ||
3.4 Acetic acid steam reforming
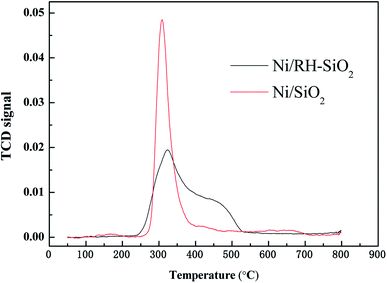
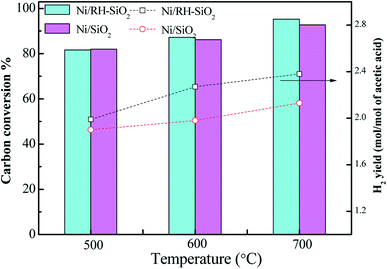
Ni/RH-SiO2 and Ni/SiO2 catalysts were prepared for acetic acid steam reforming. TPR curves of the prepared catalysts are shown in Fig. 7. For Ni/SiO2 catalyst, there is a reduction peak located at 308 °C, which is mainly attributed to the reduction of NiO. For Ni/RH-SiO2, it shows a peak at 322 °C and a shoulder at higher temperature (450 °C). As reported in the literatures,36 higher interaction between Ni2+ and SiO2, associated to reduction peaks at higher temperature. It indicated there is more strong metal–support interaction in Ni/RH-SiO2.Comparison of acetic acid steam reforming over rice husk-based Ni/RH-SiO2 with Ni/SiO2 catalyst is shown in Fig. 8. It can be seen from the figure that the performance of Ni/RH-SiO2 is better than that of Ni/SiO2. For Ni/SiO2, when the reforming temperature rises from 500 to 700 °C, the hydrogen yield increases from 1.99 to 2.38 mol mol−1, and the carbon conversion increases from 81.7 to 95.3%. The results showed that high temperature was beneficial for acetic acid reforming, and Ni/RH-SiO2 catalyst had high activity in acetic acid steam reforming. Nano-silica was applied as support in the preparation of acetic acid steam reforming catalyst (Ni/RH-SiO2) successfully.
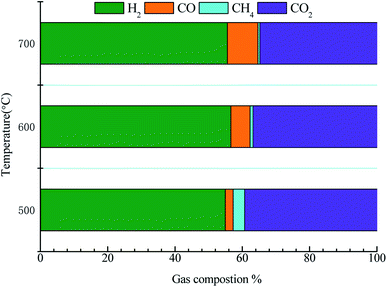
Fig. 9 displays the gas product distribution of acetic acid reforming. The gas by-products mainly include CH4, CO and CO2. The liquid products were collected and analyzed by Agilent 7890A. The content of acetone in the liquid product is very low, less than 0.1%, which is ignored in the study. When the temperature ranges from 500 to 600 °C, CH4 content decreases (from 3.41% to 0.91%), while CO and H2 content increases, which may be due to the occurrence of methanation reaction (CH4 + H2O → CO + 3H2). When the temperature continues to rise, the content of CO increases while the content of H2 and CO2 decreases. This may be because that the reaction between CO and H2O is exothermic (CO + H2O ↔ CO2+H2). As the temperature rises, the reaction goes in the opposite direction, resulting in the increase of CO. In order to reduce the content of CO2 in gas products, some metal additives can be added in our subsequent studies.
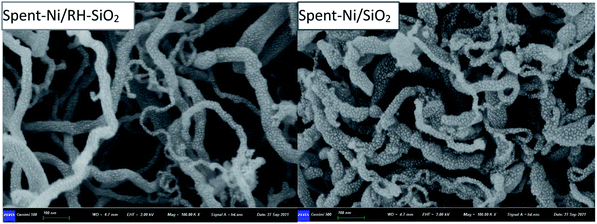
SEM images of spent catalysts are exhibited in Fig. 10. The catalysts after reaction were denoted as spent-Ni/RH-SiO2 and spent-Ni/SiO2. After 6 h reaction, the surface of the spent catalyst is covered with carbon fiber, indicating that the type of carbon deposition is mainly filamentous carbon. The diameter of filamentous carbon is about in the range of 15–75 nm. It is important to notice that SEM images with a large amount of coke are selected to show the morphology of carbon deposition more clearly. And the small spots on the carbon fiber are the golden sprayed during the sample preparation.
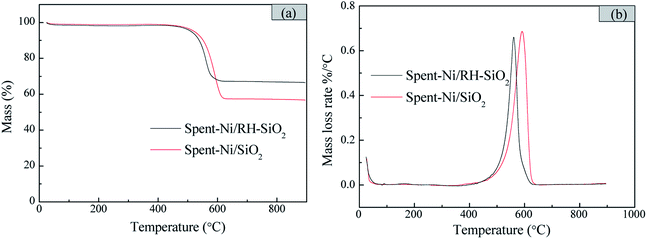
The thermogravimetric analysis (TGA) was conducted to examine the amount and type of carbon deposition formed after 6 h reaction. As shown in Fig. 11, the carbon deposition amount of spent-Ni/RH-SiO2 is lower than that of spent-Ni/SiO2. And the mass loss mainly occurs at 560 and 590 °C for spent-Ni/RH-SiO2 and spent-Ni/SiO2 respectively. The weight loss peak observed at temperature lower than 550 °C in DTG curves is ascribe to amorphous carbon, while the weight loss peak at temperature higher than 550 °C is mainly ascribe to filamentous carbon at different carbonization degrees.37 It indicates that the carbon deposition in spent-Ni/RH-SiO2 is amorphous carbon and filamentous carbon, while the carbon deposition type in spent-Ni/SiO2 is filamentous carbon.
4 In conclusion
The pyrolysis temperature mainly affected the carbon content of the pyrolysis product. The pyrolysis was insufficient at the temperature lower than 500 °C. At 600 °C, nano-silica with the yield of 21.7% and the purity of 99.45% was obtained. The specific surface area was as high as 335 m2 g−1, and the corresponding average pore diameter was 4.95 nm. Nano-silica was applied as support in the preparation of acetic acid steam reforming catalyst (Ni/RH-SiO2) successfully. Ni/RH-SiO2 did better performance than Ni/SiO2. When the reforming temperature was 700 °C, carbon conversion of 95.3% and H2 yield of 2.38 mol mol−1 were obtained. Carbon deposition was found after 6 h test, mainly in the form of filamentous carbon. The carbon deposition amount of spent-Ni/RH-SiO2 was lower than that of spent-Ni/SiO2.Conflicts of interest
The authors have no competing interests to declare.Acknowledgements
This work was supported by the National Natural Science Foundation of China (No. 51906220), Natural Science Foundation of Zhejiang province(LQ19E060002, LZ21E060001), and the National Natural Science Foundation of China (No. 51906219).References
- N. L. Mohd Kamal, S. Beddu, M. F. Nurudinn, N. Shafiq and Z. C. Muda, Appl. Mech. Mater., 2014, 567, 434–439 Search PubMed.
- T. H. Liou, Carbon, 2004, 42(4), 785–794 CrossRef CAS.
- S. Roy, S. Sengupta, S. Manna, M. A. Rahman and P. Das, Desalin. Water Treat., 2018, 105, 73–82 CrossRef CAS.
- R. Hamidi, R. Khoshbin and R. Karimzadeh, Adv. Powder Technol., 2021, 32, 524–534 CrossRef CAS.
- A. Xing, S. Tian and H. Tang, et al., RSC Adv., 2013, 3(26), 10145–10149 RSC.
- Y. Qu, Y. Tian and B. Zou, et al., Bioresour. Technol., 2010, 101(21), 8402–8405 CrossRef CAS PubMed.
- S. Cui, S. Yu and B. Lin, et al., RSC Adv., 2015, 5(81), 65818–65826 RSC.
- T. H. Liou, Mater. Sci. Eng., A, 2004, 364(1–2), 313–323 CrossRef.
- J. Umeda and K. Kondoh, Ind. Crops Prod., 2010, 32(3), 539–544 CrossRef CAS.
- S. Gu, J. Zhou, Z. Luo, Q. Wang and M. Ni, Ind. Crops Prod., 2013, 50(4), 540–549 CrossRef CAS.
- S. H. Javed, U. Aslam, M. Kazmi, M. Rustam, S. Riaz and Z. Munir, Pol. J. Chem. Technol., 2015, 17(3), 47–51 CrossRef CAS.
- Y. Li, J. Y. Lan, J. Liu, J. Yu, Z. Luo, W. Wang and L. Sun, Ind. Eng. Chem. Res., 2015, 54(21), 5656–5663 CrossRef CAS.
- M. H. S. Abadi, A. Delbari, Z. Fakoor and J. Baedi, J. Ceram. Sci. Technol., 2015, 6(1), 41–46 Search PubMed.
- S. Goicoechea, E. Kraleva and H. Ehrich, Fuel Process. Technol., 2017, 158, 247–254 CrossRef CAS.
- N. García-Gómez, B. Valle and J. Valecillos, et al., Fuel Process. Technol., 2021, 215, 106769 CrossRef.
- B. Valle, N. Garcia-Gomez and A. Arandia, et al., Int. J. Hydrogen Energy, 2019, 44(25), 12593–12603 CrossRef CAS.
- C. Italiano, K. Bizkarra and V. L. Barrio, et al., Int. J. Hydrogen Energy, 2019, 44(29), 14671–14682 CrossRef CAS.
- X. Hu and G. Lu, Catal. Commun., 2010, 12(1), 50–53 CrossRef CAS.
- L. P. R. Profeti, E. A. Ticianelli and E. M. Assaf, J. Power Sources, 2008, 175(1), 482–489 CrossRef CAS.
- P. J. Megía, A. J. Vizcaíno and M. Ruiz-Abad, et al., Catal. Today, 2020, 367, 145–152 CrossRef.
- K. Takanabe, K. I. Aika and K. Seshan, et al., Acta Energ. Sol. Sin., 2010, 227(1), 101–108 Search PubMed.
- A. Remiro, A. Arandia and L. Oar-Arteta, et al., Energy Fuels, 2018, 32(3), 3588–3598 CrossRef CAS.
- R. R. Davda, J. W. Shabaker, G. W. Huber, R. D. Cortright and J. A. Dumesic, Appl. Catal., B, 2005, 56, 171–186 CrossRef CAS.
- Z. Zhang, X. Hu and J. Li, et al., Fuel, 2018, 217, 389–403 CrossRef CAS.
- G. Garbarino, C. Wang and I. Valsamakis, et al., Appl. Catal., B, 2015, 174–175, 21–34 CrossRef CAS.
- N. Goyal, K. K. Pant and R. Gupta, Int. J. Hydrogen Energy, 2013, 38(2), 921–933 CrossRef CAS.
- R. Hu, D. Li and H. Xue, et al., Int. J. Hydrogen Energy, 2017, 42, 7786–7797 CrossRef CAS.
- Z. Guo, S. Wang and G. Long, et al., Bioresources, 2011, 6(4), 4092–4102 CAS.
- Z. Zhang, X. Zhang, L. Zhang, Y. Wang, X. Li, S. Zhang, Q. Liu, T. Wei, G. Gao and X. Hu, Energy Convers. Manage., 2020, 205, 112301 CrossRef CAS.
- V. V. Thyssen, T. A. Maia and E. M. Assaf, Fuel, 2013, 105, 358–363 CrossRef CAS.
- C. Wu and P. T. Williams, Environ. Sci. Technol., 2010, 44(15), 5993–5998 CrossRef CAS PubMed.
- T. N. Ang, G. C. Ngoh and A. S. M. Chua, Bioresour. Technol., 2013, 135, 116–119 CrossRef CAS PubMed.
- W. Wang, J. C. Martin, N. Zhang, C. Ma, A. Han and L. J. Sun, Nanopart. Res., 2011, 13, 6981–6990 CrossRef CAS.
- M. Sarangi, P. Nayak and T. N. Tiwari, Composites, Part B, 2011, 42(7), 1994–1998 CrossRef.
- J. R. Martinez, F. Ruiz, Y. V. Vorobiev, F. Perez-Robles and J. Gonzalez-Hernandez, J. Chem. Phys., 1998, 109(17), 7511–7514 CrossRef CAS.
- A. J. Vizcaíno, A. Carrero and J. A. Calles, Int. J. Hydrogen Energy, 2007, 32, 1450–1461 CrossRef.
- A. Carrero, J. A. Calles and A. J. Vizcaíno, Chem. Eng. J., 2010, 163(3), 395–402 CrossRef CAS.
| This journal is © The Royal Society of Chemistry 2021 |

